Immigrants from West Indies Disability Age 5 to 17

COMPARE

Immigrants from West Indies
Race
Ancestry
AfghanAfricanAlaska NativeAlaskan AthabascanAlbanianAleutAlsatianAmericanApacheArabArapahoArgentineanArmenianAssyrian/Chaldean/SyriacAustralianAustrianBahamianBangladeshiBarbadianBasqueBelgianBelizeanBermudanBhutaneseBlackfeetBolivianBrazilianBritishBritish West IndianBulgarianBurmeseCajunCambodianCanadianCape VerdeanCarpatho RusynCelticCentral AmericanCentral American IndianCherokeeCheyenneChickasawChileanChineseChippewaChoctawColombianColvilleComancheCosta RicanCreeCreekCroatianCrowCubanCypriotCzechCzechoslovakianDanishDelawareDominicanDutchDutch West IndianEastern EuropeanEcuadorianEgyptianEnglishEstonianEthiopianEuropeanFijianFilipinoFinnishFrenchFrench American IndianFrench CanadianGermanGerman RussianGhanaianGreekGuamanian/ChamorroGuatemalanGuyaneseHaitianHmongHonduranHopiHoumaHungarianIcelanderIndian (Asian)IndonesianInupiatIranianIraqiIrishIroquoisIsraeliItalianJamaicanJapaneseJordanianKenyanKiowaKoreanLaotianLatvianLebaneseLiberianLithuanianLumbeeLuxembourgerMacedonianMalaysianMalteseMarshalleseMenomineeMexicanMexican American IndianMongolianMoroccanNative HawaiianNavajoNepaleseNew ZealanderNicaraguanNigerianNorthern EuropeanNorwegianOkinawanOsageOttawaPaiutePakistaniPalestinianPanamanianParaguayanPennsylvania GermanPeruvianPimaPolishPortuguesePotawatomiPuebloPuerto RicanPuget Sound SalishRomanianRussianSalvadoranSamoanScandinavianScotch-IrishScottishSeminoleSenegaleseSerbianShoshoneSierra LeoneanSiouxSlavicSlovakSloveneSomaliSouth AfricanSouth AmericanSouth American IndianSoviet UnionSpaniardSpanishSpanish AmericanSpanish American IndianSri LankanSubsaharan AfricanSudaneseSwedishSwissSyrianTaiwaneseThaiTlingit-HaidaTohono O'OdhamTonganTrinidadian and TobagonianTsimshianTurkishU.S. Virgin IslanderUgandanUkrainianUruguayanUteVenezuelanVietnameseWelshWest IndianYakamaYaquiYugoslavianYumanYup'ikZimbabwean
Immigration
NonimmigrantsImmigrantsAfghanistanAfricaAlbaniaArgentinaArmeniaAsiaAustraliaAustriaBahamasBangladeshBarbadosBelarusBelgiumBelizeBoliviaBosnia and HerzegovinaBrazilBulgariaBurma/MyanmarCabo VerdeCambodiaCameroonCanadaCaribbeanCentral AmericaChileChinaColombiaCongoCosta RicaCroatiaCubaCzechoslovakiaDenmarkDominicaDominican RepublicEastern AfricaEastern AsiaEastern EuropeEcuadorEgyptEl SalvadorEnglandEritreaEthiopiaEuropeFijiFranceGermanyGhanaGreeceGrenadaGuatemalaGuyanaHaitiHondurasHong KongHungaryIndiaIndonesiaIranIraqIrelandIsraelItalyJamaicaJapanJordanKazakhstanKenyaKoreaKuwaitLaosLatin AmericaLatviaLebanonLiberiaLithuaniaMalaysiaMexicoMicronesiaMiddle AfricaMoldovaMoroccoNepalNetherlandsNicaraguaNigeriaNorth AmericaNorth MacedoniaNorthern AfricaNorthern EuropeNorwayOceaniaPakistanPanamaPeruPhilippinesPolandPortugalRomaniaRussiaSaudi ArabiaScotlandSenegalSerbiaSierra LeoneSingaporeSomaliaSouth AfricaSouth AmericaSouth Central AsiaSouth Eastern AsiaSouthern EuropeSpainSri LankaSt. Vincent and the GrenadinesSudanSwedenSwitzerlandSyriaTaiwanThailandTrinidad and TobagoTurkeyUgandaUkraineUruguayUzbekistanVenezuelaVietnamWest IndiesWestern AfricaWestern AsiaWestern EuropeYemenZaireZimbabweAzores
Select to Compare
Race
Ancestry
AfghanAfricanAlaska NativeAlaskan AthabascanAlbanianAleutAlsatianAmericanApacheArabArapahoArgentineanArmenianAssyrian/Chaldean/SyriacAustralianAustrianBahamianBangladeshiBarbadianBasqueBelgianBelizeanBermudanBhutaneseBlackfeetBolivianBrazilianBritishBritish West IndianBulgarianBurmeseCajunCambodianCanadianCape VerdeanCarpatho RusynCelticCentral AmericanCentral American IndianCherokeeCheyenneChickasawChileanChineseChippewaChoctawColombianColvilleComancheCosta RicanCreeCreekCroatianCrowCubanCypriotCzechCzechoslovakianDanishDelawareDominicanDutchDutch West IndianEastern EuropeanEcuadorianEgyptianEnglishEstonianEthiopianEuropeanFijianFilipinoFinnishFrenchFrench American IndianFrench CanadianGermanGerman RussianGhanaianGreekGuamanian/ChamorroGuatemalanGuyaneseHaitianHmongHonduranHopiHoumaHungarianIcelanderIndian (Asian)IndonesianInupiatIranianIraqiIrishIroquoisIsraeliItalianJamaicanJapaneseJordanianKenyanKiowaKoreanLaotianLatvianLebaneseLiberianLithuanianLumbeeLuxembourgerMacedonianMalaysianMalteseMarshalleseMenomineeMexicanMexican American IndianMongolianMoroccanNative HawaiianNavajoNepaleseNew ZealanderNicaraguanNigerianNorthern EuropeanNorwegianOkinawanOsageOttawaPaiutePakistaniPalestinianPanamanianParaguayanPennsylvania GermanPeruvianPimaPolishPortuguesePotawatomiPuebloPuerto RicanPuget Sound SalishRomanianRussianSalvadoranSamoanScandinavianScotch-IrishScottishSeminoleSenegaleseSerbianShoshoneSierra LeoneanSiouxSlavicSlovakSloveneSomaliSouth AfricanSouth AmericanSouth American IndianSoviet UnionSpaniardSpanishSpanish AmericanSpanish American IndianSri LankanSubsaharan AfricanSudaneseSwedishSwissSyrianTaiwaneseThaiTlingit-HaidaTohono O'OdhamTonganTrinidadian and TobagonianTsimshianTurkishU.S. Virgin IslanderUgandanUkrainianUruguayanUteVenezuelanVietnameseWelshWest IndianYakamaYaquiYugoslavianYumanYup'ikZimbabwean
Immigration
NonimmigrantsImmigrantsAfghanistanAfricaAlbaniaArgentinaArmeniaAsiaAustraliaAustriaBahamasBangladeshBarbadosBelarusBelgiumBelizeBoliviaBosnia and HerzegovinaBrazilBulgariaBurma/MyanmarCabo VerdeCambodiaCameroonCanadaCaribbeanCentral AmericaChileChinaColombiaCongoCosta RicaCroatiaCubaCzechoslovakiaDenmarkDominicaDominican RepublicEastern AfricaEastern AsiaEastern EuropeEcuadorEgyptEl SalvadorEnglandEritreaEthiopiaEuropeFijiFranceGermanyGhanaGreeceGrenadaGuatemalaGuyanaHaitiHondurasHong KongHungaryIndiaIndonesiaIranIraqIrelandIsraelItalyJamaicaJapanJordanKazakhstanKenyaKoreaKuwaitLaosLatin AmericaLatviaLebanonLiberiaLithuaniaMalaysiaMexicoMicronesiaMiddle AfricaMoldovaMoroccoNepalNetherlandsNicaraguaNigeriaNorth AmericaNorth MacedoniaNorthern AfricaNorthern EuropeNorwayOceaniaPakistanPanamaPeruPhilippinesPolandPortugalRomaniaRussiaSaudi ArabiaScotlandSenegalSerbiaSierra LeoneSingaporeSomaliaSouth AfricaSouth AmericaSouth Central AsiaSouth Eastern AsiaSouthern EuropeSpainSri LankaSt. Vincent and the GrenadinesSudanSwedenSwitzerlandSyriaTaiwanThailandTrinidad and TobagoTurkeyUgandaUkraineUruguayUzbekistanVenezuelaVietnamWestern AfricaWestern AsiaWestern EuropeYemenZaireZimbabweAzores
Disability Age 5 to 17
Income
Poverty
Unemployment
Labor Participation
Family Structure
Vehicle Availability
Education Level
Disability

Immigrants from West Indies Disability Age 5 to 17
Tragic

5.8%
DISABILITY | AGE 5 TO 17
3.5/ 100
METRIC RATING
233rd/ 347
METRIC RANK

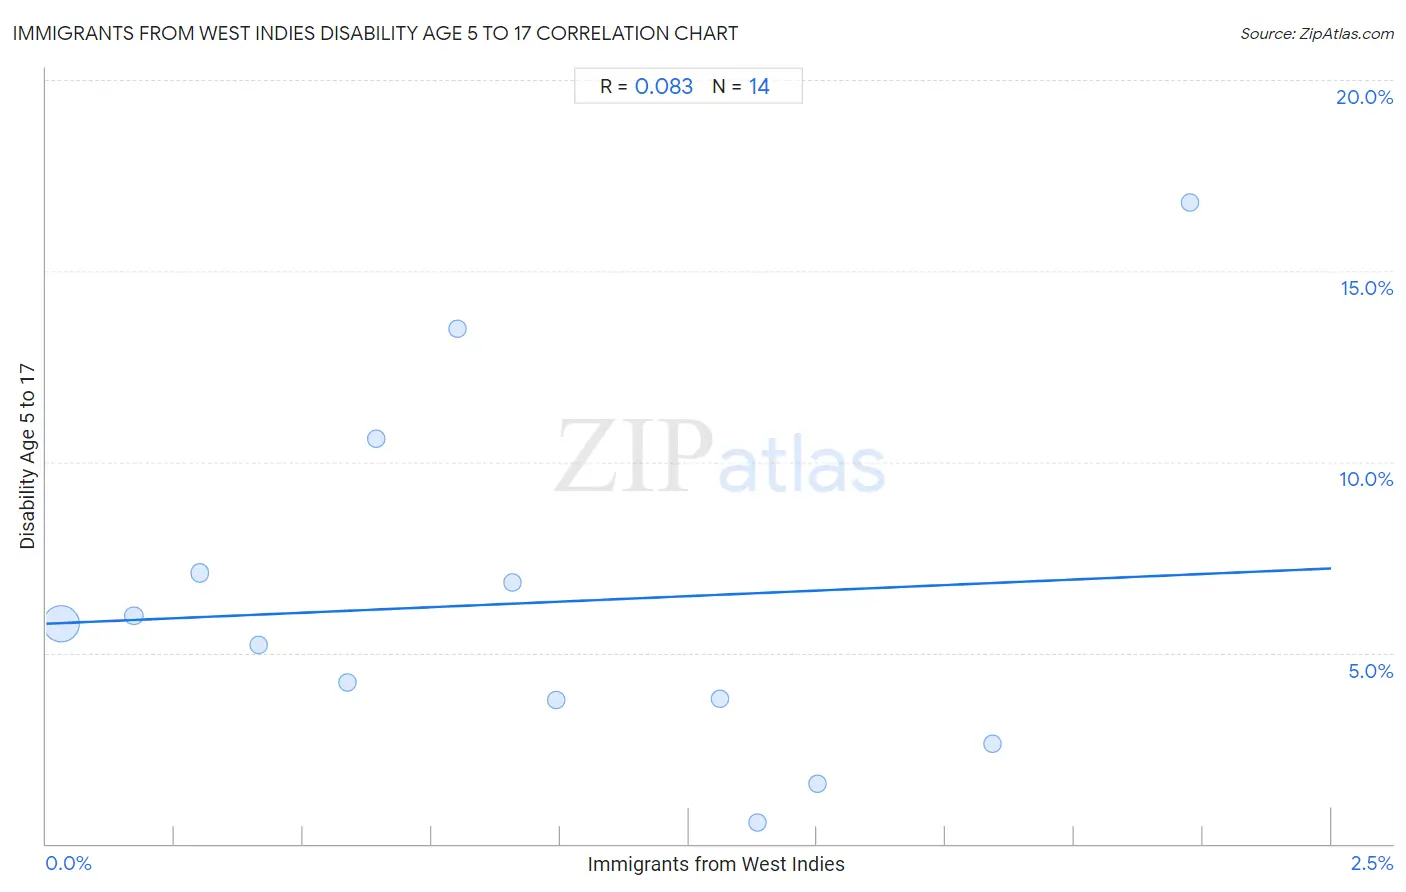
Immigrants from West Indies Disability Age 5 to 17 Correlation Chart

The statistical analysis conducted on geographies consisting of 72,374,754 people shows a slight positive correlation between the proportion of Immigrants from West Indies and percentage of population with a disability between the ages 5 and 17 in the United States with a correlation coefficient (R) of 0.083 and weighted average of 5.8%. On average, for every 1% (one percent) increase in Immigrants from West Indies within a typical geography, there is an increase of 0.58% in percentage of population with a disability between the ages 5 and 17.
Immigrants from West Indies Disability Age 5 to 17
It is essential to understand that the correlation between the percentage of Immigrants from West Indies and percentage of population with a disability between the ages 5 and 17 does not imply a direct cause-and-effect relationship. It remains uncertain whether the presence of Immigrants from West Indies influences an upward or downward trend in the level of percentage of population with a disability between the ages 5 and 17 within an area, or if Immigrants from West Indies simply ended up residing in those areas with higher or lower levels of percentage of population with a disability between the ages 5 and 17 due to other factors.

Demographics Similar to Immigrants from West Indies by Disability Age 5 to 17

In terms of disability age 5 to 17, the demographic groups most similar to Immigrants from West Indies are Immigrants from Kenya (5.8%, a difference of 0.040%), Malaysian (5.8%, a difference of 0.050%), Immigrants from Laos (5.8%, a difference of 0.090%), Immigrants from Brazil (5.8%, a difference of 0.11%), and Sudanese (5.8%, a difference of 0.26%).
DemographicsRating | RankDisability Age 5 to 17
British West Indians
5.4
/100
|
#226
Tragic
5.8%
Swiss
5.1
/100
|
#227
Tragic
5.8%
Haitians
4.8
/100
|
#228
Tragic
5.8%
Bangladeshis
4.8
/100
|
#229
Tragic
5.8%
Ghanaians
4.7
/100
|
#230
Tragic
5.8%
Europeans
4.5
/100
|
#231
Tragic
5.8%
Immigrants from Laos
3.8
/100
|
#232
Tragic
5.8%
Immigrants from West Indies
3.5
/100
|
#233
Tragic
5.8%
Immigrants from Kenya
3.4
/100
|
#234
Tragic
5.8%
Malaysians
3.4
/100
|
#235
Tragic
5.8%
Immigrants from Brazil
3.2
/100
|
#236
Tragic
5.8%
Sudanese
2.9
/100
|
#237
Tragic
5.8%
Hungarians
2.6
/100
|
#238
Tragic
5.8%
German Russians
2.4
/100
|
#239
Tragic
5.9%
West Indians
2.4
/100
|
#240
Tragic
5.9%

Immigrants from West Indies Disability Age 5 to 17 Correlation Summary

MeasurementImmigrants from West Indies DataDisability Age 5 to 17 Data
Minimum0.029%0.57%
Maximum2.2%16.8%
Range2.2%16.2%
Mean0.94%6.3%
Median0.85%5.5%
Interquartile 25% (IQ1)0.41%3.8%
Interquartile 75% (IQ3)1.4%7.1%
Interquartile Range (IQR)0.97%3.3%
Standard Deviation (Sample)0.65%4.5%
Standard Deviation (Population)0.62%4.4%

Correlation Details

Immigrants from West Indies PercentileSample SizeDisability Age 5 to 17
[
0.0%
-
0.5%
]
0.029%
66,194,8705.8%
[
0.0%
-
0.5%
]
0.17%
3,567,9106.0%
[
0.0%
-
0.5%
]
0.30%
1,428,0837.1%
[
0.0%
-
0.5%
]
0.41%
530,3795.2%
[
0.5%
-
1.0%
]
0.58%
334,1994.2%
[
0.5%
-
1.0%
]
0.64%
117,59810.6%
[
0.5%
-
1.0%
]
0.80%
10,23913.5%
[
0.5%
-
1.0%
]
0.91%
37,0376.8%
[
0.5%
-
1.0%
]
0.99%
20,0783.8%
[
1.0%
-
1.5%
]
1.31%
104,5073.8%
[
1.0%
-
1.5%
]
1.38%
10,3350.57%
[
1.0%
-
1.5%
]
1.50%
16,8081.6%
[
1.5%
-
2.0%
]
1.84%
2,1722.6%
[
2.0%
-
2.5%
]
2.23%
53916.8%