Immigrants from Caribbean Disability Age 5 to 17
COMPARE
Immigrants from Caribbean
Select to Compare
Disability Age 5 to 17
Immigrants from Caribbean Disability Age 5 to 17
5.9%
DISABILITY | AGE 5 TO 17
2.1/ 100
METRIC RATING
241st/ 347
METRIC RANK
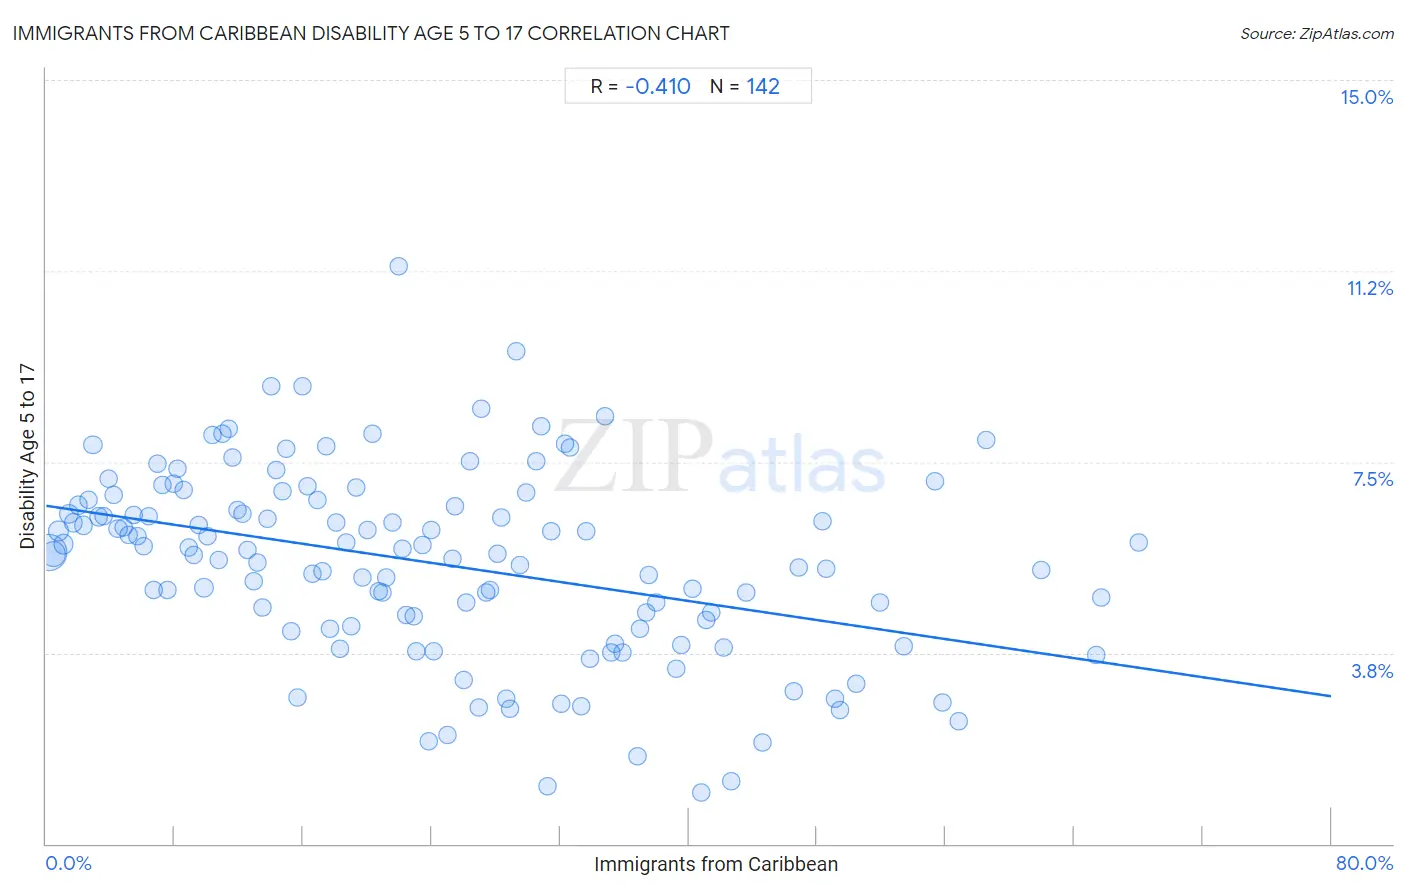
Immigrants from Caribbean Disability Age 5 to 17 Correlation Chart
The statistical analysis conducted on geographies consisting of 445,217,348 people shows a moderate negative correlation between the proportion of Immigrants from Caribbean and percentage of population with a disability between the ages 5 and 17 in the United States with a correlation coefficient (R) of -0.410 and weighted average of 5.9%. On average, for every 1% (one percent) increase in Immigrants from Caribbean within a typical geography, there is a decrease of 0.047% in percentage of population with a disability between the ages 5 and 17.
It is essential to understand that the correlation between the percentage of Immigrants from Caribbean and percentage of population with a disability between the ages 5 and 17 does not imply a direct cause-and-effect relationship. It remains uncertain whether the presence of Immigrants from Caribbean influences an upward or downward trend in the level of percentage of population with a disability between the ages 5 and 17 within an area, or if Immigrants from Caribbean simply ended up residing in those areas with higher or lower levels of percentage of population with a disability between the ages 5 and 17 due to other factors.
Demographics Similar to Immigrants from Caribbean by Disability Age 5 to 17
In terms of disability age 5 to 17, the demographic groups most similar to Immigrants from Caribbean are Spaniard (5.9%, a difference of 0.080%), Indonesian (5.9%, a difference of 0.090%), West Indian (5.9%, a difference of 0.13%), German Russian (5.9%, a difference of 0.15%), and Immigrants from Germany (5.9%, a difference of 0.15%).
| Demographics | Rating | Rank | Disability Age 5 to 17 |
| Immigrants from Kenya | 3.4 /100 | #234 | Tragic 5.8% |
| Malaysians | 3.4 /100 | #235 | Tragic 5.8% |
| Immigrants from Brazil | 3.2 /100 | #236 | Tragic 5.8% |
| Sudanese | 2.9 /100 | #237 | Tragic 5.8% |
| Hungarians | 2.6 /100 | #238 | Tragic 5.8% |
| German Russians | 2.4 /100 | #239 | Tragic 5.9% |
| West Indians | 2.4 /100 | #240 | Tragic 5.9% |
| Immigrants from Caribbean | 2.1 /100 | #241 | Tragic 5.9% |
| Spaniards | 2.0 /100 | #242 | Tragic 5.9% |
| Indonesians | 2.0 /100 | #243 | Tragic 5.9% |
| Immigrants from Germany | 1.9 /100 | #244 | Tragic 5.9% |
| Immigrants from Micronesia | 1.9 /100 | #245 | Tragic 5.9% |
| Tlingit-Haida | 1.9 /100 | #246 | Tragic 5.9% |
| Immigrants from Honduras | 1.8 /100 | #247 | Tragic 5.9% |
| British | 1.7 /100 | #248 | Tragic 5.9% |
Immigrants from Caribbean Disability Age 5 to 17 Correlation Summary
| Measurement | Immigrants from Caribbean Data | Disability Age 5 to 17 Data |
| Minimum | 0.14% | 1.0% |
| Maximum | 68.0% | 11.3% |
| Range | 67.9% | 10.3% |
| Mean | 24.1% | 5.5% |
| Median | 22.0% | 5.7% |
| Interquartile 25% (IQ1) | 11.0% | 4.3% |
| Interquartile 75% (IQ3) | 34.8% | 6.7% |
| Interquartile Range (IQR) | 23.8% | 2.4% |
| Standard Deviation (Sample) | 16.3% | 1.9% |
| Standard Deviation (Population) | 16.2% | 1.8% |
Correlation Details
| Immigrants from Caribbean Percentile | Sample Size | Disability Age 5 to 17 |
[ 0.0% - 0.5% ] 0.14% | 213,002,560 | 5.7% |
[ 0.0% - 0.5% ] 0.43% | 78,789,724 | 5.7% |
[ 0.5% - 1.0% ] 0.77% | 34,419,946 | 6.1% |
[ 1.0% - 1.5% ] 1.08% | 19,608,695 | 5.9% |
[ 1.0% - 1.5% ] 1.38% | 11,847,503 | 6.5% |
[ 1.5% - 2.0% ] 1.70% | 9,010,892 | 6.3% |
[ 2.0% - 2.5% ] 2.01% | 7,859,443 | 6.7% |
[ 2.0% - 2.5% ] 2.31% | 6,113,101 | 6.3% |
[ 2.5% - 3.0% ] 2.64% | 4,925,679 | 6.8% |
[ 2.5% - 3.0% ] 2.91% | 4,441,946 | 7.8% |
[ 3.0% - 3.5% ] 3.25% | 2,683,438 | 6.4% |
[ 3.5% - 4.0% ] 3.55% | 2,210,827 | 6.4% |
[ 3.5% - 4.0% ] 3.87% | 2,070,735 | 7.2% |
[ 4.0% - 4.5% ] 4.18% | 1,745,614 | 6.8% |
[ 4.0% - 4.5% ] 4.47% | 1,712,139 | 6.2% |
[ 4.5% - 5.0% ] 4.80% | 1,578,182 | 6.2% |
[ 5.0% - 5.5% ] 5.10% | 1,354,972 | 6.1% |
[ 5.0% - 5.5% ] 5.42% | 1,353,145 | 6.5% |
[ 5.5% - 6.0% ] 5.71% | 1,139,432 | 6.0% |
[ 6.0% - 6.5% ] 6.04% | 1,639,694 | 5.8% |
[ 6.0% - 6.5% ] 6.35% | 891,934 | 6.4% |
[ 6.5% - 7.0% ] 6.67% | 1,133,614 | 5.0% |
[ 6.5% - 7.0% ] 6.93% | 1,047,530 | 7.5% |
[ 7.0% - 7.5% ] 7.22% | 1,338,321 | 7.0% |
[ 7.5% - 8.0% ] 7.56% | 788,217 | 5.0% |
[ 7.5% - 8.0% ] 7.91% | 845,302 | 7.1% |
[ 8.0% - 8.5% ] 8.19% | 679,698 | 7.4% |
[ 8.5% - 9.0% ] 8.57% | 1,287,255 | 6.9% |
[ 8.5% - 9.0% ] 8.83% | 418,818 | 5.8% |
[ 9.0% - 9.5% ] 9.15% | 559,967 | 5.7% |
[ 9.0% - 9.5% ] 9.47% | 864,282 | 6.3% |
[ 9.5% - 10.0% ] 9.82% | 9,193,975 | 5.0% |
[ 10.0% - 10.5% ] 10.04% | 369,228 | 6.0% |
[ 10.0% - 10.5% ] 10.34% | 549,774 | 8.0% |
[ 10.5% - 11.0% ] 10.73% | 115,743 | 5.6% |
[ 10.5% - 11.0% ] 10.98% | 578,756 | 8.1% |
[ 11.0% - 11.5% ] 11.37% | 393,082 | 8.2% |
[ 11.5% - 12.0% ] 11.58% | 596,561 | 7.6% |
[ 11.5% - 12.0% ] 11.94% | 651,685 | 6.5% |
[ 12.0% - 12.5% ] 12.23% | 666,713 | 6.5% |
[ 12.5% - 13.0% ] 12.50% | 296,773 | 5.8% |
[ 12.5% - 13.0% ] 12.90% | 244,115 | 5.2% |
[ 13.0% - 13.5% ] 13.15% | 246,127 | 5.5% |
[ 13.0% - 13.5% ] 13.49% | 304,024 | 4.6% |
[ 13.5% - 14.0% ] 13.79% | 423,313 | 6.4% |
[ 14.0% - 14.5% ] 14.01% | 151,379 | 9.0% |
[ 14.0% - 14.5% ] 14.35% | 592,773 | 7.3% |
[ 14.5% - 15.0% ] 14.73% | 320,352 | 6.9% |
[ 14.5% - 15.0% ] 14.98% | 330,345 | 7.8% |
[ 15.0% - 15.5% ] 15.29% | 325,318 | 4.2% |
[ 15.5% - 16.0% ] 15.66% | 169,309 | 2.9% |
[ 15.5% - 16.0% ] 15.92% | 109,805 | 9.0% |
[ 16.0% - 16.5% ] 16.26% | 210,886 | 7.0% |
[ 16.5% - 17.0% ] 16.61% | 370,147 | 5.3% |
[ 16.5% - 17.0% ] 16.90% | 595,841 | 6.7% |
[ 17.0% - 17.5% ] 17.16% | 283,731 | 5.4% |
[ 17.0% - 17.5% ] 17.43% | 221,404 | 7.8% |
[ 17.5% - 18.0% ] 17.69% | 60,268 | 4.2% |
[ 18.0% - 18.5% ] 18.05% | 299,765 | 6.3% |
[ 18.0% - 18.5% ] 18.28% | 38,628 | 3.8% |
[ 18.5% - 19.0% ] 18.69% | 265,280 | 5.9% |
[ 18.5% - 19.0% ] 18.96% | 131,557 | 4.3% |
[ 19.0% - 19.5% ] 19.29% | 131,218 | 7.0% |
[ 19.5% - 20.0% ] 19.68% | 260,686 | 5.2% |
[ 20.0% - 20.5% ] 20.04% | 220,417 | 6.2% |
[ 20.0% - 20.5% ] 20.33% | 43,651 | 8.0% |
[ 20.5% - 21.0% ] 20.70% | 212,055 | 5.0% |
[ 20.5% - 21.0% ] 20.91% | 255,565 | 4.9% |
[ 21.0% - 21.5% ] 21.19% | 311,639 | 5.2% |
[ 21.5% - 22.0% ] 21.59% | 164,770 | 6.3% |
[ 21.5% - 22.0% ] 21.94% | 79,817 | 11.3% |
[ 22.0% - 22.5% ] 22.14% | 234,023 | 5.8% |
[ 22.0% - 22.5% ] 22.45% | 444,921 | 4.5% |
[ 22.5% - 23.0% ] 22.92% | 195,693 | 4.5% |
[ 23.0% - 23.5% ] 23.03% | 184,030 | 3.8% |
[ 23.0% - 23.5% ] 23.42% | 398,558 | 5.9% |
[ 23.5% - 24.0% ] 23.79% | 48,613 | 2.0% |
[ 23.5% - 24.0% ] 23.95% | 120,060 | 6.2% |
[ 24.0% - 24.5% ] 24.16% | 29,400 | 3.8% |
[ 24.5% - 25.0% ] 24.99% | 82,011 | 2.1% |
[ 25.0% - 25.5% ] 25.30% | 122,040 | 5.6% |
[ 25.0% - 25.5% ] 25.46% | 42,404 | 6.6% |
[ 25.5% - 26.0% ] 25.96% | 22,927 | 3.2% |
[ 26.0% - 26.5% ] 26.18% | 34,760 | 4.7% |
[ 26.0% - 26.5% ] 26.42% | 134,829 | 7.5% |
[ 26.5% - 27.0% ] 26.91% | 68,832 | 2.7% |
[ 27.0% - 27.5% ] 27.09% | 200,454 | 8.6% |
[ 27.0% - 27.5% ] 27.40% | 177,910 | 4.9% |
[ 27.5% - 28.0% ] 27.66% | 193,399 | 5.0% |
[ 28.0% - 28.5% ] 28.06% | 86,601 | 5.7% |
[ 28.0% - 28.5% ] 28.35% | 192,003 | 6.4% |
[ 28.5% - 29.0% ] 28.63% | 88,917 | 2.8% |
[ 28.5% - 29.0% ] 28.87% | 83,669 | 2.7% |
[ 29.0% - 29.5% ] 29.27% | 94,023 | 9.7% |
[ 29.5% - 30.0% ] 29.51% | 517,199 | 5.5% |
[ 29.5% - 30.0% ] 29.85% | 145,958 | 6.9% |
[ 30.5% - 31.0% ] 30.51% | 128,523 | 7.5% |
[ 30.5% - 31.0% ] 30.80% | 90,432 | 8.2% |
[ 31.0% - 31.5% ] 31.20% | 37,954 | 1.1% |
[ 31.0% - 31.5% ] 31.47% | 126,032 | 6.1% |
[ 32.0% - 32.5% ] 32.04% | 29,240 | 2.8% |
[ 32.0% - 32.5% ] 32.29% | 72,002 | 7.9% |
[ 32.5% - 33.0% ] 32.59% | 162,741 | 7.8% |
[ 33.0% - 33.5% ] 33.33% | 121,630 | 2.7% |
[ 33.5% - 34.0% ] 33.59% | 13,781 | 6.1% |
[ 33.5% - 34.0% ] 33.82% | 152,082 | 3.6% |
[ 34.5% - 35.0% ] 34.82% | 221,208 | 8.4% |
[ 35.0% - 35.5% ] 35.14% | 130,749 | 3.8% |
[ 35.0% - 35.5% ] 35.41% | 73,798 | 3.9% |
[ 35.5% - 36.0% ] 35.89% | 90,475 | 3.8% |
[ 36.5% - 37.0% ] 36.77% | 60,466 | 1.7% |
[ 36.5% - 37.0% ] 36.93% | 47,116 | 4.2% |
[ 37.0% - 37.5% ] 37.34% | 131,244 | 4.6% |
[ 37.5% - 38.0% ] 37.54% | 20,140 | 5.3% |
[ 38.0% - 38.5% ] 38.01% | 129,150 | 4.7% |
[ 39.0% - 39.5% ] 39.21% | 34,725 | 3.4% |
[ 39.5% - 40.0% ] 39.53% | 98,575 | 3.9% |
[ 40.0% - 40.5% ] 40.26% | 5,303 | 5.0% |
[ 40.5% - 41.0% ] 40.77% | 13,877 | 1.0% |
[ 41.0% - 41.5% ] 41.07% | 75,037 | 4.4% |
[ 41.0% - 41.5% ] 41.40% | 69,663 | 4.5% |
[ 42.0% - 42.5% ] 42.22% | 13,824 | 3.9% |
[ 42.5% - 43.0% ] 42.68% | 34,335 | 1.2% |
[ 43.5% - 44.0% ] 43.57% | 52,661 | 4.9% |
[ 44.5% - 45.0% ] 44.60% | 19,399 | 2.0% |
[ 46.5% - 47.0% ] 46.51% | 55,241 | 3.0% |
[ 46.5% - 47.0% ] 46.83% | 24,597 | 5.4% |
[ 48.0% - 48.5% ] 48.31% | 40,739 | 6.3% |
[ 48.5% - 49.0% ] 48.55% | 10,725 | 5.4% |
[ 49.0% - 49.5% ] 49.08% | 52,851 | 2.9% |
[ 49.0% - 49.5% ] 49.45% | 53,765 | 2.6% |
[ 50.0% - 50.5% ] 50.47% | 50,233 | 3.1% |
[ 51.5% - 52.0% ] 51.94% | 46,798 | 4.7% |
[ 53.0% - 53.5% ] 53.39% | 52,047 | 3.9% |
[ 55.0% - 55.5% ] 55.34% | 45,620 | 7.1% |
[ 55.5% - 56.0% ] 55.83% | 20,850 | 2.8% |
[ 56.5% - 57.0% ] 56.81% | 22,815 | 2.4% |
[ 58.5% - 59.0% ] 58.50% | 26,596 | 7.9% |
[ 61.5% - 62.0% ] 61.95% | 222,996 | 5.4% |
[ 65.0% - 65.5% ] 65.40% | 29,830 | 3.7% |
[ 65.5% - 66.0% ] 65.67% | 71,088 | 4.8% |
[ 68.0% - 68.5% ] 68.02% | 42,081 | 5.9% |