Immigrants from Uganda Disability Age 5 to 17
COMPARE
Immigrants from Uganda
Select to Compare
Disability Age 5 to 17
Immigrants from Uganda Disability Age 5 to 17
5.8%
DISABILITY | AGE 5 TO 17
9.7/ 100
METRIC RATING
209th/ 347
METRIC RANK
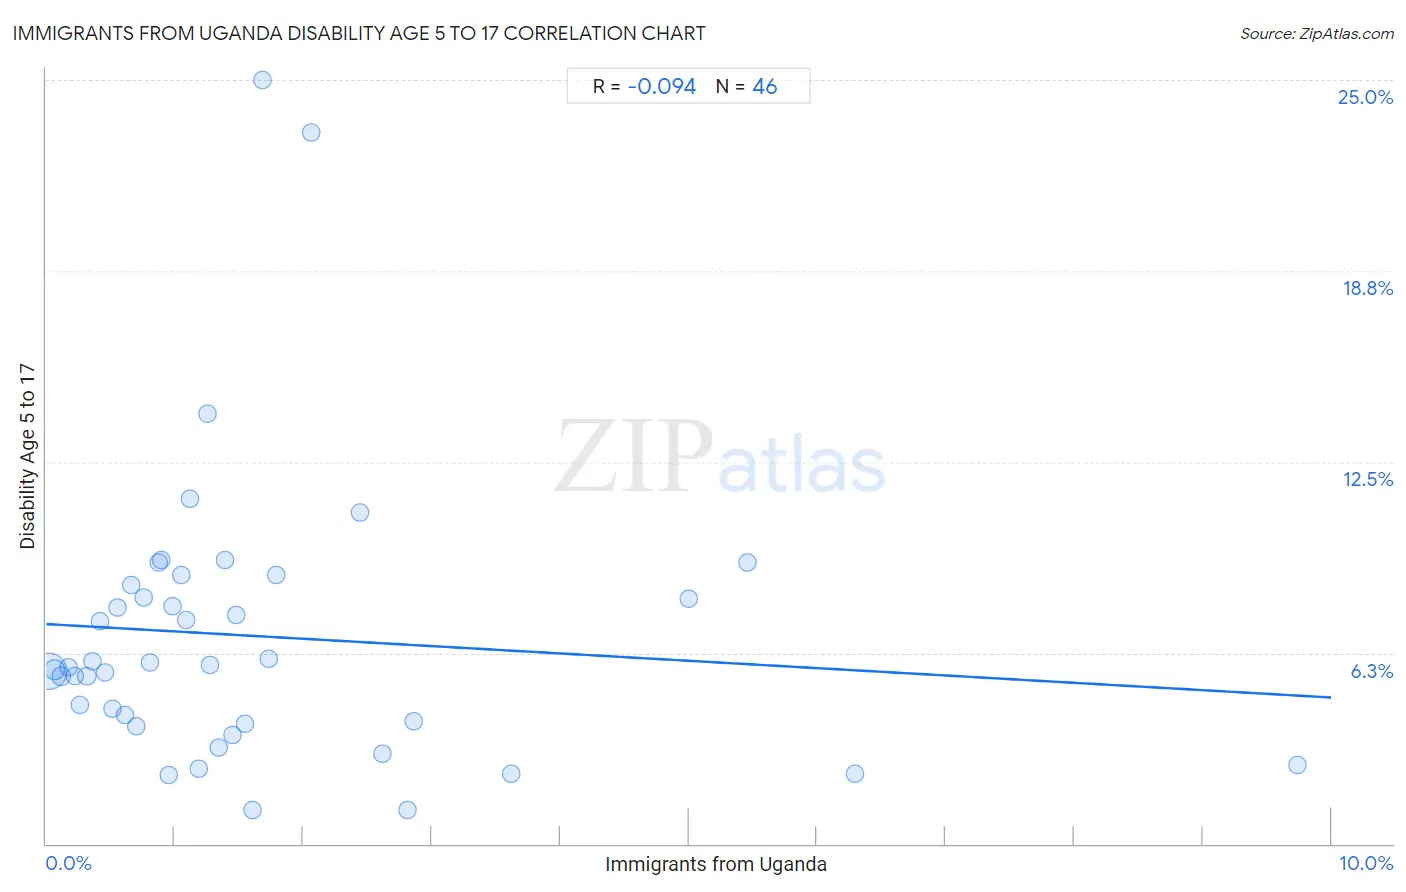
Immigrants from Uganda Disability Age 5 to 17 Correlation Chart
The statistical analysis conducted on geographies consisting of 125,737,138 people shows a slight negative correlation between the proportion of Immigrants from Uganda and percentage of population with a disability between the ages 5 and 17 in the United States with a correlation coefficient (R) of -0.094 and weighted average of 5.8%. On average, for every 1% (one percent) increase in Immigrants from Uganda within a typical geography, there is a decrease of 0.24% in percentage of population with a disability between the ages 5 and 17.
It is essential to understand that the correlation between the percentage of Immigrants from Uganda and percentage of population with a disability between the ages 5 and 17 does not imply a direct cause-and-effect relationship. It remains uncertain whether the presence of Immigrants from Uganda influences an upward or downward trend in the level of percentage of population with a disability between the ages 5 and 17 within an area, or if Immigrants from Uganda simply ended up residing in those areas with higher or lower levels of percentage of population with a disability between the ages 5 and 17 due to other factors.
Demographics Similar to Immigrants from Uganda by Disability Age 5 to 17
In terms of disability age 5 to 17, the demographic groups most similar to Immigrants from Uganda are Immigrants from Haiti (5.8%, a difference of 0.030%), Kenyan (5.8%, a difference of 0.040%), Yugoslavian (5.8%, a difference of 0.080%), Moroccan (5.7%, a difference of 0.090%), and Trinidadian and Tobagonian (5.7%, a difference of 0.14%).
| Demographics | Rating | Rank | Disability Age 5 to 17 |
| Austrians | 13.2 /100 | #202 | Poor 5.7% |
| Spanish American Indians | 12.8 /100 | #203 | Poor 5.7% |
| Paiute | 11.2 /100 | #204 | Poor 5.7% |
| Trinidadians and Tobagonians | 10.8 /100 | #205 | Poor 5.7% |
| Immigrants from Africa | 10.8 /100 | #206 | Poor 5.7% |
| Moroccans | 10.4 /100 | #207 | Poor 5.7% |
| Kenyans | 10.0 /100 | #208 | Poor 5.8% |
| Immigrants from Uganda | 9.7 /100 | #209 | Tragic 5.8% |
| Immigrants from Haiti | 9.5 /100 | #210 | Tragic 5.8% |
| Yugoslavians | 9.1 /100 | #211 | Tragic 5.8% |
| Immigrants from Panama | 8.7 /100 | #212 | Tragic 5.8% |
| Immigrants from Cameroon | 8.3 /100 | #213 | Tragic 5.8% |
| Immigrants from Morocco | 8.3 /100 | #214 | Tragic 5.8% |
| Swedes | 8.1 /100 | #215 | Tragic 5.8% |
| Nigerians | 7.5 /100 | #216 | Tragic 5.8% |
Immigrants from Uganda Disability Age 5 to 17 Correlation Summary
| Measurement | Immigrants from Uganda Data | Disability Age 5 to 17 Data |
| Minimum | 0.016% | 1.1% |
| Maximum | 9.7% | 25.0% |
| Range | 9.7% | 23.9% |
| Mean | 1.6% | 6.8% |
| Median | 1.1% | 5.8% |
| Interquartile 25% (IQ1) | 0.56% | 3.9% |
| Interquartile 75% (IQ3) | 1.7% | 8.5% |
| Interquartile Range (IQR) | 1.2% | 4.5% |
| Standard Deviation (Sample) | 1.8% | 4.7% |
| Standard Deviation (Population) | 1.8% | 4.6% |
Correlation Details
| Immigrants from Uganda Percentile | Sample Size | Disability Age 5 to 17 |
[ 0.0% - 0.5% ] 0.016% | 94,902,896 | 5.6% |
[ 0.0% - 0.5% ] 0.068% | 15,580,753 | 5.7% |
[ 0.0% - 0.5% ] 0.12% | 6,120,170 | 5.5% |
[ 0.0% - 0.5% ] 0.17% | 2,249,899 | 5.8% |
[ 0.0% - 0.5% ] 0.22% | 2,329,957 | 5.5% |
[ 0.0% - 0.5% ] 0.26% | 1,186,352 | 4.5% |
[ 0.0% - 0.5% ] 0.32% | 806,879 | 5.5% |
[ 0.0% - 0.5% ] 0.36% | 471,143 | 6.0% |
[ 0.0% - 0.5% ] 0.42% | 294,459 | 7.3% |
[ 0.0% - 0.5% ] 0.46% | 476,399 | 5.6% |
[ 0.5% - 1.0% ] 0.51% | 42,231 | 4.4% |
[ 0.5% - 1.0% ] 0.56% | 225,461 | 7.7% |
[ 0.5% - 1.0% ] 0.62% | 215,506 | 4.2% |
[ 0.5% - 1.0% ] 0.66% | 213,795 | 8.5% |
[ 0.5% - 1.0% ] 0.70% | 90,190 | 3.8% |
[ 0.5% - 1.0% ] 0.76% | 39,682 | 8.1% |
[ 0.5% - 1.0% ] 0.81% | 79,087 | 5.9% |
[ 0.5% - 1.0% ] 0.87% | 12,470 | 9.2% |
[ 0.5% - 1.0% ] 0.89% | 49,663 | 9.3% |
[ 0.5% - 1.0% ] 0.95% | 15,682 | 2.3% |
[ 0.5% - 1.0% ] 0.99% | 5,887 | 7.8% |
[ 1.0% - 1.5% ] 1.05% | 4,097 | 8.8% |
[ 1.0% - 1.5% ] 1.09% | 40,736 | 7.3% |
[ 1.0% - 1.5% ] 1.12% | 32,761 | 11.3% |
[ 1.0% - 1.5% ] 1.18% | 42,785 | 2.4% |
[ 1.0% - 1.5% ] 1.26% | 13,516 | 14.1% |
[ 1.0% - 1.5% ] 1.27% | 14,553 | 5.8% |
[ 1.0% - 1.5% ] 1.35% | 64,711 | 3.2% |
[ 1.0% - 1.5% ] 1.39% | 5,018 | 9.3% |
[ 1.0% - 1.5% ] 1.45% | 346 | 3.6% |
[ 1.0% - 1.5% ] 1.48% | 12,355 | 7.5% |
[ 1.5% - 2.0% ] 1.55% | 23,081 | 3.9% |
[ 1.5% - 2.0% ] 1.60% | 5,682 | 1.1% |
[ 1.5% - 2.0% ] 1.68% | 238 | 25.0% |
[ 1.5% - 2.0% ] 1.73% | 9,415 | 6.1% |
[ 1.5% - 2.0% ] 1.79% | 2,969 | 8.8% |
[ 2.0% - 2.5% ] 2.07% | 1,210 | 23.3% |
[ 2.0% - 2.5% ] 2.45% | 3,884 | 10.9% |
[ 2.5% - 3.0% ] 2.62% | 5,462 | 2.9% |
[ 2.5% - 3.0% ] 2.81% | 604 | 1.1% |
[ 2.5% - 3.0% ] 2.86% | 315 | 4.0% |
[ 3.5% - 4.0% ] 3.62% | 15,830 | 2.3% |
[ 5.0% - 5.5% ] 5.00% | 180 | 8.0% |
[ 5.0% - 5.5% ] 5.46% | 26,684 | 9.2% |
[ 6.0% - 6.5% ] 6.29% | 1,303 | 2.3% |
[ 9.5% - 10.0% ] 9.74% | 842 | 2.6% |