Immigrants from Europe Disability Age 5 to 17

COMPARE

Immigrants from Europe
Race
Ancestry
AfghanAfricanAlaska NativeAlaskan AthabascanAlbanianAleutAlsatianAmericanApacheArabArapahoArgentineanArmenianAssyrian/Chaldean/SyriacAustralianAustrianBahamianBangladeshiBarbadianBasqueBelgianBelizeanBermudanBhutaneseBlackfeetBolivianBrazilianBritishBritish West IndianBulgarianBurmeseCajunCambodianCanadianCape VerdeanCarpatho RusynCelticCentral AmericanCentral American IndianCherokeeCheyenneChickasawChileanChineseChippewaChoctawColombianColvilleComancheCosta RicanCreeCreekCroatianCrowCubanCypriotCzechCzechoslovakianDanishDelawareDominicanDutchDutch West IndianEastern EuropeanEcuadorianEgyptianEnglishEstonianEthiopianEuropeanFijianFilipinoFinnishFrenchFrench American IndianFrench CanadianGermanGerman RussianGhanaianGreekGuamanian/ChamorroGuatemalanGuyaneseHaitianHmongHonduranHopiHoumaHungarianIcelanderIndian (Asian)IndonesianInupiatIranianIraqiIrishIroquoisIsraeliItalianJamaicanJapaneseJordanianKenyanKiowaKoreanLaotianLatvianLebaneseLiberianLithuanianLumbeeLuxembourgerMacedonianMalaysianMalteseMarshalleseMenomineeMexicanMexican American IndianMongolianMoroccanNative HawaiianNavajoNepaleseNew ZealanderNicaraguanNigerianNorthern EuropeanNorwegianOkinawanOsageOttawaPaiutePakistaniPalestinianPanamanianParaguayanPennsylvania GermanPeruvianPimaPolishPortuguesePotawatomiPuebloPuerto RicanPuget Sound SalishRomanianRussianSalvadoranSamoanScandinavianScotch-IrishScottishSeminoleSenegaleseSerbianShoshoneSierra LeoneanSiouxSlavicSlovakSloveneSomaliSouth AfricanSouth AmericanSouth American IndianSoviet UnionSpaniardSpanishSpanish AmericanSpanish American IndianSri LankanSubsaharan AfricanSudaneseSwedishSwissSyrianTaiwaneseThaiTlingit-HaidaTohono O'OdhamTonganTrinidadian and TobagonianTsimshianTurkishU.S. Virgin IslanderUgandanUkrainianUruguayanUteVenezuelanVietnameseWelshWest IndianYakamaYaquiYugoslavianYumanYup'ikZimbabwean
Immigration
NonimmigrantsImmigrantsAfghanistanAfricaAlbaniaArgentinaArmeniaAsiaAustraliaAustriaBahamasBangladeshBarbadosBelarusBelgiumBelizeBoliviaBosnia and HerzegovinaBrazilBulgariaBurma/MyanmarCabo VerdeCambodiaCameroonCanadaCaribbeanCentral AmericaChileChinaColombiaCongoCosta RicaCroatiaCubaCzechoslovakiaDenmarkDominicaDominican RepublicEastern AfricaEastern AsiaEastern EuropeEcuadorEgyptEl SalvadorEnglandEritreaEthiopiaEuropeFijiFranceGermanyGhanaGreeceGrenadaGuatemalaGuyanaHaitiHondurasHong KongHungaryIndiaIndonesiaIranIraqIrelandIsraelItalyJamaicaJapanJordanKazakhstanKenyaKoreaKuwaitLaosLatin AmericaLatviaLebanonLiberiaLithuaniaMalaysiaMexicoMicronesiaMiddle AfricaMoldovaMoroccoNepalNetherlandsNicaraguaNigeriaNorth AmericaNorth MacedoniaNorthern AfricaNorthern EuropeNorwayOceaniaPakistanPanamaPeruPhilippinesPolandPortugalRomaniaRussiaSaudi ArabiaScotlandSenegalSerbiaSierra LeoneSingaporeSomaliaSouth AfricaSouth AmericaSouth Central AsiaSouth Eastern AsiaSouthern EuropeSpainSri LankaSt. Vincent and the GrenadinesSudanSwedenSwitzerlandSyriaTaiwanThailandTrinidad and TobagoTurkeyUgandaUkraineUruguayUzbekistanVenezuelaVietnamWest IndiesWestern AfricaWestern AsiaWestern EuropeYemenZaireZimbabweAzores
Select to Compare
Race
Ancestry
AfghanAfricanAlaska NativeAlaskan AthabascanAlbanianAleutAlsatianAmericanApacheArabArapahoArgentineanArmenianAssyrian/Chaldean/SyriacAustralianAustrianBahamianBangladeshiBarbadianBasqueBelgianBelizeanBermudanBhutaneseBlackfeetBolivianBrazilianBritishBritish West IndianBulgarianBurmeseCajunCambodianCanadianCape VerdeanCarpatho RusynCelticCentral AmericanCentral American IndianCherokeeCheyenneChickasawChileanChineseChippewaChoctawColombianColvilleComancheCosta RicanCreeCreekCroatianCrowCubanCypriotCzechCzechoslovakianDanishDelawareDominicanDutchDutch West IndianEastern EuropeanEcuadorianEgyptianEnglishEstonianEthiopianEuropeanFijianFilipinoFinnishFrenchFrench American IndianFrench CanadianGermanGerman RussianGhanaianGreekGuamanian/ChamorroGuatemalanGuyaneseHaitianHmongHonduranHopiHoumaHungarianIcelanderIndian (Asian)IndonesianInupiatIranianIraqiIrishIroquoisIsraeliItalianJamaicanJapaneseJordanianKenyanKiowaKoreanLaotianLatvianLebaneseLiberianLithuanianLumbeeLuxembourgerMacedonianMalaysianMalteseMarshalleseMenomineeMexicanMexican American IndianMongolianMoroccanNative HawaiianNavajoNepaleseNew ZealanderNicaraguanNigerianNorthern EuropeanNorwegianOkinawanOsageOttawaPaiutePakistaniPalestinianPanamanianParaguayanPennsylvania GermanPeruvianPimaPolishPortuguesePotawatomiPuebloPuerto RicanPuget Sound SalishRomanianRussianSalvadoranSamoanScandinavianScotch-IrishScottishSeminoleSenegaleseSerbianShoshoneSierra LeoneanSiouxSlavicSlovakSloveneSomaliSouth AfricanSouth AmericanSouth American IndianSoviet UnionSpaniardSpanishSpanish AmericanSpanish American IndianSri LankanSubsaharan AfricanSudaneseSwedishSwissSyrianTaiwaneseThaiTlingit-HaidaTohono O'OdhamTonganTrinidadian and TobagonianTsimshianTurkishU.S. Virgin IslanderUgandanUkrainianUruguayanUteVenezuelanVietnameseWelshWest IndianYakamaYaquiYugoslavianYumanYup'ikZimbabwean
Immigration
NonimmigrantsImmigrantsAfghanistanAfricaAlbaniaArgentinaArmeniaAsiaAustraliaAustriaBahamasBangladeshBarbadosBelarusBelgiumBelizeBoliviaBosnia and HerzegovinaBrazilBulgariaBurma/MyanmarCabo VerdeCambodiaCameroonCanadaCaribbeanCentral AmericaChileChinaColombiaCongoCosta RicaCroatiaCubaCzechoslovakiaDenmarkDominicaDominican RepublicEastern AfricaEastern AsiaEastern EuropeEcuadorEgyptEl SalvadorEnglandEritreaEthiopiaFijiFranceGermanyGhanaGreeceGrenadaGuatemalaGuyanaHaitiHondurasHong KongHungaryIndiaIndonesiaIranIraqIrelandIsraelItalyJamaicaJapanJordanKazakhstanKenyaKoreaKuwaitLaosLatin AmericaLatviaLebanonLiberiaLithuaniaMalaysiaMexicoMicronesiaMiddle AfricaMoldovaMoroccoNepalNetherlandsNicaraguaNigeriaNorth AmericaNorth MacedoniaNorthern AfricaNorthern EuropeNorwayOceaniaPakistanPanamaPeruPhilippinesPolandPortugalRomaniaRussiaSaudi ArabiaScotlandSenegalSerbiaSierra LeoneSingaporeSomaliaSouth AfricaSouth AmericaSouth Central AsiaSouth Eastern AsiaSouthern EuropeSpainSri LankaSt. Vincent and the GrenadinesSudanSwedenSwitzerlandSyriaTaiwanThailandTrinidad and TobagoTurkeyUgandaUkraineUruguayUzbekistanVenezuelaVietnamWest IndiesWestern AfricaWestern AsiaWestern EuropeYemenZaireZimbabweAzores
Disability Age 5 to 17
Income
Poverty
Unemployment
Labor Participation
Family Structure
Vehicle Availability
Education Level
Disability

Immigrants from Europe Disability Age 5 to 17
Exceptional

5.3%
DISABILITY | AGE 5 TO 17
99.0/ 100
METRIC RATING
97th/ 347
METRIC RANK

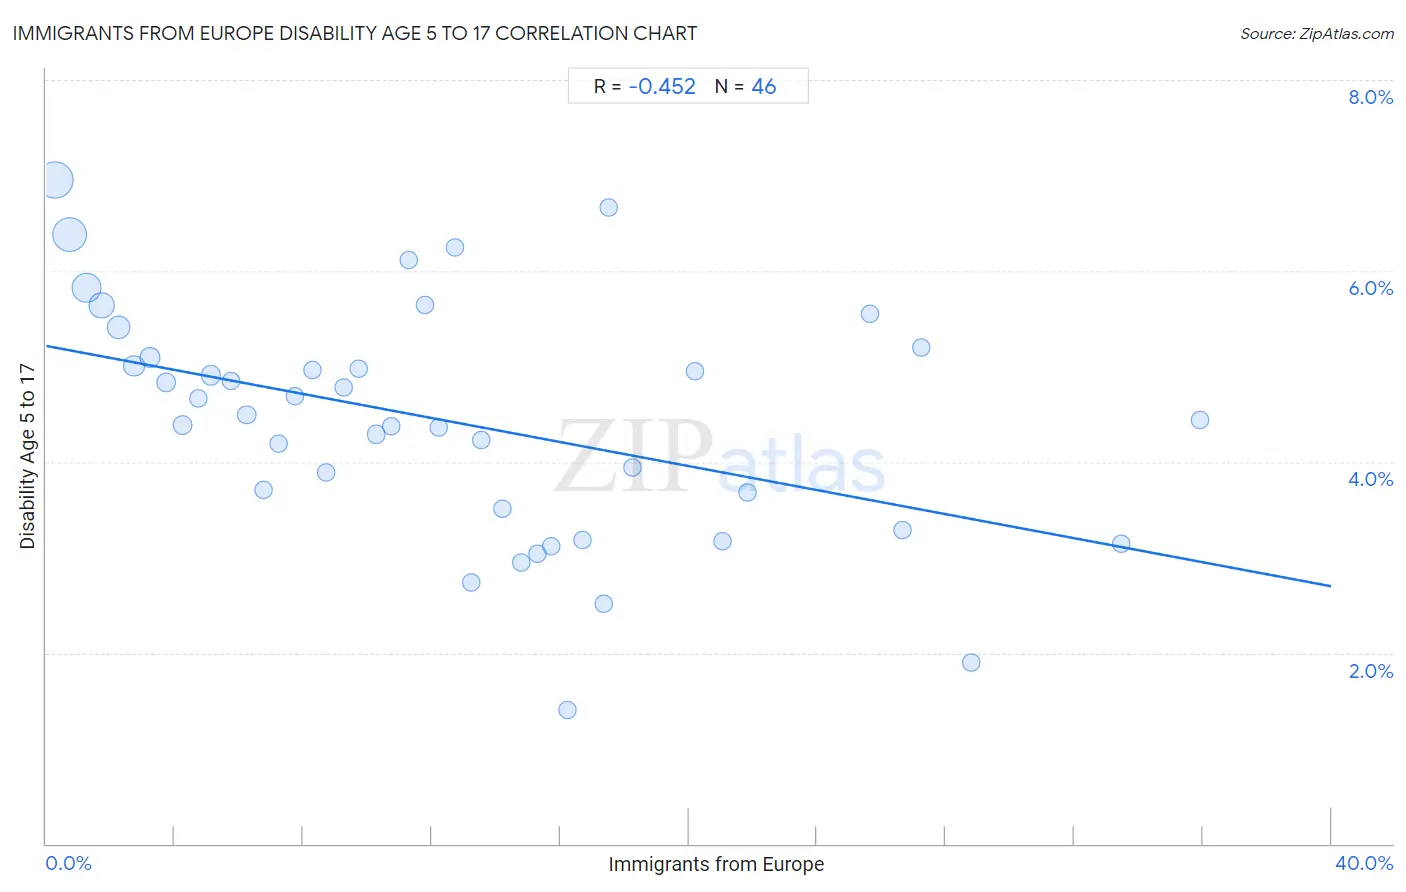
Immigrants from Europe Disability Age 5 to 17 Correlation Chart

The statistical analysis conducted on geographies consisting of 537,005,958 people shows a moderate negative correlation between the proportion of Immigrants from Europe and percentage of population with a disability between the ages 5 and 17 in the United States with a correlation coefficient (R) of -0.452 and weighted average of 5.3%. On average, for every 1% (one percent) increase in Immigrants from Europe within a typical geography, there is a decrease of 0.063% in percentage of population with a disability between the ages 5 and 17.
Immigrants from Europe Disability Age 5 to 17
It is essential to understand that the correlation between the percentage of Immigrants from Europe and percentage of population with a disability between the ages 5 and 17 does not imply a direct cause-and-effect relationship. It remains uncertain whether the presence of Immigrants from Europe influences an upward or downward trend in the level of percentage of population with a disability between the ages 5 and 17 within an area, or if Immigrants from Europe simply ended up residing in those areas with higher or lower levels of percentage of population with a disability between the ages 5 and 17 due to other factors.

Demographics Similar to Immigrants from Europe by Disability Age 5 to 17

In terms of disability age 5 to 17, the demographic groups most similar to Immigrants from Europe are Immigrants from El Salvador (5.3%, a difference of 0.0%), Immigrants from Austria (5.3%, a difference of 0.050%), Cambodian (5.3%, a difference of 0.15%), Immigrants from Grenada (5.3%, a difference of 0.16%), and Immigrants from Jordan (5.3%, a difference of 0.18%).
DemographicsRating | RankDisability Age 5 to 17
Immigrants from Kuwait
99.4
/100
|
#90
Exceptional
5.3%
Mongolians
99.2
/100
|
#91
Exceptional
5.3%
Luxembourgers
99.2
/100
|
#92
Exceptional
5.3%
Immigrants from Peru
99.1
/100
|
#93
Exceptional
5.3%
Immigrants from Jordan
99.1
/100
|
#94
Exceptional
5.3%
Immigrants from Grenada
99.1
/100
|
#95
Exceptional
5.3%
Immigrants from El Salvador
99.0
/100
|
#96
Exceptional
5.3%
Immigrants from Europe
99.0
/100
|
#97
Exceptional
5.3%
Immigrants from Austria
98.9
/100
|
#98
Exceptional
5.3%
Cambodians
98.8
/100
|
#99
Exceptional
5.3%
Nepalese
98.7
/100
|
#100
Exceptional
5.3%
Menominee
98.7
/100
|
#101
Exceptional
5.3%
Nicaraguans
98.6
/100
|
#102
Exceptional
5.3%
Salvadorans
98.6
/100
|
#103
Exceptional
5.3%
Peruvians
98.5
/100
|
#104
Exceptional
5.3%

Immigrants from Europe Disability Age 5 to 17 Correlation Summary

MeasurementImmigrants from Europe DataDisability Age 5 to 17 Data
Minimum0.26%1.4%
Maximum35.9%6.9%
Range35.6%5.5%
Mean12.7%4.4%
Median11.5%4.5%
Interquartile 25% (IQ1)5.7%3.5%
Interquartile 75% (IQ3)17.4%5.1%
Interquartile Range (IQR)11.6%1.6%
Standard Deviation (Sample)8.8%1.2%
Standard Deviation (Population)8.7%1.2%

Correlation Details

Immigrants from Europe PercentileSample SizeDisability Age 5 to 17
[
0.0%
-
0.5%
]
0.26%
140,999,0556.9%
[
0.5%
-
1.0%
]
0.72%
128,154,7486.4%
[
1.0%
-
1.5%
]
1.24%
80,202,6255.8%
[
1.5%
-
2.0%
]
1.72%
50,097,0095.6%
[
2.0%
-
2.5%
]
2.25%
39,561,1815.4%
[
2.5%
-
3.0%
]
2.74%
23,285,1125.0%
[
3.0%
-
3.5%
]
3.25%
18,468,5685.1%
[
3.5%
-
4.0%
]
3.72%
10,342,1164.8%
[
4.0%
-
4.5%
]
4.24%
8,168,4744.4%
[
4.5%
-
5.0%
]
4.73%
5,337,9564.7%
[
5.0%
-
5.5%
]
5.13%
14,143,5624.9%
[
5.5%
-
6.0%
]
5.74%
4,017,0474.8%
[
6.0%
-
6.5%
]
6.24%
2,626,7804.5%
[
6.5%
-
7.0%
]
6.76%
2,435,4913.7%
[
7.0%
-
7.5%
]
7.23%
1,444,0764.2%
[
7.5%
-
8.0%
]
7.75%
1,200,1294.7%
[
8.0%
-
8.5%
]
8.27%
865,0915.0%
[
8.5%
-
9.0%
]
8.72%
775,9903.9%
[
9.0%
-
9.5%
]
9.26%
768,5804.8%
[
9.5%
-
10.0%
]
9.74%
453,9125.0%
[
10.0%
-
10.5%
]
10.28%
616,2694.3%
[
10.5%
-
11.0%
]
10.74%
94,8394.4%
[
11.0%
-
11.5%
]
11.30%
288,1516.1%
[
11.5%
-
12.0%
]
11.77%
489,6085.6%
[
12.0%
-
12.5%
]
12.21%
395,1294.4%
[
12.5%
-
13.0%
]
12.73%
167,4506.2%
[
13.0%
-
13.5%
]
13.21%
286,9472.7%
[
13.5%
-
14.0%
]
13.55%
123,6964.2%
[
14.0%
-
14.5%
]
14.19%
214,6313.5%
[
14.5%
-
15.0%
]
14.80%
140,1503.0%
[
15.0%
-
15.5%
]
15.30%
236,9763.0%
[
15.5%
-
16.0%
]
15.71%
38,2613.1%
[
16.0%
-
16.5%
]
16.24%
52,0621.4%
[
16.5%
-
17.0%
]
16.69%
94,0703.2%
[
17.0%
-
17.5%
]
17.35%
81,1092.5%
[
17.5%
-
18.0%
]
17.51%
1,8856.7%
[
18.0%
-
18.5%
]
18.25%
36,5943.9%
[
20.0%
-
20.5%
]
20.18%
65,7744.9%
[
21.0%
-
21.5%
]
21.05%
29,6333.2%
[
21.5%
-
22.0%
]
21.82%
1,9663.7%
[
25.5%
-
26.0%
]
25.66%
1525.6%
[
26.5%
-
27.0%
]
26.66%
15,2913.3%
[
27.0%
-
27.5%
]
27.26%
72,1265.2%
[
28.5%
-
29.0%
]
28.80%
8,9421.9%
[
33.0%
-
33.5%
]
33.45%
23,6763.1%
[
35.5%
-
36.0%
]
35.90%
83,0694.4%