Chippewa Disability Age 5 to 17
COMPARE
Chippewa
Select to Compare
Disability Age 5 to 17
Chippewa Disability Age 5 to 17
7.1%
DISABILITY | AGE 5 TO 17
0.0/ 100
METRIC RATING
342nd/ 347
METRIC RANK
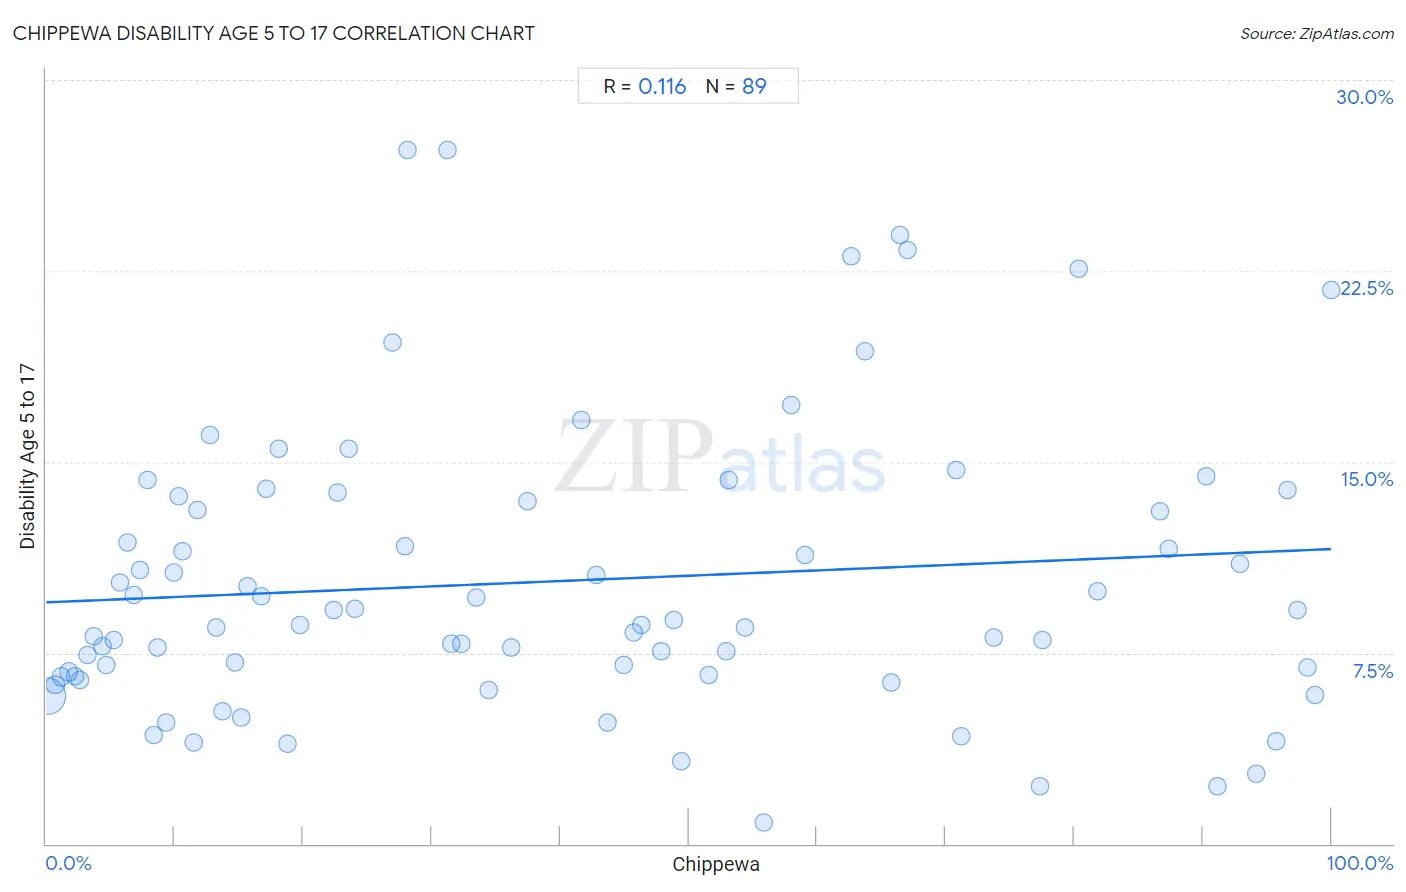
Chippewa Disability Age 5 to 17 Correlation Chart
The statistical analysis conducted on geographies consisting of 213,779,900 people shows a poor positive correlation between the proportion of Chippewa and percentage of population with a disability between the ages 5 and 17 in the United States with a correlation coefficient (R) of 0.116 and weighted average of 7.1%. On average, for every 1% (one percent) increase in Chippewa within a typical geography, there is an increase of 0.021% in percentage of population with a disability between the ages 5 and 17.
It is essential to understand that the correlation between the percentage of Chippewa and percentage of population with a disability between the ages 5 and 17 does not imply a direct cause-and-effect relationship. It remains uncertain whether the presence of Chippewa influences an upward or downward trend in the level of percentage of population with a disability between the ages 5 and 17 within an area, or if Chippewa simply ended up residing in those areas with higher or lower levels of percentage of population with a disability between the ages 5 and 17 due to other factors.
Demographics Similar to Chippewa by Disability Age 5 to 17
In terms of disability age 5 to 17, the demographic groups most similar to Chippewa are Immigrants from Cabo Verde (7.1%, a difference of 0.26%), Cajun (7.2%, a difference of 0.96%), Cape Verdean (7.0%, a difference of 2.2%), Cherokee (6.9%, a difference of 2.7%), and Choctaw (6.9%, a difference of 3.0%).
| Demographics | Rating | Rank | Disability Age 5 to 17 |
| Blacks/African Americans | 0.0 /100 | #333 | Tragic 6.8% |
| Seminole | 0.0 /100 | #334 | Tragic 6.8% |
| Ottawa | 0.0 /100 | #335 | Tragic 6.8% |
| Chickasaw | 0.0 /100 | #336 | Tragic 6.8% |
| Creek | 0.0 /100 | #337 | Tragic 6.9% |
| Iroquois | 0.0 /100 | #338 | Tragic 6.9% |
| Choctaw | 0.0 /100 | #339 | Tragic 6.9% |
| Cherokee | 0.0 /100 | #340 | Tragic 6.9% |
| Cape Verdeans | 0.0 /100 | #341 | Tragic 7.0% |
| Chippewa | 0.0 /100 | #342 | Tragic 7.1% |
| Immigrants from Cabo Verde | 0.0 /100 | #343 | Tragic 7.1% |
| Cajuns | 0.0 /100 | #344 | Tragic 7.2% |
| Tsimshian | 0.0 /100 | #345 | Tragic 7.9% |
| Puerto Ricans | 0.0 /100 | #346 | Tragic 8.3% |
| Houma | 0.0 /100 | #347 | Tragic 9.1% |
Chippewa Disability Age 5 to 17 Correlation Summary
| Measurement | Chippewa Data | Disability Age 5 to 17 Data |
| Minimum | 0.066% | 0.82% |
| Maximum | 100.0% | 27.3% |
| Range | 99.9% | 26.5% |
| Mean | 39.5% | 10.3% |
| Median | 32.3% | 8.6% |
| Interquartile 25% (IQ1) | 11.0% | 6.6% |
| Interquartile 75% (IQ3) | 64.8% | 13.5% |
| Interquartile Range (IQR) | 53.7% | 6.9% |
| Standard Deviation (Sample) | 31.3% | 5.7% |
| Standard Deviation (Population) | 31.1% | 5.6% |
Correlation Details
| Chippewa Percentile | Sample Size | Disability Age 5 to 17 |
[ 0.0% - 0.5% ] 0.066% | 203,922,112 | 5.8% |
[ 0.5% - 1.0% ] 0.70% | 6,075,562 | 6.2% |
[ 1.0% - 1.5% ] 1.16% | 1,837,631 | 6.6% |
[ 1.5% - 2.0% ] 1.72% | 509,675 | 6.8% |
[ 2.0% - 2.5% ] 2.21% | 406,383 | 6.6% |
[ 2.5% - 3.0% ] 2.65% | 336,719 | 6.4% |
[ 3.0% - 3.5% ] 3.25% | 118,685 | 7.4% |
[ 3.5% - 4.0% ] 3.72% | 92,754 | 8.1% |
[ 4.0% - 4.5% ] 4.35% | 78,955 | 7.7% |
[ 4.5% - 5.0% ] 4.67% | 37,446 | 7.0% |
[ 5.0% - 5.5% ] 5.21% | 20,082 | 8.0% |
[ 5.5% - 6.0% ] 5.73% | 15,091 | 10.3% |
[ 6.0% - 6.5% ] 6.30% | 4,320 | 11.8% |
[ 6.5% - 7.0% ] 6.79% | 9,726 | 9.8% |
[ 7.0% - 7.5% ] 7.34% | 13,932 | 10.7% |
[ 7.5% - 8.0% ] 7.85% | 19,202 | 14.3% |
[ 8.0% - 8.5% ] 8.39% | 5,235 | 4.3% |
[ 8.5% - 9.0% ] 8.67% | 3,562 | 7.7% |
[ 9.0% - 9.5% ] 9.37% | 36,741 | 4.8% |
[ 9.5% - 10.0% ] 9.88% | 243 | 10.6% |
[ 10.0% - 10.5% ] 10.27% | 13,928 | 13.6% |
[ 10.5% - 11.0% ] 10.64% | 36,269 | 11.5% |
[ 11.0% - 11.5% ] 11.44% | 18,018 | 4.0% |
[ 11.5% - 12.0% ] 11.73% | 2,369 | 13.1% |
[ 12.5% - 13.0% ] 12.70% | 7,320 | 16.1% |
[ 13.0% - 13.5% ] 13.19% | 7,188 | 8.5% |
[ 13.5% - 14.0% ] 13.68% | 2,448 | 5.2% |
[ 14.5% - 15.0% ] 14.65% | 16,808 | 7.1% |
[ 15.0% - 15.5% ] 15.13% | 1,976 | 5.0% |
[ 15.5% - 16.0% ] 15.63% | 20,633 | 10.1% |
[ 16.5% - 17.0% ] 16.76% | 16,587 | 9.7% |
[ 17.0% - 17.5% ] 17.13% | 2,020 | 14.0% |
[ 18.0% - 18.5% ] 18.08% | 4,309 | 15.5% |
[ 18.5% - 19.0% ] 18.73% | 3,358 | 3.9% |
[ 19.5% - 20.0% ] 19.72% | 3,798 | 8.6% |
[ 22.0% - 22.5% ] 22.36% | 416 | 9.2% |
[ 22.5% - 23.0% ] 22.69% | 1,062 | 13.8% |
[ 23.5% - 24.0% ] 23.56% | 3,290 | 15.5% |
[ 24.0% - 24.5% ] 24.03% | 795 | 9.2% |
[ 26.5% - 27.0% ] 26.93% | 3,628 | 19.7% |
[ 27.5% - 28.0% ] 27.90% | 3,549 | 11.7% |
[ 28.0% - 28.5% ] 28.12% | 2,233 | 27.3% |
[ 31.0% - 31.5% ] 31.25% | 112 | 27.3% |
[ 31.5% - 32.0% ] 31.50% | 873 | 7.8% |
[ 32.0% - 32.5% ] 32.26% | 248 | 7.8% |
[ 33.0% - 33.5% ] 33.48% | 221 | 9.7% |
[ 34.0% - 34.5% ] 34.48% | 406 | 6.0% |
[ 36.0% - 36.5% ] 36.21% | 116 | 7.7% |
[ 37.0% - 37.5% ] 37.44% | 6,234 | 13.4% |
[ 41.5% - 42.0% ] 41.67% | 96 | 16.7% |
[ 42.5% - 43.0% ] 42.81% | 1,731 | 10.6% |
[ 43.5% - 44.0% ] 43.65% | 575 | 4.8% |
[ 44.5% - 45.0% ] 44.98% | 3,079 | 7.0% |
[ 45.5% - 46.0% ] 45.68% | 1,819 | 8.3% |
[ 46.0% - 46.5% ] 46.27% | 858 | 8.6% |
[ 47.5% - 48.0% ] 47.82% | 1,838 | 7.6% |
[ 48.5% - 49.0% ] 48.84% | 6,540 | 8.8% |
[ 49.0% - 49.5% ] 49.39% | 494 | 3.2% |
[ 51.5% - 52.0% ] 51.53% | 1,011 | 6.6% |
[ 52.5% - 53.0% ] 52.88% | 2,969 | 7.6% |
[ 53.0% - 53.5% ] 53.12% | 32 | 14.3% |
[ 54.0% - 54.5% ] 54.37% | 607 | 8.5% |
[ 55.5% - 56.0% ] 55.80% | 776 | 0.82% |
[ 57.5% - 58.0% ] 57.97% | 395 | 17.2% |
[ 59.0% - 59.5% ] 59.07% | 237 | 11.3% |
[ 62.5% - 63.0% ] 62.67% | 1,733 | 23.1% |
[ 63.5% - 64.0% ] 63.75% | 1,854 | 19.3% |
[ 65.5% - 66.0% ] 65.79% | 839 | 6.3% |
[ 66.0% - 66.5% ] 66.47% | 683 | 23.9% |
[ 66.5% - 67.0% ] 66.98% | 733 | 23.3% |
[ 70.5% - 71.0% ] 70.82% | 2,940 | 14.7% |
[ 71.0% - 71.5% ] 71.23% | 146 | 4.2% |
[ 73.5% - 74.0% ] 73.74% | 613 | 8.1% |
[ 77.0% - 77.5% ] 77.29% | 1,026 | 2.2% |
[ 77.5% - 78.0% ] 77.56% | 2,117 | 8.0% |
[ 80.0% - 80.5% ] 80.36% | 550 | 22.6% |
[ 81.5% - 82.0% ] 81.78% | 472 | 9.9% |
[ 86.5% - 87.0% ] 86.67% | 285 | 13.0% |
[ 87.0% - 87.5% ] 87.40% | 2,071 | 11.6% |
[ 90.0% - 90.5% ] 90.28% | 895 | 14.4% |
[ 91.0% - 91.5% ] 91.13% | 203 | 2.3% |
[ 92.5% - 93.0% ] 92.90% | 7,355 | 11.0% |
[ 94.0% - 94.5% ] 94.16% | 2,960 | 2.8% |
[ 95.5% - 96.0% ] 95.75% | 1,011 | 4.0% |
[ 96.5% - 97.0% ] 96.58% | 789 | 13.9% |
[ 97.0% - 97.5% ] 97.42% | 852 | 9.2% |
[ 98.0% - 98.5% ] 98.17% | 1,202 | 6.9% |
[ 98.5% - 99.0% ] 98.73% | 1,183 | 5.8% |
[ 99.5% - 100.0% ] 100.00% | 63 | 21.7% |