Cambodian Disability Age 5 to 17
COMPARE
Cambodian
Select to Compare
Disability Age 5 to 17
Cambodian Disability Age 5 to 17
5.3%
DISABILITY | AGE 5 TO 17
98.8/ 100
METRIC RATING
99th/ 347
METRIC RANK
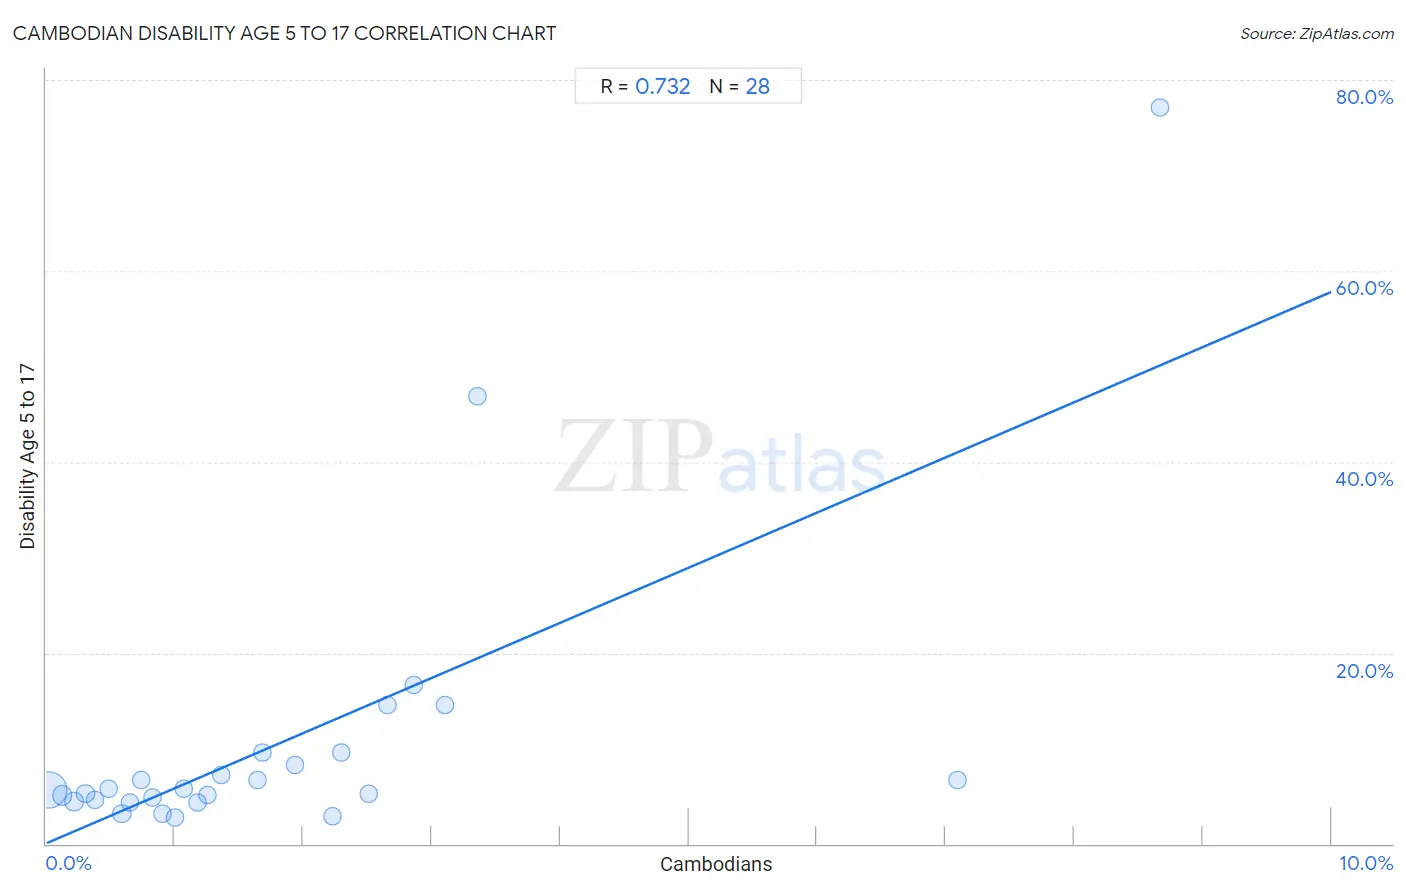
Cambodian Disability Age 5 to 17 Correlation Chart
The statistical analysis conducted on geographies consisting of 102,235,652 people shows a strong positive correlation between the proportion of Cambodians and percentage of population with a disability between the ages 5 and 17 in the United States with a correlation coefficient (R) of 0.732 and weighted average of 5.3%. On average, for every 1% (one percent) increase in Cambodians within a typical geography, there is an increase of 5.8% in percentage of population with a disability between the ages 5 and 17.
It is essential to understand that the correlation between the percentage of Cambodians and percentage of population with a disability between the ages 5 and 17 does not imply a direct cause-and-effect relationship. It remains uncertain whether the presence of Cambodians influences an upward or downward trend in the level of percentage of population with a disability between the ages 5 and 17 within an area, or if Cambodians simply ended up residing in those areas with higher or lower levels of percentage of population with a disability between the ages 5 and 17 due to other factors.
Demographics Similar to Cambodians by Disability Age 5 to 17
In terms of disability age 5 to 17, the demographic groups most similar to Cambodians are Immigrants from Austria (5.3%, a difference of 0.090%), Immigrants from El Salvador (5.3%, a difference of 0.15%), Immigrants from Europe (5.3%, a difference of 0.15%), Nepalese (5.3%, a difference of 0.16%), and Menominee (5.3%, a difference of 0.18%).
| Demographics | Rating | Rank | Disability Age 5 to 17 |
| Luxembourgers | 99.2 /100 | #92 | Exceptional 5.3% |
| Immigrants from Peru | 99.1 /100 | #93 | Exceptional 5.3% |
| Immigrants from Jordan | 99.1 /100 | #94 | Exceptional 5.3% |
| Immigrants from Grenada | 99.1 /100 | #95 | Exceptional 5.3% |
| Immigrants from El Salvador | 99.0 /100 | #96 | Exceptional 5.3% |
| Immigrants from Europe | 99.0 /100 | #97 | Exceptional 5.3% |
| Immigrants from Austria | 98.9 /100 | #98 | Exceptional 5.3% |
| Cambodians | 98.8 /100 | #99 | Exceptional 5.3% |
| Nepalese | 98.7 /100 | #100 | Exceptional 5.3% |
| Menominee | 98.7 /100 | #101 | Exceptional 5.3% |
| Nicaraguans | 98.6 /100 | #102 | Exceptional 5.3% |
| Salvadorans | 98.6 /100 | #103 | Exceptional 5.3% |
| Peruvians | 98.5 /100 | #104 | Exceptional 5.3% |
| Immigrants from Italy | 98.4 /100 | #105 | Exceptional 5.3% |
| Immigrants from Yemen | 98.2 /100 | #106 | Exceptional 5.3% |
Cambodian Disability Age 5 to 17 Correlation Summary
| Measurement | Cambodian Data | Disability Age 5 to 17 Data |
| Minimum | 0.024% | 2.7% |
| Maximum | 8.7% | 77.1% |
| Range | 8.6% | 74.4% |
| Mean | 1.8% | 10.6% |
| Median | 1.2% | 5.7% |
| Interquartile 25% (IQ1) | 0.62% | 4.5% |
| Interquartile 75% (IQ3) | 2.4% | 8.9% |
| Interquartile Range (IQR) | 1.8% | 4.4% |
| Standard Deviation (Sample) | 2.0% | 15.5% |
| Standard Deviation (Population) | 1.9% | 15.2% |
Correlation Details
| Cambodian Percentile | Sample Size | Disability Age 5 to 17 |
[ 0.0% - 0.5% ] 0.024% | 87,180,069 | 5.6% |
[ 0.0% - 0.5% ] 0.12% | 8,249,262 | 5.1% |
[ 0.0% - 0.5% ] 0.22% | 2,434,070 | 4.4% |
[ 0.0% - 0.5% ] 0.31% | 1,462,535 | 5.2% |
[ 0.0% - 0.5% ] 0.38% | 707,065 | 4.5% |
[ 0.0% - 0.5% ] 0.48% | 384,895 | 5.7% |
[ 0.5% - 1.0% ] 0.59% | 397,482 | 3.2% |
[ 0.5% - 1.0% ] 0.65% | 402,525 | 4.4% |
[ 0.5% - 1.0% ] 0.74% | 348,632 | 6.7% |
[ 0.5% - 1.0% ] 0.83% | 183,273 | 4.8% |
[ 0.5% - 1.0% ] 0.90% | 93,233 | 3.2% |
[ 1.0% - 1.5% ] 1.01% | 136,359 | 2.7% |
[ 1.0% - 1.5% ] 1.07% | 53,882 | 5.7% |
[ 1.0% - 1.5% ] 1.18% | 23,929 | 4.3% |
[ 1.0% - 1.5% ] 1.26% | 42,624 | 5.1% |
[ 1.0% - 1.5% ] 1.36% | 8,899 | 7.3% |
[ 1.5% - 2.0% ] 1.64% | 6,771 | 6.6% |
[ 1.5% - 2.0% ] 1.68% | 475 | 9.6% |
[ 1.5% - 2.0% ] 1.93% | 1,708 | 8.2% |
[ 2.0% - 2.5% ] 2.23% | 38,400 | 2.9% |
[ 2.0% - 2.5% ] 2.30% | 25,374 | 9.6% |
[ 2.5% - 3.0% ] 2.51% | 41,058 | 5.3% |
[ 2.5% - 3.0% ] 2.65% | 2,716 | 14.5% |
[ 2.5% - 3.0% ] 2.86% | 3,571 | 16.7% |
[ 3.0% - 3.5% ] 3.10% | 2,933 | 14.5% |
[ 3.0% - 3.5% ] 3.35% | 1,670 | 46.9% |
[ 7.0% - 7.5% ] 7.09% | 1,411 | 6.6% |
[ 8.5% - 9.0% ] 8.66% | 831 | 77.1% |