Immigrants from Nigeria Disability Age 5 to 17

COMPARE

Immigrants from Nigeria
Race
Ancestry
AfghanAfricanAlaska NativeAlaskan AthabascanAlbanianAleutAlsatianAmericanApacheArabArapahoArgentineanArmenianAssyrian/Chaldean/SyriacAustralianAustrianBahamianBangladeshiBarbadianBasqueBelgianBelizeanBermudanBhutaneseBlackfeetBolivianBrazilianBritishBritish West IndianBulgarianBurmeseCajunCambodianCanadianCape VerdeanCarpatho RusynCelticCentral AmericanCentral American IndianCherokeeCheyenneChickasawChileanChineseChippewaChoctawColombianColvilleComancheCosta RicanCreeCreekCroatianCrowCubanCypriotCzechCzechoslovakianDanishDelawareDominicanDutchDutch West IndianEastern EuropeanEcuadorianEgyptianEnglishEstonianEthiopianEuropeanFijianFilipinoFinnishFrenchFrench American IndianFrench CanadianGermanGerman RussianGhanaianGreekGuamanian/ChamorroGuatemalanGuyaneseHaitianHmongHonduranHopiHoumaHungarianIcelanderIndian (Asian)IndonesianInupiatIranianIraqiIrishIroquoisIsraeliItalianJamaicanJapaneseJordanianKenyanKiowaKoreanLaotianLatvianLebaneseLiberianLithuanianLumbeeLuxembourgerMacedonianMalaysianMalteseMarshalleseMenomineeMexicanMexican American IndianMongolianMoroccanNative HawaiianNavajoNepaleseNew ZealanderNicaraguanNigerianNorthern EuropeanNorwegianOkinawanOsageOttawaPaiutePakistaniPalestinianPanamanianParaguayanPennsylvania GermanPeruvianPimaPolishPortuguesePotawatomiPuebloPuerto RicanPuget Sound SalishRomanianRussianSalvadoranSamoanScandinavianScotch-IrishScottishSeminoleSenegaleseSerbianShoshoneSierra LeoneanSiouxSlavicSlovakSloveneSomaliSouth AfricanSouth AmericanSouth American IndianSoviet UnionSpaniardSpanishSpanish AmericanSpanish American IndianSri LankanSubsaharan AfricanSudaneseSwedishSwissSyrianTaiwaneseThaiTlingit-HaidaTohono O'OdhamTonganTrinidadian and TobagonianTsimshianTurkishU.S. Virgin IslanderUgandanUkrainianUruguayanUteVenezuelanVietnameseWelshWest IndianYakamaYaquiYugoslavianYumanYup'ikZimbabwean
Immigration
NonimmigrantsImmigrantsAfghanistanAfricaAlbaniaArgentinaArmeniaAsiaAustraliaAustriaBahamasBangladeshBarbadosBelarusBelgiumBelizeBoliviaBosnia and HerzegovinaBrazilBulgariaBurma/MyanmarCabo VerdeCambodiaCameroonCanadaCaribbeanCentral AmericaChileChinaColombiaCongoCosta RicaCroatiaCubaCzechoslovakiaDenmarkDominicaDominican RepublicEastern AfricaEastern AsiaEastern EuropeEcuadorEgyptEl SalvadorEnglandEritreaEthiopiaEuropeFijiFranceGermanyGhanaGreeceGrenadaGuatemalaGuyanaHaitiHondurasHong KongHungaryIndiaIndonesiaIranIraqIrelandIsraelItalyJamaicaJapanJordanKazakhstanKenyaKoreaKuwaitLaosLatin AmericaLatviaLebanonLiberiaLithuaniaMalaysiaMexicoMicronesiaMiddle AfricaMoldovaMoroccoNepalNetherlandsNicaraguaNigeriaNorth AmericaNorth MacedoniaNorthern AfricaNorthern EuropeNorwayOceaniaPakistanPanamaPeruPhilippinesPolandPortugalRomaniaRussiaSaudi ArabiaScotlandSenegalSerbiaSierra LeoneSingaporeSomaliaSouth AfricaSouth AmericaSouth Central AsiaSouth Eastern AsiaSouthern EuropeSpainSri LankaSt. Vincent and the GrenadinesSudanSwedenSwitzerlandSyriaTaiwanThailandTrinidad and TobagoTurkeyUgandaUkraineUruguayUzbekistanVenezuelaVietnamWest IndiesWestern AfricaWestern AsiaWestern EuropeYemenZaireZimbabweAzores
Select to Compare
Race
Ancestry
AfghanAfricanAlaska NativeAlaskan AthabascanAlbanianAleutAlsatianAmericanApacheArabArapahoArgentineanArmenianAssyrian/Chaldean/SyriacAustralianAustrianBahamianBangladeshiBarbadianBasqueBelgianBelizeanBermudanBhutaneseBlackfeetBolivianBrazilianBritishBritish West IndianBulgarianBurmeseCajunCambodianCanadianCape VerdeanCarpatho RusynCelticCentral AmericanCentral American IndianCherokeeCheyenneChickasawChileanChineseChippewaChoctawColombianColvilleComancheCosta RicanCreeCreekCroatianCrowCubanCypriotCzechCzechoslovakianDanishDelawareDominicanDutchDutch West IndianEastern EuropeanEcuadorianEgyptianEnglishEstonianEthiopianEuropeanFijianFilipinoFinnishFrenchFrench American IndianFrench CanadianGermanGerman RussianGhanaianGreekGuamanian/ChamorroGuatemalanGuyaneseHaitianHmongHonduranHopiHoumaHungarianIcelanderIndian (Asian)IndonesianInupiatIranianIraqiIrishIroquoisIsraeliItalianJamaicanJapaneseJordanianKenyanKiowaKoreanLaotianLatvianLebaneseLiberianLithuanianLumbeeLuxembourgerMacedonianMalaysianMalteseMarshalleseMenomineeMexicanMexican American IndianMongolianMoroccanNative HawaiianNavajoNepaleseNew ZealanderNicaraguanNigerianNorthern EuropeanNorwegianOkinawanOsageOttawaPaiutePakistaniPalestinianPanamanianParaguayanPennsylvania GermanPeruvianPimaPolishPortuguesePotawatomiPuebloPuerto RicanPuget Sound SalishRomanianRussianSalvadoranSamoanScandinavianScotch-IrishScottishSeminoleSenegaleseSerbianShoshoneSierra LeoneanSiouxSlavicSlovakSloveneSomaliSouth AfricanSouth AmericanSouth American IndianSoviet UnionSpaniardSpanishSpanish AmericanSpanish American IndianSri LankanSubsaharan AfricanSudaneseSwedishSwissSyrianTaiwaneseThaiTlingit-HaidaTohono O'OdhamTonganTrinidadian and TobagonianTsimshianTurkishU.S. Virgin IslanderUgandanUkrainianUruguayanUteVenezuelanVietnameseWelshWest IndianYakamaYaquiYugoslavianYumanYup'ikZimbabwean
Immigration
NonimmigrantsImmigrantsAfghanistanAfricaAlbaniaArgentinaArmeniaAsiaAustraliaAustriaBahamasBangladeshBarbadosBelarusBelgiumBelizeBoliviaBosnia and HerzegovinaBrazilBulgariaBurma/MyanmarCabo VerdeCambodiaCameroonCanadaCaribbeanCentral AmericaChileChinaColombiaCongoCosta RicaCroatiaCubaCzechoslovakiaDenmarkDominicaDominican RepublicEastern AfricaEastern AsiaEastern EuropeEcuadorEgyptEl SalvadorEnglandEritreaEthiopiaEuropeFijiFranceGermanyGhanaGreeceGrenadaGuatemalaGuyanaHaitiHondurasHong KongHungaryIndiaIndonesiaIranIraqIrelandIsraelItalyJamaicaJapanJordanKazakhstanKenyaKoreaKuwaitLaosLatin AmericaLatviaLebanonLiberiaLithuaniaMalaysiaMexicoMicronesiaMiddle AfricaMoldovaMoroccoNepalNetherlandsNicaraguaNorth AmericaNorth MacedoniaNorthern AfricaNorthern EuropeNorwayOceaniaPakistanPanamaPeruPhilippinesPolandPortugalRomaniaRussiaSaudi ArabiaScotlandSenegalSerbiaSierra LeoneSingaporeSomaliaSouth AfricaSouth AmericaSouth Central AsiaSouth Eastern AsiaSouthern EuropeSpainSri LankaSt. Vincent and the GrenadinesSudanSwedenSwitzerlandSyriaTaiwanThailandTrinidad and TobagoTurkeyUgandaUkraineUruguayUzbekistanVenezuelaVietnamWest IndiesWestern AfricaWestern AsiaWestern EuropeYemenZaireZimbabweAzores
Disability Age 5 to 17
Income
Poverty
Unemployment
Labor Participation
Family Structure
Vehicle Availability
Education Level
Disability

Immigrants from Nigeria Disability Age 5 to 17
Fair

5.7%
DISABILITY | AGE 5 TO 17
23.4/ 100
METRIC RATING
195th/ 347
METRIC RANK

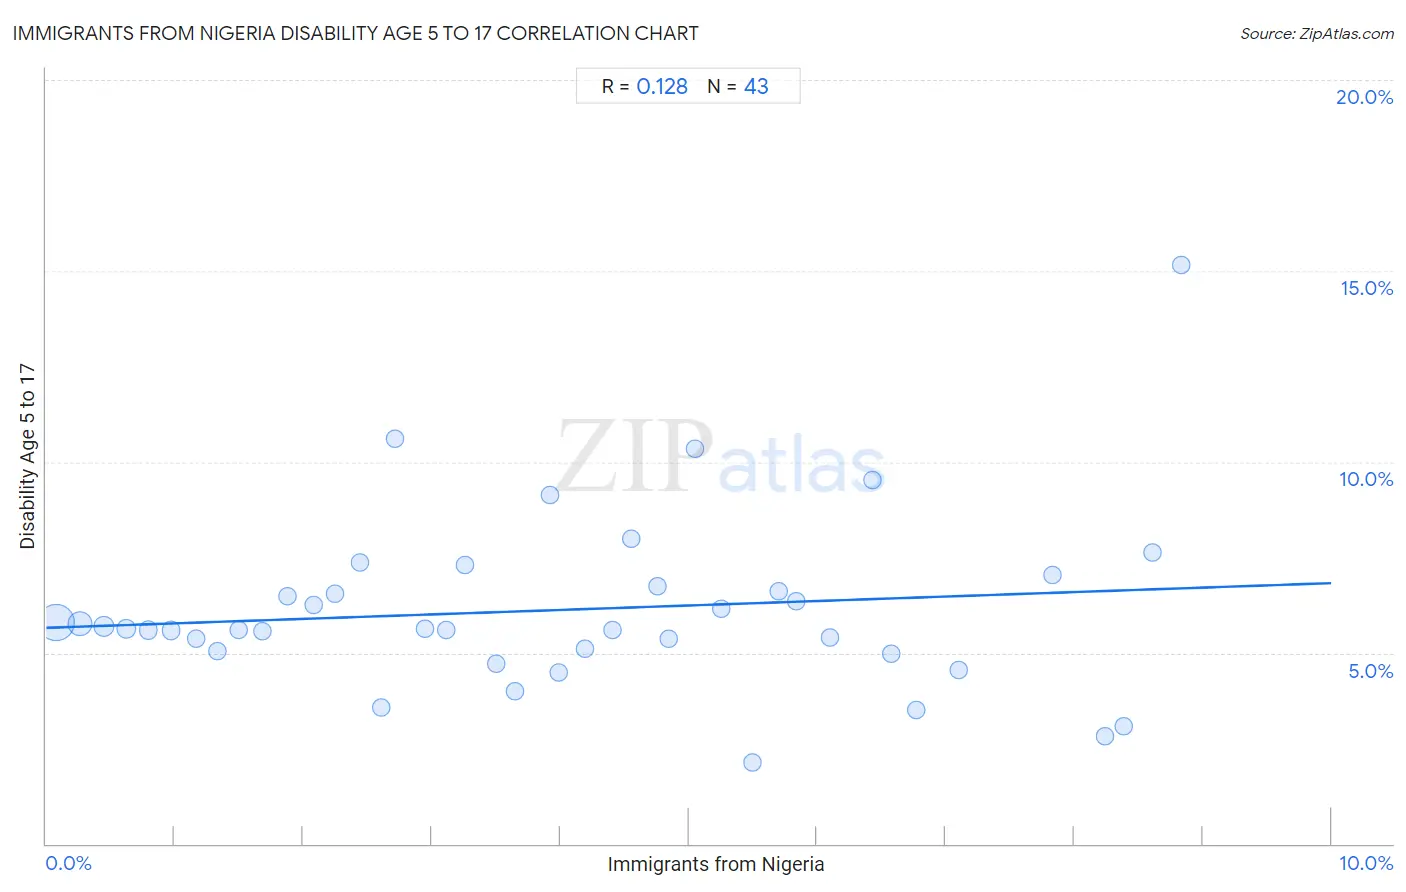
Immigrants from Nigeria Disability Age 5 to 17 Correlation Chart

The statistical analysis conducted on geographies consisting of 282,146,479 people shows a poor positive correlation between the proportion of Immigrants from Nigeria and percentage of population with a disability between the ages 5 and 17 in the United States with a correlation coefficient (R) of 0.128 and weighted average of 5.7%. On average, for every 1% (one percent) increase in Immigrants from Nigeria within a typical geography, there is an increase of 0.12% in percentage of population with a disability between the ages 5 and 17.
Immigrants from Nigeria Disability Age 5 to 17
It is essential to understand that the correlation between the percentage of Immigrants from Nigeria and percentage of population with a disability between the ages 5 and 17 does not imply a direct cause-and-effect relationship. It remains uncertain whether the presence of Immigrants from Nigeria influences an upward or downward trend in the level of percentage of population with a disability between the ages 5 and 17 within an area, or if Immigrants from Nigeria simply ended up residing in those areas with higher or lower levels of percentage of population with a disability between the ages 5 and 17 due to other factors.

Demographics Similar to Immigrants from Nigeria by Disability Age 5 to 17

In terms of disability age 5 to 17, the demographic groups most similar to Immigrants from Nigeria are Croatian (5.7%, a difference of 0.010%), Inupiat (5.7%, a difference of 0.010%), Immigrants from North America (5.7%, a difference of 0.020%), Immigrants from Canada (5.7%, a difference of 0.17%), and Norwegian (5.7%, a difference of 0.18%).
DemographicsRating | RankDisability Age 5 to 17
Marshallese
28.1
/100
|
#188
Fair
5.7%
Pueblo
27.5
/100
|
#189
Fair
5.7%
Immigrants from Eastern Africa
27.3
/100
|
#190
Fair
5.7%
Danes
26.5
/100
|
#191
Fair
5.7%
Immigrants from Bosnia and Herzegovina
26.3
/100
|
#192
Fair
5.7%
Immigrants from Canada
26.1
/100
|
#193
Fair
5.7%
Croatians
23.6
/100
|
#194
Fair
5.7%
Immigrants from Nigeria
23.4
/100
|
#195
Fair
5.7%
Inupiat
23.3
/100
|
#196
Fair
5.7%
Immigrants from North America
23.1
/100
|
#197
Fair
5.7%
Norwegians
20.9
/100
|
#198
Fair
5.7%
Northern Europeans
15.2
/100
|
#199
Poor
5.7%
Icelanders
14.6
/100
|
#200
Poor
5.7%
Basques
13.7
/100
|
#201
Poor
5.7%
Austrians
13.2
/100
|
#202
Poor
5.7%

Immigrants from Nigeria Disability Age 5 to 17 Correlation Summary

MeasurementImmigrants from Nigeria DataDisability Age 5 to 17 Data
Minimum0.073%2.1%
Maximum8.8%15.2%
Range8.8%13.1%
Mean4.0%6.1%
Median3.9%5.6%
Interquartile 25% (IQ1)1.9%5.0%
Interquartile 75% (IQ3)5.8%6.8%
Interquartile Range (IQR)4.0%1.7%
Standard Deviation (Sample)2.5%2.3%
Standard Deviation (Population)2.5%2.3%

Correlation Details

Immigrants from Nigeria PercentileSample SizeDisability Age 5 to 17
[
0.0%
-
0.5%
]
0.073%
172,056,5725.8%
[
0.0%
-
0.5%
]
0.26%
57,615,5335.8%
[
0.0%
-
0.5%
]
0.45%
20,611,6635.7%
[
0.5%
-
1.0%
]
0.62%
10,415,0825.6%
[
0.5%
-
1.0%
]
0.80%
8,580,9065.6%
[
0.5%
-
1.0%
]
0.97%
3,061,9075.6%
[
1.0%
-
1.5%
]
1.17%
1,699,8735.4%
[
1.0%
-
1.5%
]
1.33%
1,510,5755.0%
[
1.0%
-
1.5%
]
1.50%
1,118,4745.6%
[
1.5%
-
2.0%
]
1.68%
971,7095.6%
[
1.5%
-
2.0%
]
1.87%
442,9136.5%
[
2.0%
-
2.5%
]
2.08%
911,1686.2%
[
2.0%
-
2.5%
]
2.25%
375,5406.5%
[
2.0%
-
2.5%
]
2.44%
368,6147.4%
[
2.5%
-
3.0%
]
2.61%
203,4273.6%
[
2.5%
-
3.0%
]
2.71%
9,48010.6%
[
2.5%
-
3.0%
]
2.94%
217,8825.6%
[
3.0%
-
3.5%
]
3.12%
237,9265.6%
[
3.0%
-
3.5%
]
3.26%
184,6327.3%
[
3.0%
-
3.5%
]
3.50%
151,0604.7%
[
3.5%
-
4.0%
]
3.65%
285,6284.0%
[
3.5%
-
4.0%
]
3.92%
20,6889.1%
[
3.5%
-
4.0%
]
3.99%
180,7434.5%
[
4.0%
-
4.5%
]
4.19%
113,2035.1%
[
4.0%
-
4.5%
]
4.41%
53,6415.6%
[
4.5%
-
5.0%
]
4.55%
79,5308.0%
[
4.5%
-
5.0%
]
4.76%
102,0916.8%
[
4.5%
-
5.0%
]
4.84%
2,8495.4%
[
5.0%
-
5.5%
]
5.05%
26,99010.3%
[
5.0%
-
5.5%
]
5.25%
79,5066.2%
[
5.0%
-
5.5%
]
5.49%
19,6192.1%
[
5.5%
-
6.0%
]
5.70%
10,2906.6%
[
5.5%
-
6.0%
]
5.83%
62,9756.4%
[
6.0%
-
6.5%
]
6.10%
30,3355.4%
[
6.0%
-
6.5%
]
6.43%
11,7579.5%
[
6.5%
-
7.0%
]
6.58%
106,5175.0%
[
6.5%
-
7.0%
]
6.77%
32,1913.5%
[
7.0%
-
7.5%
]
7.10%
3104.5%
[
7.5%
-
8.0%
]
7.83%
49,5417.0%
[
8.0%
-
8.5%
]
8.23%
76,6002.8%
[
8.0%
-
8.5%
]
8.38%
39,7043.1%
[
8.5%
-
9.0%
]
8.61%
11,5047.6%
[
8.5%
-
9.0%
]
8.84%
5,33115.2%