Norwegian Disability Age 5 to 17
COMPARE
Norwegian
Select to Compare
Disability Age 5 to 17
Norwegian Disability Age 5 to 17
5.7%
DISABILITY | AGE 5 TO 17
20.9/ 100
METRIC RATING
198th/ 347
METRIC RANK
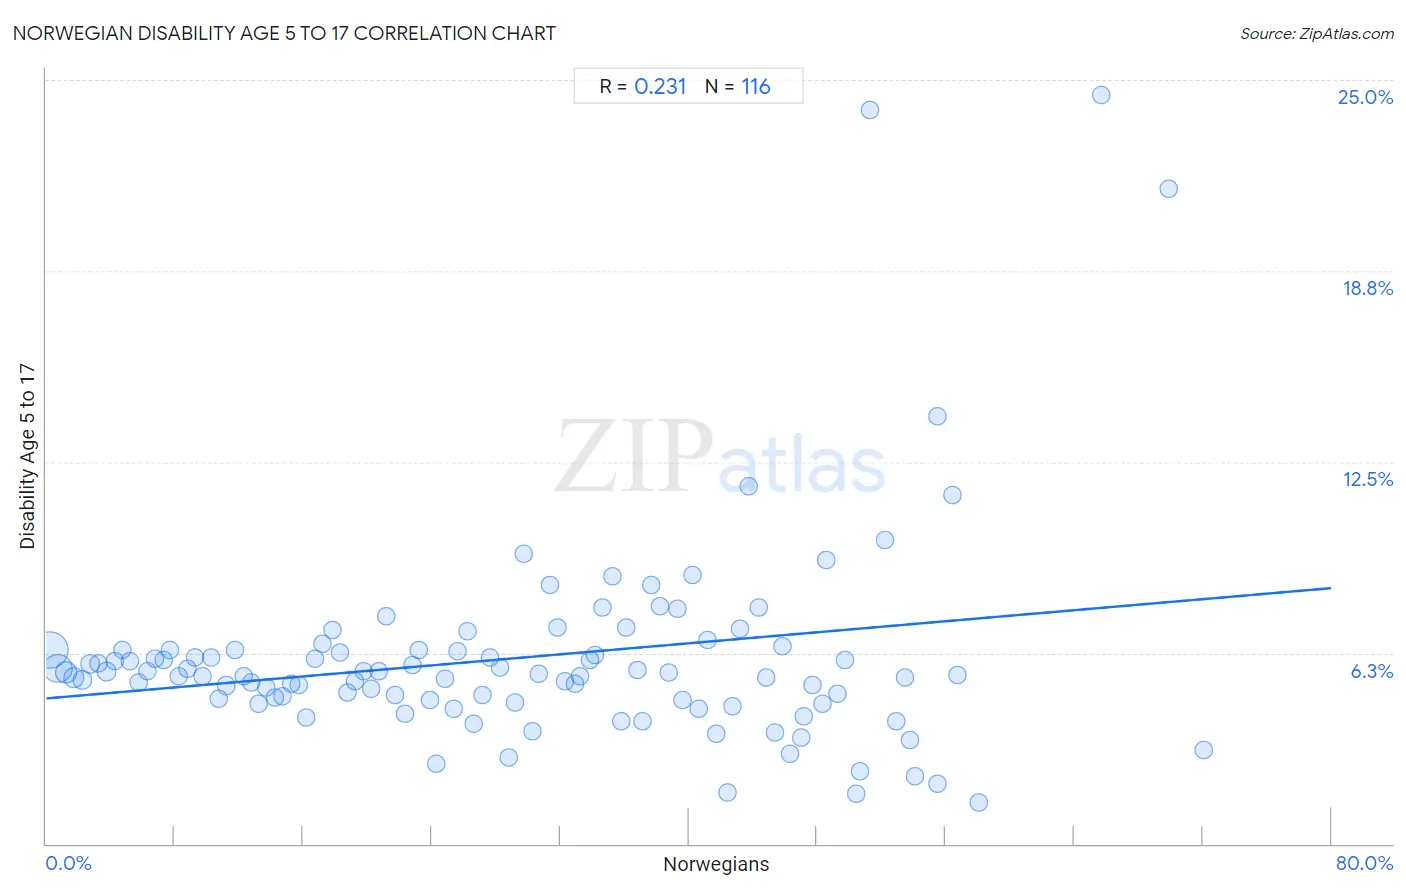
Norwegian Disability Age 5 to 17 Correlation Chart
The statistical analysis conducted on geographies consisting of 523,039,839 people shows a weak positive correlation between the proportion of Norwegians and percentage of population with a disability between the ages 5 and 17 in the United States with a correlation coefficient (R) of 0.231 and weighted average of 5.7%. On average, for every 1% (one percent) increase in Norwegians within a typical geography, there is an increase of 0.045% in percentage of population with a disability between the ages 5 and 17.
It is essential to understand that the correlation between the percentage of Norwegians and percentage of population with a disability between the ages 5 and 17 does not imply a direct cause-and-effect relationship. It remains uncertain whether the presence of Norwegians influences an upward or downward trend in the level of percentage of population with a disability between the ages 5 and 17 within an area, or if Norwegians simply ended up residing in those areas with higher or lower levels of percentage of population with a disability between the ages 5 and 17 due to other factors.
Demographics Similar to Norwegians by Disability Age 5 to 17
In terms of disability age 5 to 17, the demographic groups most similar to Norwegians are Immigrants from North America (5.7%, a difference of 0.16%), Inupiat (5.7%, a difference of 0.17%), Immigrants from Nigeria (5.7%, a difference of 0.18%), Croatian (5.7%, a difference of 0.19%), and Immigrants from Canada (5.7%, a difference of 0.35%).
| Demographics | Rating | Rank | Disability Age 5 to 17 |
| Danes | 26.5 /100 | #191 | Fair 5.7% |
| Immigrants from Bosnia and Herzegovina | 26.3 /100 | #192 | Fair 5.7% |
| Immigrants from Canada | 26.1 /100 | #193 | Fair 5.7% |
| Croatians | 23.6 /100 | #194 | Fair 5.7% |
| Immigrants from Nigeria | 23.4 /100 | #195 | Fair 5.7% |
| Inupiat | 23.3 /100 | #196 | Fair 5.7% |
| Immigrants from North America | 23.1 /100 | #197 | Fair 5.7% |
| Norwegians | 20.9 /100 | #198 | Fair 5.7% |
| Northern Europeans | 15.2 /100 | #199 | Poor 5.7% |
| Icelanders | 14.6 /100 | #200 | Poor 5.7% |
| Basques | 13.7 /100 | #201 | Poor 5.7% |
| Austrians | 13.2 /100 | #202 | Poor 5.7% |
| Spanish American Indians | 12.8 /100 | #203 | Poor 5.7% |
| Paiute | 11.2 /100 | #204 | Poor 5.7% |
| Trinidadians and Tobagonians | 10.8 /100 | #205 | Poor 5.7% |
Norwegian Disability Age 5 to 17 Correlation Summary
| Measurement | Norwegian Data | Disability Age 5 to 17 Data |
| Minimum | 0.25% | 1.4% |
| Maximum | 72.0% | 24.5% |
| Range | 71.8% | 23.2% |
| Mean | 29.4% | 6.1% |
| Median | 29.0% | 5.5% |
| Interquartile 25% (IQ1) | 14.5% | 4.7% |
| Interquartile 75% (IQ3) | 43.5% | 6.3% |
| Interquartile Range (IQR) | 29.0% | 1.6% |
| Standard Deviation (Sample) | 17.6% | 3.4% |
| Standard Deviation (Population) | 17.5% | 3.4% |
Correlation Details
| Norwegian Percentile | Sample Size | Disability Age 5 to 17 |
[ 0.0% - 0.5% ] 0.25% | 234,696,859 | 6.4% |
[ 0.5% - 1.0% ] 0.71% | 132,646,968 | 5.7% |
[ 1.0% - 1.5% ] 1.22% | 49,855,789 | 5.6% |
[ 1.5% - 2.0% ] 1.73% | 28,163,358 | 5.4% |
[ 2.0% - 2.5% ] 2.24% | 17,790,434 | 5.4% |
[ 2.5% - 3.0% ] 2.74% | 11,284,088 | 5.9% |
[ 3.0% - 3.5% ] 3.25% | 8,365,654 | 5.9% |
[ 3.5% - 4.0% ] 3.77% | 7,114,738 | 5.6% |
[ 4.0% - 4.5% ] 4.24% | 4,916,285 | 6.0% |
[ 4.5% - 5.0% ] 4.73% | 3,499,060 | 6.3% |
[ 5.0% - 5.5% ] 5.24% | 2,158,993 | 6.0% |
[ 5.5% - 6.0% ] 5.77% | 2,108,437 | 5.3% |
[ 6.0% - 6.5% ] 6.29% | 1,785,741 | 5.6% |
[ 6.5% - 7.0% ] 6.80% | 1,695,705 | 6.1% |
[ 7.0% - 7.5% ] 7.28% | 1,028,270 | 6.0% |
[ 7.5% - 8.0% ] 7.72% | 1,070,496 | 6.4% |
[ 8.0% - 8.5% ] 8.24% | 633,749 | 5.5% |
[ 8.5% - 9.0% ] 8.80% | 628,863 | 5.7% |
[ 9.0% - 9.5% ] 9.25% | 939,653 | 6.1% |
[ 9.5% - 10.0% ] 9.75% | 909,470 | 5.5% |
[ 10.0% - 10.5% ] 10.27% | 611,288 | 6.1% |
[ 10.5% - 11.0% ] 10.76% | 964,979 | 4.8% |
[ 11.0% - 11.5% ] 11.23% | 961,718 | 5.2% |
[ 11.5% - 12.0% ] 11.75% | 999,693 | 6.3% |
[ 12.0% - 12.5% ] 12.27% | 1,063,420 | 5.5% |
[ 12.5% - 13.0% ] 12.74% | 609,851 | 5.3% |
[ 13.0% - 13.5% ] 13.22% | 824,092 | 4.6% |
[ 13.5% - 14.0% ] 13.71% | 570,119 | 5.1% |
[ 14.0% - 14.5% ] 14.27% | 533,827 | 4.8% |
[ 14.5% - 15.0% ] 14.74% | 495,772 | 4.8% |
[ 15.0% - 15.5% ] 15.24% | 417,389 | 5.3% |
[ 15.5% - 16.0% ] 15.75% | 414,580 | 5.2% |
[ 16.0% - 16.5% ] 16.22% | 223,960 | 4.1% |
[ 16.5% - 17.0% ] 16.72% | 346,861 | 6.1% |
[ 17.0% - 17.5% ] 17.18% | 193,861 | 6.5% |
[ 17.5% - 18.0% ] 17.79% | 157,054 | 7.0% |
[ 18.0% - 18.5% ] 18.26% | 152,329 | 6.3% |
[ 18.5% - 19.0% ] 18.75% | 104,033 | 5.0% |
[ 19.0% - 19.5% ] 19.22% | 83,086 | 5.3% |
[ 19.5% - 20.0% ] 19.75% | 69,883 | 5.7% |
[ 20.0% - 20.5% ] 20.24% | 170,931 | 5.1% |
[ 20.5% - 21.0% ] 20.72% | 53,843 | 5.6% |
[ 21.0% - 21.5% ] 21.21% | 89,988 | 7.4% |
[ 21.5% - 22.0% ] 21.74% | 72,796 | 4.9% |
[ 22.0% - 22.5% ] 22.35% | 73,302 | 4.3% |
[ 22.5% - 23.0% ] 22.82% | 78,003 | 5.8% |
[ 23.0% - 23.5% ] 23.19% | 34,954 | 6.3% |
[ 23.5% - 24.0% ] 23.85% | 81,858 | 4.7% |
[ 24.0% - 24.5% ] 24.31% | 20,386 | 2.6% |
[ 24.5% - 25.0% ] 24.84% | 50,598 | 5.4% |
[ 25.0% - 25.5% ] 25.37% | 44,605 | 4.4% |
[ 25.5% - 26.0% ] 25.62% | 202,699 | 6.3% |
[ 26.0% - 26.5% ] 26.21% | 132,877 | 6.9% |
[ 26.5% - 27.0% ] 26.61% | 44,102 | 3.9% |
[ 27.0% - 27.5% ] 27.20% | 152,822 | 4.9% |
[ 27.5% - 28.0% ] 27.62% | 59,385 | 6.1% |
[ 28.0% - 28.5% ] 28.23% | 22,165 | 5.8% |
[ 28.5% - 29.0% ] 28.80% | 98,790 | 2.8% |
[ 29.0% - 29.5% ] 29.22% | 43,655 | 4.6% |
[ 29.5% - 30.0% ] 29.71% | 28,134 | 9.5% |
[ 30.0% - 30.5% ] 30.30% | 28,745 | 3.7% |
[ 30.5% - 31.0% ] 30.69% | 13,920 | 5.6% |
[ 31.0% - 31.5% ] 31.35% | 16,644 | 8.5% |
[ 31.5% - 32.0% ] 31.83% | 11,759 | 7.1% |
[ 32.0% - 32.5% ] 32.26% | 11,865 | 5.3% |
[ 32.5% - 33.0% ] 32.89% | 30,770 | 5.2% |
[ 33.0% - 33.5% ] 33.26% | 30,261 | 5.5% |
[ 33.5% - 34.0% ] 33.82% | 7,478 | 6.0% |
[ 34.0% - 34.5% ] 34.19% | 22,036 | 6.2% |
[ 34.5% - 35.0% ] 34.67% | 11,763 | 7.7% |
[ 35.0% - 35.5% ] 35.27% | 19,243 | 8.8% |
[ 35.5% - 36.0% ] 35.82% | 13,394 | 4.0% |
[ 36.0% - 36.5% ] 36.11% | 33,989 | 7.1% |
[ 36.5% - 37.0% ] 36.78% | 12,424 | 5.7% |
[ 37.0% - 37.5% ] 37.11% | 4,983 | 4.0% |
[ 37.5% - 38.0% ] 37.69% | 9,217 | 8.5% |
[ 38.0% - 38.5% ] 38.24% | 7,936 | 7.8% |
[ 38.5% - 39.0% ] 38.73% | 9,496 | 5.6% |
[ 39.0% - 39.5% ] 39.27% | 5,967 | 7.7% |
[ 39.5% - 40.0% ] 39.60% | 4,119 | 4.7% |
[ 40.0% - 40.5% ] 40.21% | 3,788 | 8.8% |
[ 40.5% - 41.0% ] 40.63% | 8,633 | 4.4% |
[ 41.0% - 41.5% ] 41.16% | 4,827 | 6.7% |
[ 41.5% - 42.0% ] 41.68% | 4,568 | 3.6% |
[ 42.0% - 42.5% ] 42.40% | 7,926 | 1.7% |
[ 42.5% - 43.0% ] 42.75% | 8,218 | 4.5% |
[ 43.0% - 43.5% ] 43.19% | 1,947 | 7.0% |
[ 43.5% - 44.0% ] 43.74% | 2,021 | 11.7% |
[ 44.0% - 44.5% ] 44.34% | 1,635 | 7.7% |
[ 44.5% - 45.0% ] 44.84% | 4,839 | 5.5% |
[ 45.0% - 45.5% ] 45.36% | 2,101 | 3.6% |
[ 45.5% - 46.0% ] 45.85% | 5,557 | 6.5% |
[ 46.0% - 46.5% ] 46.30% | 1,473 | 2.9% |
[ 46.5% - 47.0% ] 46.97% | 775 | 3.5% |
[ 47.0% - 47.5% ] 47.12% | 2,886 | 4.2% |
[ 47.5% - 48.0% ] 47.68% | 2,651 | 5.2% |
[ 48.0% - 48.5% ] 48.32% | 3,059 | 4.6% |
[ 48.5% - 49.0% ] 48.59% | 1,706 | 9.3% |
[ 49.0% - 49.5% ] 49.28% | 1,532 | 4.9% |
[ 49.5% - 50.0% ] 49.69% | 1,131 | 6.0% |
[ 50.0% - 50.5% ] 50.46% | 971 | 1.6% |
[ 50.5% - 51.0% ] 50.67% | 3,353 | 2.4% |
[ 51.0% - 51.5% ] 51.30% | 269 | 24.0% |
[ 52.0% - 52.5% ] 52.20% | 1,615 | 9.9% |
[ 52.5% - 53.0% ] 52.88% | 191 | 4.0% |
[ 53.0% - 53.5% ] 53.48% | 660 | 5.4% |
[ 53.5% - 54.0% ] 53.74% | 2,514 | 3.4% |
[ 54.0% - 54.5% ] 54.12% | 2,086 | 2.2% |
[ 55.0% - 55.5% ] 55.47% | 2,104 | 2.0% |
[ 55.5% - 56.0% ] 55.51% | 272 | 14.0% |
[ 56.0% - 56.5% ] 56.44% | 404 | 11.4% |
[ 56.5% - 57.0% ] 56.75% | 719 | 5.5% |
[ 58.0% - 58.5% ] 58.06% | 434 | 1.4% |
[ 65.5% - 66.0% ] 65.70% | 242 | 24.5% |
[ 69.5% - 70.0% ] 69.86% | 146 | 21.4% |
[ 72.0% - 72.5% ] 72.04% | 279 | 3.1% |