Immigrants from India Disability Age 5 to 17
COMPARE
Immigrants from India
Select to Compare
Disability Age 5 to 17
Immigrants from India Disability Age 5 to 17
4.6%
DISABILITY | AGE 5 TO 17
100.0/ 100
METRIC RATING
10th/ 347
METRIC RANK
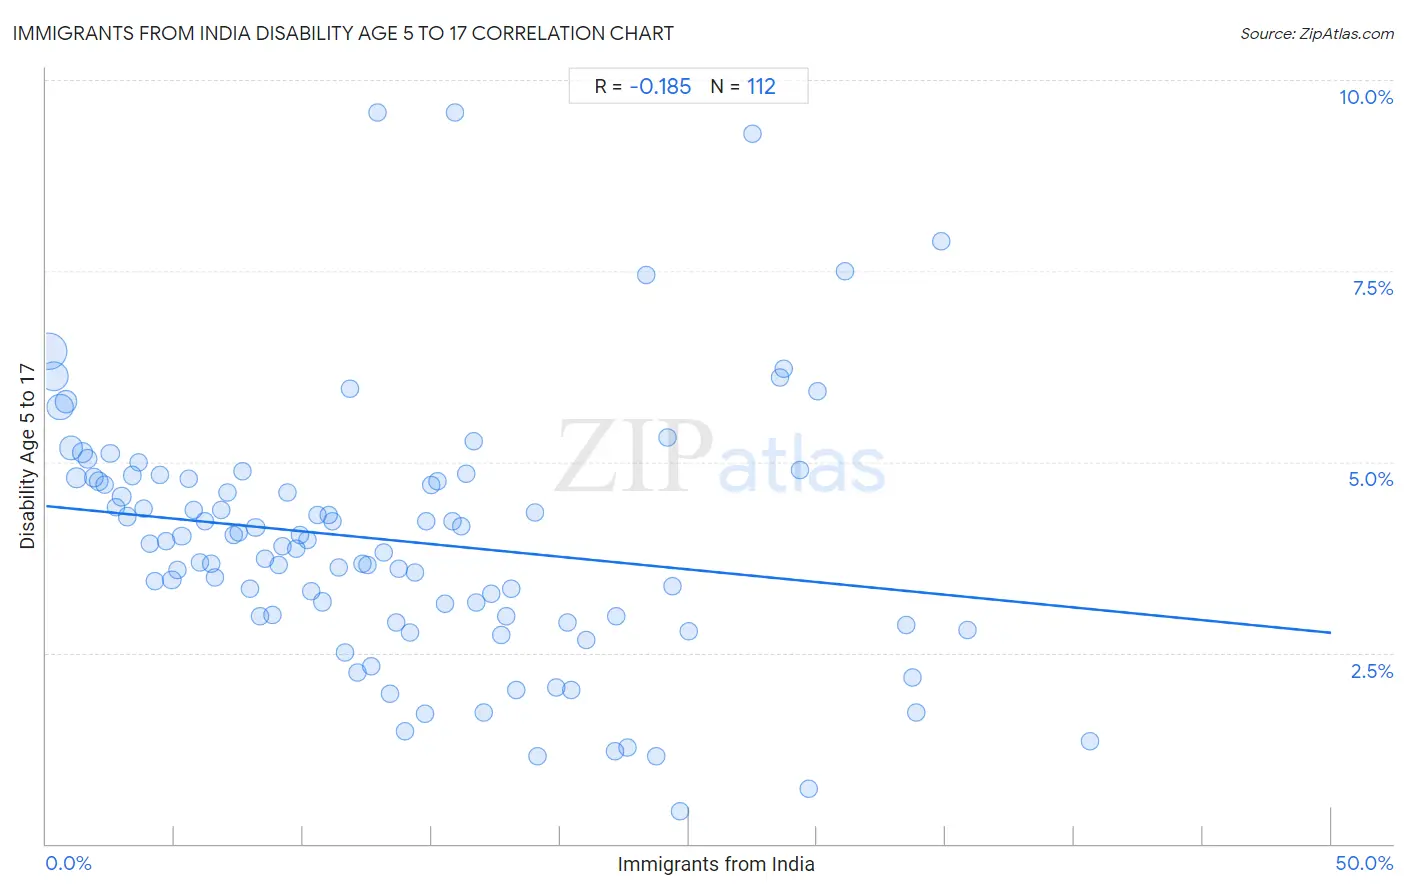
Immigrants from India Disability Age 5 to 17 Correlation Chart
The statistical analysis conducted on geographies consisting of 430,066,965 people shows a poor negative correlation between the proportion of Immigrants from India and percentage of population with a disability between the ages 5 and 17 in the United States with a correlation coefficient (R) of -0.185 and weighted average of 4.6%. On average, for every 1% (one percent) increase in Immigrants from India within a typical geography, there is a decrease of 0.033% in percentage of population with a disability between the ages 5 and 17.
It is essential to understand that the correlation between the percentage of Immigrants from India and percentage of population with a disability between the ages 5 and 17 does not imply a direct cause-and-effect relationship. It remains uncertain whether the presence of Immigrants from India influences an upward or downward trend in the level of percentage of population with a disability between the ages 5 and 17 within an area, or if Immigrants from India simply ended up residing in those areas with higher or lower levels of percentage of population with a disability between the ages 5 and 17 due to other factors.
Demographics Similar to Immigrants from India by Disability Age 5 to 17
In terms of disability age 5 to 17, the demographic groups most similar to Immigrants from India are Immigrants from Eastern Asia (4.6%, a difference of 0.070%), Armenian (4.6%, a difference of 0.16%), Indian (Asian) (4.6%, a difference of 0.40%), Iranian (4.6%, a difference of 0.40%), and Immigrants from China (4.5%, a difference of 1.3%).
| Demographics | Rating | Rank | Disability Age 5 to 17 |
| Immigrants from Hong Kong | 100.0 /100 | #3 | Exceptional 4.3% |
| Filipinos | 100.0 /100 | #4 | Exceptional 4.3% |
| Immigrants from Iran | 100.0 /100 | #5 | Exceptional 4.4% |
| Immigrants from Israel | 100.0 /100 | #6 | Exceptional 4.5% |
| Immigrants from China | 100.0 /100 | #7 | Exceptional 4.5% |
| Indians (Asian) | 100.0 /100 | #8 | Exceptional 4.6% |
| Immigrants from Eastern Asia | 100.0 /100 | #9 | Exceptional 4.6% |
| Immigrants from India | 100.0 /100 | #10 | Exceptional 4.6% |
| Armenians | 100.0 /100 | #11 | Exceptional 4.6% |
| Iranians | 100.0 /100 | #12 | Exceptional 4.6% |
| Thais | 100.0 /100 | #13 | Exceptional 4.7% |
| Immigrants from Korea | 100.0 /100 | #14 | Exceptional 4.7% |
| Chinese | 100.0 /100 | #15 | Exceptional 4.7% |
| Immigrants from Singapore | 100.0 /100 | #16 | Exceptional 4.7% |
| Arapaho | 100.0 /100 | #17 | Exceptional 4.7% |
Immigrants from India Disability Age 5 to 17 Correlation Summary
| Measurement | Immigrants from India Data | Disability Age 5 to 17 Data |
| Minimum | 0.10% | 0.42% |
| Maximum | 40.6% | 9.6% |
| Range | 40.5% | 9.1% |
| Mean | 13.5% | 4.0% |
| Median | 12.2% | 3.9% |
| Interquartile 25% (IQ1) | 6.1% | 3.0% |
| Interquartile 75% (IQ3) | 18.7% | 4.8% |
| Interquartile Range (IQR) | 12.6% | 1.8% |
| Standard Deviation (Sample) | 9.4% | 1.7% |
| Standard Deviation (Population) | 9.3% | 1.7% |
Correlation Details
| Immigrants from India Percentile | Sample Size | Disability Age 5 to 17 |
[ 0.0% - 0.5% ] 0.10% | 127,158,322 | 6.5% |
[ 0.0% - 0.5% ] 0.32% | 75,920,045 | 6.1% |
[ 0.5% - 1.0% ] 0.54% | 57,382,845 | 5.7% |
[ 0.5% - 1.0% ] 0.75% | 28,595,420 | 5.8% |
[ 0.5% - 1.0% ] 0.96% | 36,780,541 | 5.2% |
[ 1.0% - 1.5% ] 1.18% | 13,558,601 | 4.8% |
[ 1.0% - 1.5% ] 1.42% | 16,225,929 | 5.1% |
[ 1.5% - 2.0% ] 1.62% | 8,129,964 | 5.0% |
[ 1.5% - 2.0% ] 1.84% | 7,128,773 | 4.8% |
[ 2.0% - 2.5% ] 2.04% | 8,530,495 | 4.7% |
[ 2.0% - 2.5% ] 2.26% | 5,029,537 | 4.7% |
[ 2.0% - 2.5% ] 2.49% | 4,531,384 | 5.1% |
[ 2.5% - 3.0% ] 2.72% | 3,914,487 | 4.4% |
[ 2.5% - 3.0% ] 2.93% | 3,183,651 | 4.5% |
[ 3.0% - 3.5% ] 3.16% | 3,393,589 | 4.3% |
[ 3.0% - 3.5% ] 3.36% | 1,966,523 | 4.8% |
[ 3.5% - 4.0% ] 3.58% | 1,662,617 | 5.0% |
[ 3.5% - 4.0% ] 3.78% | 2,331,329 | 4.4% |
[ 4.0% - 4.5% ] 4.01% | 1,245,520 | 3.9% |
[ 4.0% - 4.5% ] 4.21% | 1,600,589 | 3.4% |
[ 4.0% - 4.5% ] 4.43% | 1,015,622 | 4.8% |
[ 4.5% - 5.0% ] 4.67% | 1,197,846 | 4.0% |
[ 4.5% - 5.0% ] 4.89% | 1,078,800 | 3.5% |
[ 5.0% - 5.5% ] 5.12% | 863,412 | 3.6% |
[ 5.0% - 5.5% ] 5.27% | 1,542,952 | 4.0% |
[ 5.5% - 6.0% ] 5.54% | 489,939 | 4.8% |
[ 5.5% - 6.0% ] 5.76% | 496,370 | 4.4% |
[ 5.5% - 6.0% ] 5.96% | 1,020,223 | 3.7% |
[ 6.0% - 6.5% ] 6.17% | 729,902 | 4.2% |
[ 6.0% - 6.5% ] 6.40% | 665,678 | 3.7% |
[ 6.5% - 7.0% ] 6.57% | 547,342 | 3.5% |
[ 6.5% - 7.0% ] 6.82% | 442,580 | 4.4% |
[ 7.0% - 7.5% ] 7.06% | 452,535 | 4.6% |
[ 7.0% - 7.5% ] 7.28% | 396,295 | 4.0% |
[ 7.5% - 8.0% ] 7.50% | 522,217 | 4.1% |
[ 7.5% - 8.0% ] 7.65% | 219,728 | 4.9% |
[ 7.5% - 8.0% ] 7.91% | 599,222 | 3.3% |
[ 8.0% - 8.5% ] 8.15% | 342,273 | 4.1% |
[ 8.0% - 8.5% ] 8.31% | 266,690 | 3.0% |
[ 8.5% - 9.0% ] 8.53% | 314,542 | 3.7% |
[ 8.5% - 9.0% ] 8.82% | 296,915 | 3.0% |
[ 9.0% - 9.5% ] 9.05% | 410,865 | 3.7% |
[ 9.0% - 9.5% ] 9.22% | 256,772 | 3.9% |
[ 9.0% - 9.5% ] 9.39% | 511,369 | 4.6% |
[ 9.5% - 10.0% ] 9.71% | 426,063 | 3.9% |
[ 9.5% - 10.0% ] 9.85% | 309,709 | 4.0% |
[ 10.0% - 10.5% ] 10.15% | 437,971 | 4.0% |
[ 10.0% - 10.5% ] 10.29% | 279,635 | 3.3% |
[ 10.5% - 11.0% ] 10.54% | 325,038 | 4.3% |
[ 10.5% - 11.0% ] 10.76% | 619,988 | 3.2% |
[ 10.5% - 11.0% ] 11.00% | 82,132 | 4.3% |
[ 11.0% - 11.5% ] 11.13% | 104,054 | 4.2% |
[ 11.0% - 11.5% ] 11.40% | 339,283 | 3.6% |
[ 11.5% - 12.0% ] 11.60% | 190,969 | 2.5% |
[ 11.5% - 12.0% ] 11.83% | 190,915 | 6.0% |
[ 12.0% - 12.5% ] 12.11% | 47,175 | 2.2% |
[ 12.0% - 12.5% ] 12.31% | 82,318 | 3.7% |
[ 12.0% - 12.5% ] 12.48% | 145,453 | 3.6% |
[ 12.5% - 13.0% ] 12.67% | 122,114 | 2.3% |
[ 12.5% - 13.0% ] 12.87% | 55,422 | 9.6% |
[ 13.0% - 13.5% ] 13.14% | 66,157 | 3.8% |
[ 13.0% - 13.5% ] 13.39% | 105,737 | 2.0% |
[ 13.5% - 14.0% ] 13.61% | 136,078 | 2.9% |
[ 13.5% - 14.0% ] 13.69% | 128,058 | 3.6% |
[ 13.5% - 14.0% ] 13.94% | 83,315 | 1.5% |
[ 14.0% - 14.5% ] 14.13% | 159,514 | 2.8% |
[ 14.0% - 14.5% ] 14.34% | 86,119 | 3.6% |
[ 14.5% - 15.0% ] 14.75% | 40,751 | 1.7% |
[ 14.5% - 15.0% ] 14.77% | 14,344 | 4.2% |
[ 15.0% - 15.5% ] 15.00% | 204,934 | 4.7% |
[ 15.0% - 15.5% ] 15.21% | 22,030 | 4.7% |
[ 15.5% - 16.0% ] 15.50% | 115,278 | 3.1% |
[ 15.5% - 16.0% ] 15.82% | 82,393 | 4.2% |
[ 15.5% - 16.0% ] 15.89% | 4,960 | 9.6% |
[ 16.0% - 16.5% ] 16.13% | 35,162 | 4.2% |
[ 16.0% - 16.5% ] 16.33% | 93,461 | 4.8% |
[ 16.5% - 17.0% ] 16.65% | 256,521 | 5.3% |
[ 16.5% - 17.0% ] 16.73% | 24,444 | 3.2% |
[ 17.0% - 17.5% ] 17.04% | 158,485 | 1.7% |
[ 17.0% - 17.5% ] 17.31% | 15,571 | 3.3% |
[ 17.5% - 18.0% ] 17.71% | 86,266 | 2.7% |
[ 17.5% - 18.0% ] 17.90% | 98,975 | 3.0% |
[ 18.0% - 18.5% ] 18.09% | 140,890 | 3.3% |
[ 18.0% - 18.5% ] 18.31% | 14,345 | 2.0% |
[ 19.0% - 19.5% ] 19.04% | 124,761 | 4.3% |
[ 19.0% - 19.5% ] 19.10% | 11,603 | 1.1% |
[ 19.5% - 20.0% ] 19.83% | 59,763 | 2.0% |
[ 20.0% - 20.5% ] 20.26% | 316,805 | 2.9% |
[ 20.0% - 20.5% ] 20.44% | 61,414 | 2.0% |
[ 21.0% - 21.5% ] 21.02% | 55,440 | 2.7% |
[ 22.0% - 22.5% ] 22.12% | 22,796 | 1.2% |
[ 22.0% - 22.5% ] 22.19% | 89,256 | 3.0% |
[ 22.5% - 23.0% ] 22.63% | 38,567 | 1.3% |
[ 23.0% - 23.5% ] 23.35% | 27,571 | 7.4% |
[ 23.5% - 24.0% ] 23.73% | 53,464 | 1.1% |
[ 24.0% - 24.5% ] 24.16% | 21,806 | 5.3% |
[ 24.0% - 24.5% ] 24.39% | 7,972 | 3.4% |
[ 24.5% - 25.0% ] 24.65% | 20,954 | 0.42% |
[ 25.0% - 25.5% ] 25.02% | 44,127 | 2.8% |
[ 27.0% - 27.5% ] 27.46% | 5,018 | 9.3% |
[ 28.5% - 29.0% ] 28.55% | 802 | 6.1% |
[ 28.5% - 29.0% ] 28.69% | 3,879 | 6.2% |
[ 29.0% - 29.5% ] 29.34% | 2,560 | 4.9% |
[ 29.5% - 30.0% ] 29.66% | 5,867 | 0.72% |
[ 29.5% - 30.0% ] 30.00% | 47,638 | 5.9% |
[ 31.0% - 31.5% ] 31.09% | 341 | 7.5% |
[ 33.0% - 33.5% ] 33.47% | 44,570 | 2.9% |
[ 33.5% - 34.0% ] 33.70% | 22,993 | 2.2% |
[ 33.5% - 34.0% ] 33.85% | 15,585 | 1.7% |
[ 34.5% - 35.0% ] 34.84% | 37,022 | 7.9% |
[ 35.5% - 36.0% ] 35.84% | 39,565 | 2.8% |
[ 40.5% - 41.0% ] 40.60% | 2,549 | 1.3% |