Costa Rican Disability Age 5 to 17

COMPARE

Costa Rican
Race
Ancestry
AfghanAfricanAlaska NativeAlaskan AthabascanAlbanianAleutAlsatianAmericanApacheArabArapahoArgentineanArmenianAssyrian/Chaldean/SyriacAustralianAustrianBahamianBangladeshiBarbadianBasqueBelgianBelizeanBermudanBhutaneseBlackfeetBolivianBrazilianBritishBritish West IndianBulgarianBurmeseCajunCambodianCanadianCape VerdeanCarpatho RusynCelticCentral AmericanCentral American IndianCherokeeCheyenneChickasawChileanChineseChippewaChoctawColombianColvilleComancheCosta RicanCreeCreekCroatianCrowCubanCypriotCzechCzechoslovakianDanishDelawareDominicanDutchDutch West IndianEastern EuropeanEcuadorianEgyptianEnglishEstonianEthiopianEuropeanFijianFilipinoFinnishFrenchFrench American IndianFrench CanadianGermanGerman RussianGhanaianGreekGuamanian/ChamorroGuatemalanGuyaneseHaitianHmongHonduranHopiHoumaHungarianIcelanderIndian (Asian)IndonesianInupiatIranianIraqiIrishIroquoisIsraeliItalianJamaicanJapaneseJordanianKenyanKiowaKoreanLaotianLatvianLebaneseLiberianLithuanianLumbeeLuxembourgerMacedonianMalaysianMalteseMarshalleseMenomineeMexicanMexican American IndianMongolianMoroccanNative HawaiianNavajoNepaleseNew ZealanderNicaraguanNigerianNorthern EuropeanNorwegianOkinawanOsageOttawaPaiutePakistaniPalestinianPanamanianParaguayanPennsylvania GermanPeruvianPimaPolishPortuguesePotawatomiPuebloPuerto RicanPuget Sound SalishRomanianRussianSalvadoranSamoanScandinavianScotch-IrishScottishSeminoleSenegaleseSerbianShoshoneSierra LeoneanSiouxSlavicSlovakSloveneSomaliSouth AfricanSouth AmericanSouth American IndianSoviet UnionSpaniardSpanishSpanish AmericanSpanish American IndianSri LankanSubsaharan AfricanSudaneseSwedishSwissSyrianTaiwaneseThaiTlingit-HaidaTohono O'OdhamTonganTrinidadian and TobagonianTsimshianTurkishU.S. Virgin IslanderUgandanUkrainianUruguayanUteVenezuelanVietnameseWelshWest IndianYakamaYaquiYugoslavianYumanYup'ikZimbabwean
Immigration
NonimmigrantsImmigrantsAfghanistanAfricaAlbaniaArgentinaArmeniaAsiaAustraliaAustriaBahamasBangladeshBarbadosBelarusBelgiumBelizeBoliviaBosnia and HerzegovinaBrazilBulgariaBurma/MyanmarCabo VerdeCambodiaCameroonCanadaCaribbeanCentral AmericaChileChinaColombiaCongoCosta RicaCroatiaCubaCzechoslovakiaDenmarkDominicaDominican RepublicEastern AfricaEastern AsiaEastern EuropeEcuadorEgyptEl SalvadorEnglandEritreaEthiopiaEuropeFijiFranceGermanyGhanaGreeceGrenadaGuatemalaGuyanaHaitiHondurasHong KongHungaryIndiaIndonesiaIranIraqIrelandIsraelItalyJamaicaJapanJordanKazakhstanKenyaKoreaKuwaitLaosLatin AmericaLatviaLebanonLiberiaLithuaniaMalaysiaMexicoMicronesiaMiddle AfricaMoldovaMoroccoNepalNetherlandsNicaraguaNigeriaNorth AmericaNorth MacedoniaNorthern AfricaNorthern EuropeNorwayOceaniaPakistanPanamaPeruPhilippinesPolandPortugalRomaniaRussiaSaudi ArabiaScotlandSenegalSerbiaSierra LeoneSingaporeSomaliaSouth AfricaSouth AmericaSouth Central AsiaSouth Eastern AsiaSouthern EuropeSpainSri LankaSt. Vincent and the GrenadinesSudanSwedenSwitzerlandSyriaTaiwanThailandTrinidad and TobagoTurkeyUgandaUkraineUruguayUzbekistanVenezuelaVietnamWest IndiesWestern AfricaWestern AsiaWestern EuropeYemenZaireZimbabweAzores
Select to Compare
Race
Ancestry
AfghanAfricanAlaska NativeAlaskan AthabascanAlbanianAleutAlsatianAmericanApacheArabArapahoArgentineanArmenianAssyrian/Chaldean/SyriacAustralianAustrianBahamianBangladeshiBarbadianBasqueBelgianBelizeanBermudanBhutaneseBlackfeetBolivianBrazilianBritishBritish West IndianBulgarianBurmeseCajunCambodianCanadianCape VerdeanCarpatho RusynCelticCentral AmericanCentral American IndianCherokeeCheyenneChickasawChileanChineseChippewaChoctawColombianColvilleComancheCreeCreekCroatianCrowCubanCypriotCzechCzechoslovakianDanishDelawareDominicanDutchDutch West IndianEastern EuropeanEcuadorianEgyptianEnglishEstonianEthiopianEuropeanFijianFilipinoFinnishFrenchFrench American IndianFrench CanadianGermanGerman RussianGhanaianGreekGuamanian/ChamorroGuatemalanGuyaneseHaitianHmongHonduranHopiHoumaHungarianIcelanderIndian (Asian)IndonesianInupiatIranianIraqiIrishIroquoisIsraeliItalianJamaicanJapaneseJordanianKenyanKiowaKoreanLaotianLatvianLebaneseLiberianLithuanianLumbeeLuxembourgerMacedonianMalaysianMalteseMarshalleseMenomineeMexicanMexican American IndianMongolianMoroccanNative HawaiianNavajoNepaleseNew ZealanderNicaraguanNigerianNorthern EuropeanNorwegianOkinawanOsageOttawaPaiutePakistaniPalestinianPanamanianParaguayanPennsylvania GermanPeruvianPimaPolishPortuguesePotawatomiPuebloPuerto RicanPuget Sound SalishRomanianRussianSalvadoranSamoanScandinavianScotch-IrishScottishSeminoleSenegaleseSerbianShoshoneSierra LeoneanSiouxSlavicSlovakSloveneSomaliSouth AfricanSouth AmericanSouth American IndianSoviet UnionSpaniardSpanishSpanish AmericanSpanish American IndianSri LankanSubsaharan AfricanSudaneseSwedishSwissSyrianTaiwaneseThaiTlingit-HaidaTohono O'OdhamTonganTrinidadian and TobagonianTsimshianTurkishU.S. Virgin IslanderUgandanUkrainianUruguayanUteVenezuelanVietnameseWelshWest IndianYakamaYaquiYugoslavianYumanYup'ikZimbabwean
Immigration
NonimmigrantsImmigrantsAfghanistanAfricaAlbaniaArgentinaArmeniaAsiaAustraliaAustriaBahamasBangladeshBarbadosBelarusBelgiumBelizeBoliviaBosnia and HerzegovinaBrazilBulgariaBurma/MyanmarCabo VerdeCambodiaCameroonCanadaCaribbeanCentral AmericaChileChinaColombiaCongoCosta RicaCroatiaCubaCzechoslovakiaDenmarkDominicaDominican RepublicEastern AfricaEastern AsiaEastern EuropeEcuadorEgyptEl SalvadorEnglandEritreaEthiopiaEuropeFijiFranceGermanyGhanaGreeceGrenadaGuatemalaGuyanaHaitiHondurasHong KongHungaryIndiaIndonesiaIranIraqIrelandIsraelItalyJamaicaJapanJordanKazakhstanKenyaKoreaKuwaitLaosLatin AmericaLatviaLebanonLiberiaLithuaniaMalaysiaMexicoMicronesiaMiddle AfricaMoldovaMoroccoNepalNetherlandsNicaraguaNigeriaNorth AmericaNorth MacedoniaNorthern AfricaNorthern EuropeNorwayOceaniaPakistanPanamaPeruPhilippinesPolandPortugalRomaniaRussiaSaudi ArabiaScotlandSenegalSerbiaSierra LeoneSingaporeSomaliaSouth AfricaSouth AmericaSouth Central AsiaSouth Eastern AsiaSouthern EuropeSpainSri LankaSt. Vincent and the GrenadinesSudanSwedenSwitzerlandSyriaTaiwanThailandTrinidad and TobagoTurkeyUgandaUkraineUruguayUzbekistanVenezuelaVietnamWest IndiesWestern AfricaWestern AsiaWestern EuropeYemenZaireZimbabweAzores
Disability Age 5 to 17
Income
Poverty
Unemployment
Labor Participation
Family Structure
Vehicle Availability
Education Level
Disability

Costa Rican Disability Age 5 to 17
Average

5.6%
DISABILITY | AGE 5 TO 17
50.0/ 100
METRIC RATING
174th/ 347
METRIC RANK

Costa Rican Disability Age 5 to 17 Correlation Chart

The statistical analysis conducted on geographies consisting of 252,489,466 people shows a poor positive correlation between the proportion of Costa Ricans and percentage of population with a disability between the ages 5 and 17 in the United States with a correlation coefficient (R) of 0.183 and weighted average of 5.6%. On average, for every 1% (one percent) increase in Costa Ricans within a typical geography, there is an increase of 0.21% in percentage of population with a disability between the ages 5 and 17.
Costa Rican Disability Age 5 to 17
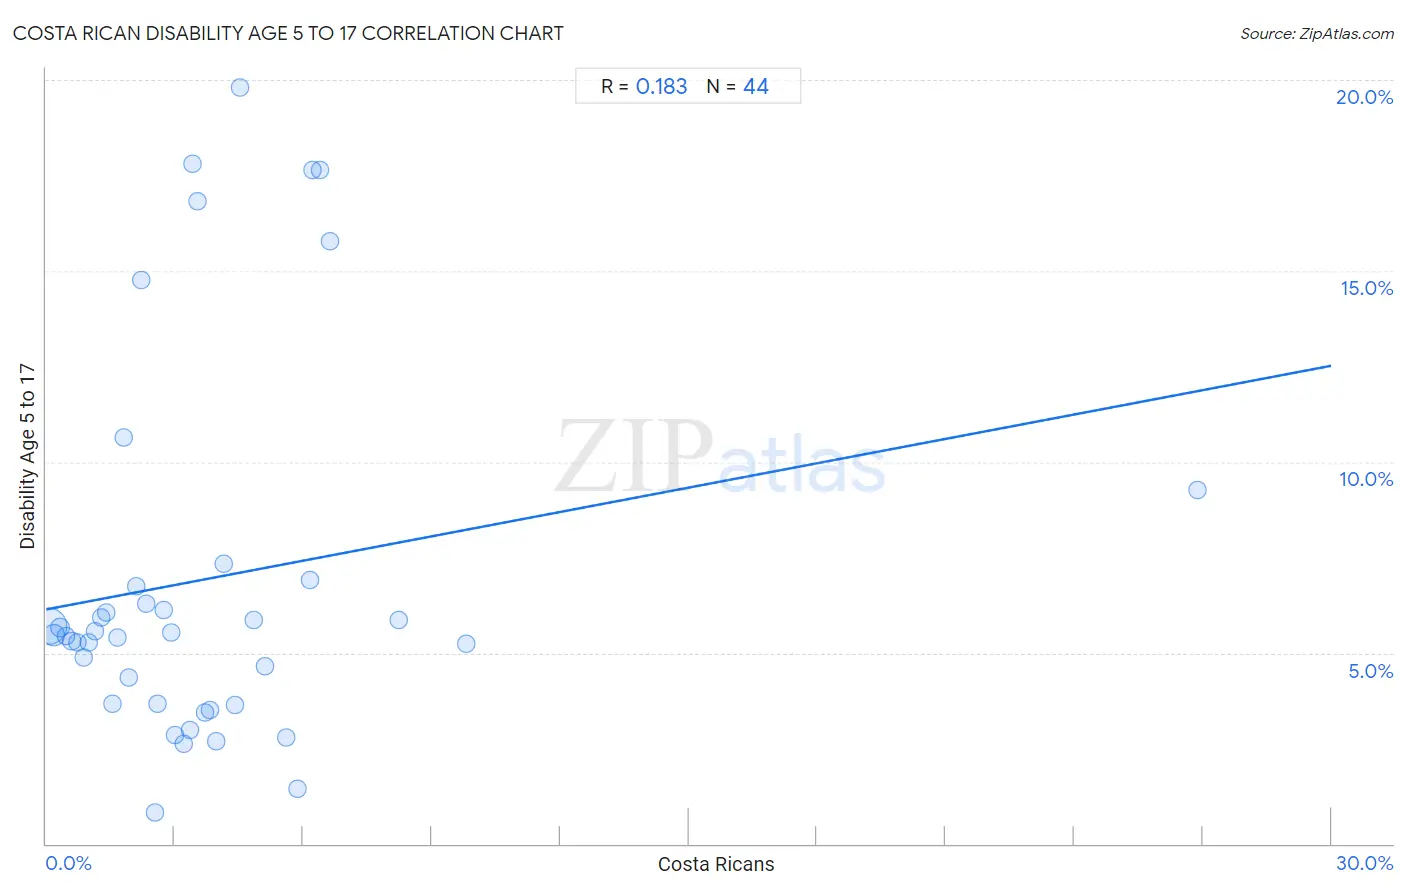
It is essential to understand that the correlation between the percentage of Costa Ricans and percentage of population with a disability between the ages 5 and 17 does not imply a direct cause-and-effect relationship. It remains uncertain whether the presence of Costa Ricans influences an upward or downward trend in the level of percentage of population with a disability between the ages 5 and 17 within an area, or if Costa Ricans simply ended up residing in those areas with higher or lower levels of percentage of population with a disability between the ages 5 and 17 due to other factors.

Demographics Similar to Costa Ricans by Disability Age 5 to 17

In terms of disability age 5 to 17, the demographic groups most similar to Costa Ricans are Shoshone (5.6%, a difference of 0.030%), Immigrants from Central America (5.6%, a difference of 0.030%), Uruguayan (5.6%, a difference of 0.050%), Ukrainian (5.6%, a difference of 0.080%), and Immigrants from Western Europe (5.6%, a difference of 0.11%).
DemographicsRating | RankDisability Age 5 to 17
Immigrants from Burma/Myanmar
59.3
/100
|
#167
Average
5.6%
Iraqis
56.0
/100
|
#168
Average
5.6%
Immigrants from Norway
55.7
/100
|
#169
Average
5.6%
Serbians
54.0
/100
|
#170
Average
5.6%
Immigrants from Iraq
53.9
/100
|
#171
Average
5.6%
Ukrainians
51.5
/100
|
#172
Average
5.6%
Uruguayans
51.0
/100
|
#173
Average
5.6%
Costa Ricans
50.0
/100
|
#174
Average
5.6%
Shoshone
49.4
/100
|
#175
Average
5.6%
Immigrants from Central America
49.4
/100
|
#176
Average
5.6%
Immigrants from Western Europe
47.8
/100
|
#177
Average
5.6%
Immigrants from Trinidad and Tobago
47.6
/100
|
#178
Average
5.6%
Immigrants from Barbados
40.5
/100
|
#179
Average
5.6%
Immigrants from Uruguay
37.7
/100
|
#180
Fair
5.6%
Immigrants from England
36.4
/100
|
#181
Fair
5.6%

Costa Rican Disability Age 5 to 17 Correlation Summary

MeasurementCosta Rican DataDisability Age 5 to 17 Data
Minimum0.054%0.81%
Maximum26.9%19.8%
Range26.8%19.0%
Mean3.8%6.9%
Median3.0%5.5%
Interquartile 25% (IQ1)1.5%3.7%
Interquartile 75% (IQ3)4.7%6.8%
Interquartile Range (IQR)3.2%3.2%
Standard Deviation (Sample)4.2%4.9%
Standard Deviation (Population)4.2%4.8%

Correlation Details

Costa Rican PercentileSample SizeDisability Age 5 to 17
[
0.0%
-
0.5%
]
0.054%
193,169,4525.7%
[
0.0%
-
0.5%
]
0.19%
35,341,1335.5%
[
0.0%
-
0.5%
]
0.33%
11,210,6335.6%
[
0.0%
-
0.5%
]
0.46%
4,892,0195.4%
[
0.5%
-
1.0%
]
0.59%
2,772,7265.3%
[
0.5%
-
1.0%
]
0.73%
1,686,8125.3%
[
0.5%
-
1.0%
]
0.87%
872,6894.9%
[
1.0%
-
1.5%
]
1.00%
626,7995.3%
[
1.0%
-
1.5%
]
1.14%
332,0635.6%
[
1.0%
-
1.5%
]
1.28%
317,3425.9%
[
1.0%
-
1.5%
]
1.41%
194,2786.1%
[
1.5%
-
2.0%
]
1.55%
135,0753.7%
[
1.5%
-
2.0%
]
1.67%
136,9225.4%
[
1.5%
-
2.0%
]
1.81%
70,03510.6%
[
1.5%
-
2.0%
]
1.93%
196,9164.3%
[
2.0%
-
2.5%
]
2.10%
88,6466.8%
[
2.0%
-
2.5%
]
2.23%
35,47214.8%
[
2.0%
-
2.5%
]
2.33%
30,4486.3%
[
2.5%
-
3.0%
]
2.54%
7,6440.81%
[
2.5%
-
3.0%
]
2.60%
45,5313.7%
[
2.5%
-
3.0%
]
2.74%
30,4386.1%
[
2.5%
-
3.0%
]
2.91%
67,1415.5%
[
2.5%
-
3.0%
]
3.00%
34,4402.9%
[
3.0%
-
3.5%
]
3.20%
6,3122.6%
[
3.0%
-
3.5%
]
3.36%
21,0403.0%
[
3.0%
-
3.5%
]
3.41%
7,62917.8%
[
3.5%
-
4.0%
]
3.53%
1,27316.8%
[
3.5%
-
4.0%
]
3.71%
2,2923.4%
[
3.5%
-
4.0%
]
3.83%
21,5073.5%
[
3.5%
-
4.0%
]
3.96%
30,8662.7%
[
4.0%
-
4.5%
]
4.14%
8,7387.3%
[
4.0%
-
4.5%
]
4.41%
9,7813.6%
[
4.5%
-
5.0%
]
4.53%
7,12519.8%
[
4.5%
-
5.0%
]
4.84%
3,3095.9%
[
5.0%
-
5.5%
]
5.10%
16,6024.7%
[
5.5%
-
6.0%
]
5.60%
1,5192.8%
[
5.5%
-
6.0%
]
5.85%
8,2871.5%
[
6.0%
-
6.5%
]
6.15%
1,5946.9%
[
6.0%
-
6.5%
]
6.22%
5,37317.6%
[
6.0%
-
6.5%
]
6.39%
5,22617.6%
[
6.5%
-
7.0%
]
6.61%
9,67615.8%
[
8.0%
-
8.5%
]
8.23%
14,1735.9%
[
9.5%
-
10.0%
]
9.80%
11,9065.2%
[
26.5%
-
27.0%
]
26.88%
5849.3%