In Labor Force | Age 20-24 by Race, Ethnicity and Immigration Origin
SELECT DEMOGRAPHIC
Select Demographic
In Labor Force | Age 20-24
Common Questions
What are the top races in the United States with the highest labor force participation rate among population between the ages 20 and 24?
The top races in the United States with the highest labor force participation rate among population between the ages 20 and 24 are:
#1
Hawaiians
77.0%
(99.9/100)
#2
Whites/Caucasians
76.9%
(99.9/100)
#3
Hispanics or Latinos
74.4%
(7.9/100)
What are the top ancestries in the United States with the highest labor force participation rate among population between the ages 20 and 24?
The top ancestries in the United States with the highest labor force participation rate among population between the ages 20 and 24 are:
#1
Norwegians
80.1%
(100.0/100)
#2
Somalis
79.3%
(100.0/100)
#3
Alaskan Athabascans
79.1%
(100.0/100)
#4
Aleuts
79.0%
(100.0/100)
#5
Danes
79.0%
(100.0/100)
What are the top immigration origins in the United States with the highest labor force participation rate among population between the ages 20 and 24?
The top immigration origins in the United States with the highest labor force participation rate among population between the ages 20 and 24 are:
#1
Immigrants from Somalia
79.5%
(100.0/100)
#2
Immigrants from Cabo Verde
78.9%
(100.0/100)
#3
Immigrants from Bosnia and Herzegovina
78.1%
(100.0/100)
#4
Immigrants from Micronesia
77.8%
(100.0/100)
#5
Immigrants from Ethiopia
77.5%
(100.0/100)
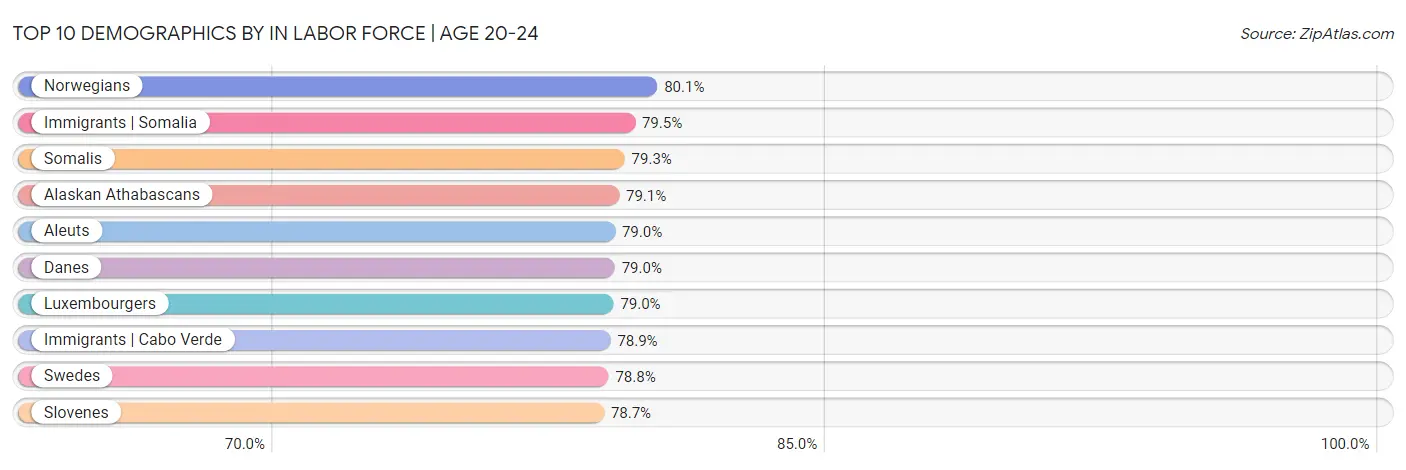
Top 10 Demographics by In Labor Force | Age 20-24
The best off demographics with the highest labor force participation rate among population between the ages 20 and 24 in the United States are Norwegian (80.1%, 100.0/100), Immigrants from Somalia (79.5%, 100.0/100), Somali (79.3%, 100.0/100), Alaskan Athabascan (79.1%, 100.0/100), and Aleut (79.0%, 100.0/100).
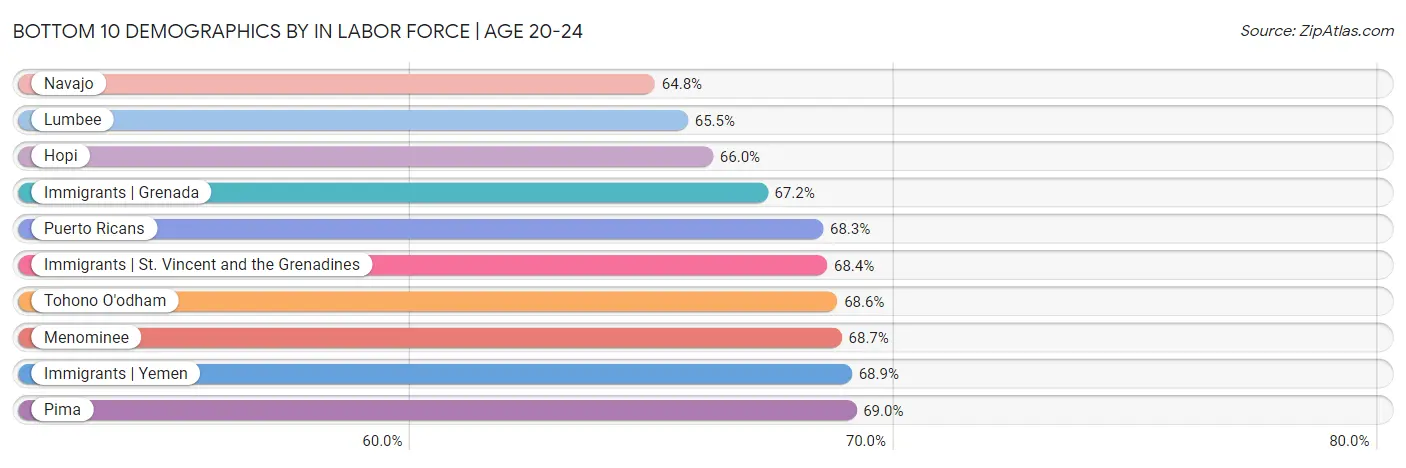
Bottom 10 Demographics by In Labor Force | Age 20-24
The worst off demographics with the lowest labor force participation rate among population between the ages 20 and 24 in the United States are Navajo (64.8%, 0.0/100), Lumbee (65.5%, 0.0/100), Hopi (66.0%, 0.0/100), Immigrants from Grenada (67.2%, 0.0/100), and Puerto Rican (68.3%, 0.0/100).
In Labor Force | Age 20-24 by Race
Top demographics by In Labor Force | Age 20-24 within the race category in the United States are Hawaiians (77.0%, 99.9/100), Whites/Caucasians (76.9%, 99.9/100), and Hispanics or Latinos (74.4%, 7.9/100).
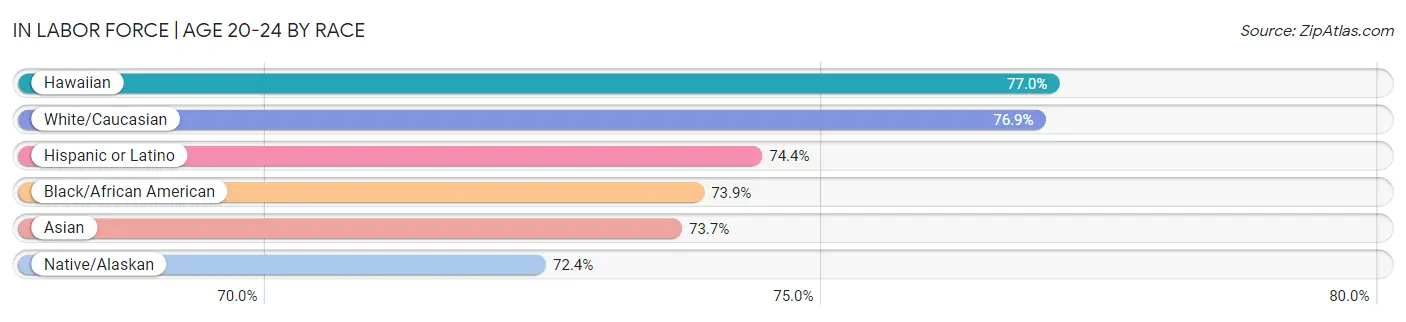
| Race | Rating | Rank | In Labor Force | Age 20-24 |
| Asian | 0.6 /100 | #262 | Tragic 73.7% |
| Black/African American | 1.3 /100 | #249 | Tragic 73.9% |
| Hawaiian | 99.9 /100 | #58 | Exceptional 77.0% |
| Hispanic or Latino | 7.9 /100 | #223 | Tragic 74.4% |
| Native/Alaskan | 0.0 /100 | #302 | Tragic 72.4% |
| White/Caucasian | 99.9 /100 | #64 | Exceptional 76.9% |
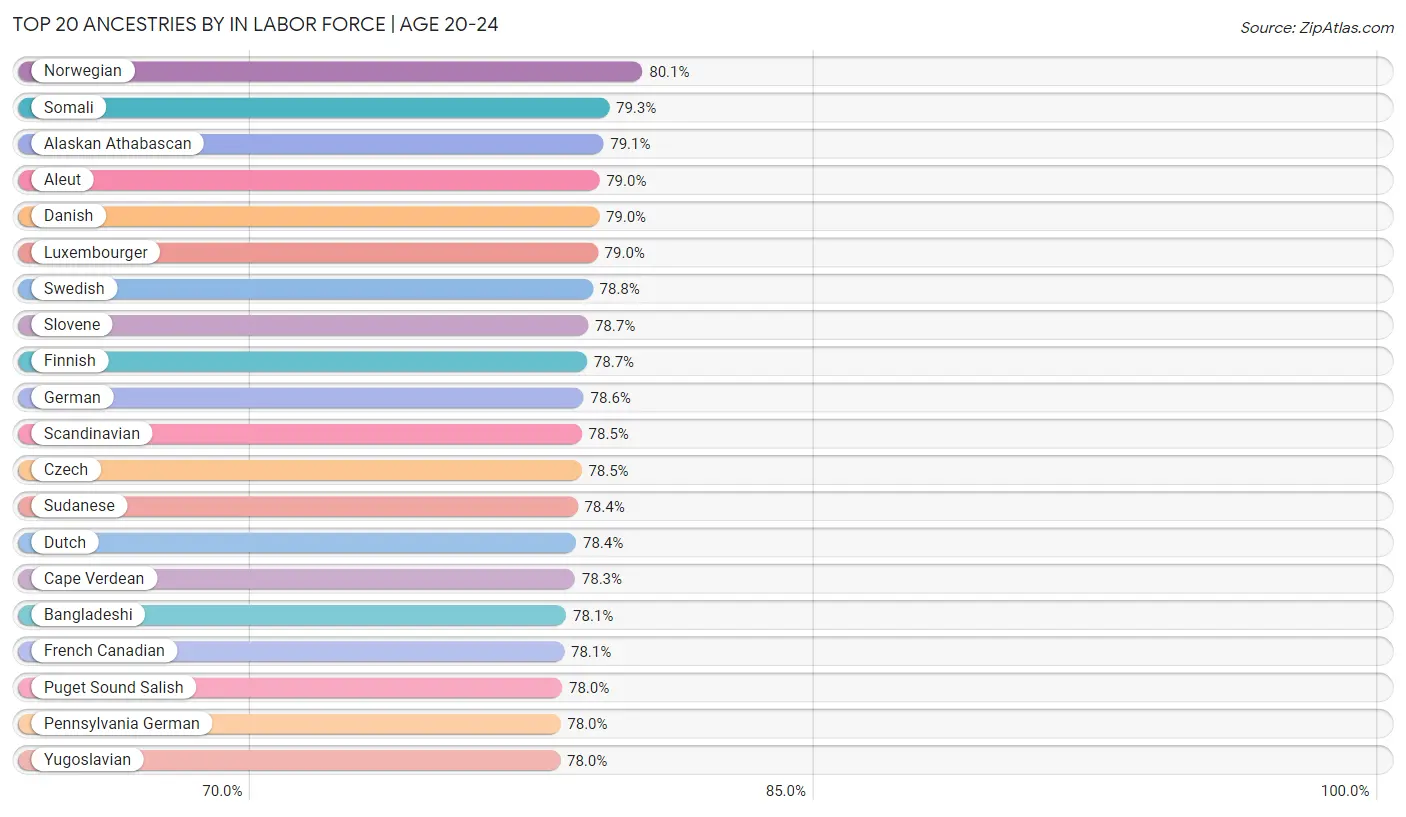
In Labor Force | Age 20-24 by Ancestry
Top 20 Ancestries by In Labor Force | Age 20-24
Top demographics by In Labor Force | Age 20-24 within the ancestry category in the United States are Norwegians (80.1%, 100.0/100), Somalis (79.3%, 100.0/100), Alaskan Athabascans (79.1%, 100.0/100), Aleuts (79.0%, 100.0/100), and Danes (79.0%, 100.0/100).
| Ancestry | Rating | Rank | In Labor Force | Age 20-24 |
| Afghan | 63.5 /100 | #165 | Good 75.2% |
| African | 42.5 /100 | #181 | Average 75.0% |
| Alaska Native | 95.1 /100 | #115 | Exceptional 75.9% |
| Alaskan Athabascan | 100.0 /100 | #4 | Exceptional 79.1% |
| Albanian | 16.2 /100 | #207 | Poor 74.6% |
| Aleut | 100.0 /100 | #5 | Exceptional 79.0% |
| Alsatian | 27.1 /100 | #193 | Fair 74.8% |
| American | 97.8 /100 | #99 | Exceptional 76.1% |
| Apache | 0.0 /100 | #311 | Tragic 72.0% |
| Arab | 15.8 /100 | #209 | Poor 74.6% |
| Arapaho | 1.0 /100 | #253 | Tragic 73.8% |
| Argentinean | 0.1 /100 | #288 | Tragic 73.1% |
| Armenian | 0.0 /100 | #300 | Tragic 72.5% |
| Assyrian/Chaldean/Syriac | 94.9 /100 | #117 | Exceptional 75.9% |
| Australian | 84.8 /100 | #138 | Excellent 75.5% |
| Austrian | 99.4 /100 | #84 | Exceptional 76.5% |
| Bahamian | 0.1 /100 | #280 | Tragic 73.3% |
| Bangladeshi | 100.0 /100 | #19 | Exceptional 78.1% |
| Barbadian | 0.0 /100 | #325 | Tragic 71.1% |
| Basque | 99.5 /100 | #81 | Exceptional 76.5% |
| Belgian | 100.0 /100 | #28 | Exceptional 77.8% |
| Belizean | 0.3 /100 | #272 | Tragic 73.4% |
| Bermudan | 3.2 /100 | #237 | Tragic 74.1% |
| Bhutanese | 80.8 /100 | #144 | Excellent 75.4% |
| Blackfeet | 83.6 /100 | #142 | Excellent 75.5% |
| Bolivian | 64.0 /100 | #164 | Good 75.2% |
| Brazilian | 93.0 /100 | #126 | Exceptional 75.8% |
| British | 99.8 /100 | #73 | Exceptional 76.7% |
| British West Indian | 0.0 /100 | #334 | Tragic 70.0% |
| Bulgarian | 99.2 /100 | #89 | Exceptional 76.4% |
| Burmese | 0.5 /100 | #265 | Tragic 73.6% |
| Cajun | 51.1 /100 | #171 | Average 75.1% |
| Cambodian | 60.5 /100 | #166 | Good 75.2% |
| Canadian | 99.6 /100 | #78 | Exceptional 76.6% |
| Cape Verdean | 100.0 /100 | #17 | Exceptional 78.3% |
| Carpatho Rusyn | 99.4 /100 | #83 | Exceptional 76.5% |
| Celtic | 99.9 /100 | #54 | Exceptional 77.1% |
| Central American | 48.7 /100 | #176 | Average 75.0% |
| Central American Indian | 0.0 /100 | #297 | Tragic 72.7% |
| Cherokee | 95.8 /100 | #109 | Exceptional 75.9% |
| Cheyenne | 0.2 /100 | #273 | Tragic 73.4% |
| Chickasaw | 10.3 /100 | #221 | Poor 74.5% |
| Chilean | 12.5 /100 | #217 | Poor 74.5% |
| Chinese | 100.0 /100 | #49 | Exceptional 77.3% |
| Chippewa | 99.9 /100 | #57 | Exceptional 77.1% |
| Choctaw | 21.4 /100 | #201 | Fair 74.7% |
| Colombian | 0.3 /100 | #269 | Tragic 73.5% |
| Colville | 1.5 /100 | #247 | Tragic 73.9% |
| Comanche | 77.6 /100 | #147 | Good 75.4% |
| Costa Rican | 64.2 /100 | #163 | Good 75.2% |
| Cree | 99.7 /100 | #74 | Exceptional 76.6% |
| Creek | 13.3 /100 | #212 | Poor 74.5% |
| Croatian | 100.0 /100 | #51 | Exceptional 77.2% |
| Crow | 99.9 /100 | #65 | Exceptional 76.9% |
| Cuban | 0.0 /100 | #301 | Tragic 72.5% |
| Cypriot | 0.2 /100 | #278 | Tragic 73.3% |
| Czech | 100.0 /100 | #14 | Exceptional 78.5% |
| Czechoslovakian | 100.0 /100 | #37 | Exceptional 77.5% |
| Danish | 100.0 /100 | #6 | Exceptional 79.0% |
| Delaware | 84.5 /100 | #140 | Excellent 75.5% |
| Dominican | 0.0 /100 | #326 | Tragic 71.1% |
| Dutch | 100.0 /100 | #16 | Exceptional 78.4% |
| Dutch West Indian | 0.7 /100 | #259 | Tragic 73.7% |
| Eastern European | 25.4 /100 | #195 | Fair 74.8% |
| Ecuadorian | 0.0 /100 | #303 | Tragic 72.4% |
| Egyptian | 0.7 /100 | #258 | Tragic 73.7% |
| English | 100.0 /100 | #32 | Exceptional 77.6% |
| Estonian | 87.1 /100 | #134 | Excellent 75.6% |
| Ethiopian | 100.0 /100 | #47 | Exceptional 77.3% |
| European | 99.9 /100 | #56 | Exceptional 77.1% |
| Fijian | 100.0 /100 | #44 | Exceptional 77.4% |
| Filipino | 0.0 /100 | #322 | Tragic 71.4% |
| Finnish | 100.0 /100 | #11 | Exceptional 78.7% |
| French | 100.0 /100 | #42 | Exceptional 77.4% |
| French American Indian | 99.8 /100 | #68 | Exceptional 76.8% |
| French Canadian | 100.0 /100 | #20 | Exceptional 78.1% |
| German | 100.0 /100 | #12 | Exceptional 78.6% |
| German Russian | 100.0 /100 | #34 | Exceptional 77.5% |
| Ghanaian | 6.2 /100 | #225 | Tragic 74.3% |
| Greek | 96.9 /100 | #107 | Exceptional 76.0% |
| Guamanian/Chamorro | 99.8 /100 | #72 | Exceptional 76.7% |
| Guatemalan | 72.3 /100 | #153 | Good 75.3% |
| Guyanese | 0.0 /100 | #337 | Tragic 69.2% |
| Haitian | 0.5 /100 | #266 | Tragic 73.6% |
| Hmong | 99.5 /100 | #82 | Exceptional 76.5% |
| Honduran | 32.7 /100 | #188 | Fair 74.8% |
| Hopi | 0.0 /100 | #345 | Tragic 66.0% |
| Houma | 0.6 /100 | #261 | Tragic 73.7% |
| Hungarian | 98.9 /100 | #93 | Exceptional 76.3% |
| Icelander | 99.9 /100 | #66 | Exceptional 76.9% |
| Indian (Asian) | 0.0 /100 | #314 | Tragic 71.9% |
| Indonesian | 100.0 /100 | #52 | Exceptional 77.2% |
| Inupiat | 17.6 /100 | #205 | Poor 74.6% |
| Iranian | 0.0 /100 | #299 | Tragic 72.6% |
| Iraqi | 96.6 /100 | #108 | Exceptional 76.0% |
| Irish | 100.0 /100 | #39 | Exceptional 77.4% |
| Iroquois | 89.1 /100 | #129 | Excellent 75.6% |
| Israeli | 0.0 /100 | #298 | Tragic 72.6% |
| Italian | 99.6 /100 | #80 | Exceptional 76.5% |
| Jamaican | 0.0 /100 | #296 | Tragic 72.7% |
| Japanese | 68.7 /100 | #160 | Good 75.3% |
| Jordanian | 84.8 /100 | #137 | Excellent 75.5% |
| Kenyan | 99.9 /100 | #60 | Exceptional 77.0% |
| Kiowa | 0.1 /100 | #284 | Tragic 73.2% |
| Korean | 79.7 /100 | #145 | Good 75.4% |
| Laotian | 3.5 /100 | #235 | Tragic 74.1% |
| Latvian | 97.6 /100 | #102 | Exceptional 76.1% |
| Lebanese | 73.5 /100 | #152 | Good 75.3% |
| Liberian | 100.0 /100 | #24 | Exceptional 78.0% |
| Lithuanian | 99.9 /100 | #63 | Exceptional 77.0% |
| Lumbee | 0.0 /100 | #346 | Tragic 65.5% |
| Luxembourger | 100.0 /100 | #7 | Exceptional 79.0% |
| Macedonian | 97.2 /100 | #104 | Exceptional 76.0% |
| Malaysian | 100.0 /100 | #50 | Exceptional 77.2% |
| Maltese | 98.9 /100 | #92 | Exceptional 76.3% |
| Marshallese | 100.0 /100 | #38 | Exceptional 77.4% |
| Menominee | 0.0 /100 | #340 | Tragic 68.7% |
| Mexican | 52.1 /100 | #170 | Average 75.1% |
| Mexican American Indian | 78.8 /100 | #146 | Good 75.4% |
| Mongolian | 0.2 /100 | #276 | Tragic 73.3% |
| Moroccan | 20.4 /100 | #202 | Fair 74.7% |
| Native Hawaiian | 100.0 /100 | #45 | Exceptional 77.4% |
| Navajo | 0.0 /100 | #347 | Tragic 64.8% |
| Nepalese | 10.5 /100 | #219 | Poor 74.5% |
| New Zealander | 65.4 /100 | #161 | Good 75.2% |
| Nicaraguan | 0.1 /100 | #285 | Tragic 73.2% |
| Nigerian | 21.9 /100 | #200 | Fair 74.7% |
| Northern European | 99.8 /100 | #71 | Exceptional 76.8% |
| Norwegian | 100.0 /100 | #1 | Exceptional 80.1% |
| Okinawan | 0.0 /100 | #295 | Tragic 72.7% |
| Osage | 72.3 /100 | #154 | Good 75.3% |
| Ottawa | 99.8 /100 | #70 | Exceptional 76.8% |
| Paiute | 74.1 /100 | #151 | Good 75.3% |
| Pakistani | 94.1 /100 | #122 | Exceptional 75.8% |
| Palestinian | 88.4 /100 | #132 | Excellent 75.6% |
| Panamanian | 25.0 /100 | #197 | Fair 74.7% |
| Paraguayan | 0.8 /100 | #257 | Tragic 73.7% |
| Pennsylvania German | 100.0 /100 | #22 | Exceptional 78.0% |
| Peruvian | 13.3 /100 | #213 | Poor 74.5% |
| Pima | 0.0 /100 | #338 | Tragic 69.0% |
| Polish | 100.0 /100 | #31 | Exceptional 77.6% |
| Portuguese | 99.3 /100 | #85 | Exceptional 76.4% |
| Potawatomi | 98.5 /100 | #94 | Exceptional 76.2% |
| Pueblo | 0.0 /100 | #292 | Tragic 72.9% |
| Puerto Rican | 0.0 /100 | #343 | Tragic 68.3% |
| Puget Sound Salish | 100.0 /100 | #21 | Exceptional 78.0% |
| Romanian | 84.1 /100 | #141 | Excellent 75.5% |
| Russian | 32.2 /100 | #190 | Fair 74.8% |
| Salvadoran | 74.8 /100 | #150 | Good 75.3% |
| Samoan | 100.0 /100 | #46 | Exceptional 77.4% |
| Scandinavian | 100.0 /100 | #13 | Exceptional 78.5% |
| Scotch-Irish | 99.9 /100 | #59 | Exceptional 77.0% |
| Scottish | 100.0 /100 | #40 | Exceptional 77.4% |
| Seminole | 6.9 /100 | #224 | Tragic 74.3% |
| Senegalese | 28.1 /100 | #191 | Fair 74.8% |
| Serbian | 100.0 /100 | #48 | Exceptional 77.3% |
| Shoshone | 97.8 /100 | #100 | Exceptional 76.1% |
| Sierra Leonean | 99.0 /100 | #91 | Exceptional 76.3% |
| Sioux | 17.5 /100 | #206 | Poor 74.6% |
| Slavic | 99.9 /100 | #67 | Exceptional 76.9% |
| Slovak | 100.0 /100 | #29 | Exceptional 77.7% |
| Slovene | 100.0 /100 | #10 | Exceptional 78.7% |
| Somali | 100.0 /100 | #3 | Exceptional 79.3% |
| South African | 50.0 /100 | #174 | Average 75.0% |
| South American | 0.4 /100 | #268 | Tragic 73.5% |
| South American Indian | 69.0 /100 | #159 | Good 75.3% |
| Soviet Union | 0.0 /100 | #308 | Tragic 72.3% |
| Spaniard | 82.0 /100 | #143 | Excellent 75.5% |
| Spanish | 99.2 /100 | #88 | Exceptional 76.4% |
| Spanish American | 94.8 /100 | #118 | Exceptional 75.8% |
| Spanish American Indian | 0.8 /100 | #256 | Tragic 73.7% |
| Sri Lankan | 34.9 /100 | #185 | Fair 74.9% |
| Subsaharan African | 90.9 /100 | #127 | Exceptional 75.7% |
| Sudanese | 100.0 /100 | #15 | Exceptional 78.4% |
| Swedish | 100.0 /100 | #9 | Exceptional 78.8% |
| Swiss | 100.0 /100 | #30 | Exceptional 77.7% |
| Syrian | 49.5 /100 | #175 | Average 75.0% |
| Taiwanese | 23.2 /100 | #199 | Fair 74.7% |
| Thai | 2.1 /100 | #242 | Tragic 74.0% |
| Tlingit-Haida | 100.0 /100 | #25 | Exceptional 77.9% |
| Tohono O'Odham | 0.0 /100 | #341 | Tragic 68.6% |
| Tongan | 100.0 /100 | #26 | Exceptional 77.9% |
| Trinidadian and Tobagonian | 0.0 /100 | #320 | Tragic 71.5% |
| Tsimshian | 0.0 /100 | #309 | Tragic 72.3% |
| Turkish | 1.8 /100 | #245 | Tragic 73.9% |
| U.S. Virgin Islander | 0.1 /100 | #289 | Tragic 73.0% |
| Ugandan | 76.1 /100 | #149 | Good 75.4% |
| Ukrainian | 95.7 /100 | #111 | Exceptional 75.9% |
| Uruguayan | 15.1 /100 | #210 | Poor 74.6% |
| Ute | 1.0 /100 | #254 | Tragic 73.8% |
| Venezuelan | 0.2 /100 | #279 | Tragic 73.3% |
| Vietnamese | 0.0 /100 | #330 | Tragic 70.6% |
| Welsh | 100.0 /100 | #36 | Exceptional 77.5% |
| West Indian | 0.0 /100 | #323 | Tragic 71.3% |
| Yakama | 50.8 /100 | #172 | Average 75.1% |
| Yaqui | 85.5 /100 | #135 | Excellent 75.5% |
| Yugoslavian | 100.0 /100 | #23 | Exceptional 78.0% |
| Yuman | 0.0 /100 | #333 | Tragic 70.3% |
| Yup'ik | 0.0 /100 | #329 | Tragic 70.9% |
| Zimbabwean | 88.2 /100 | #133 | Excellent 75.6% |
In Labor Force | Age 20-24 by Immigration
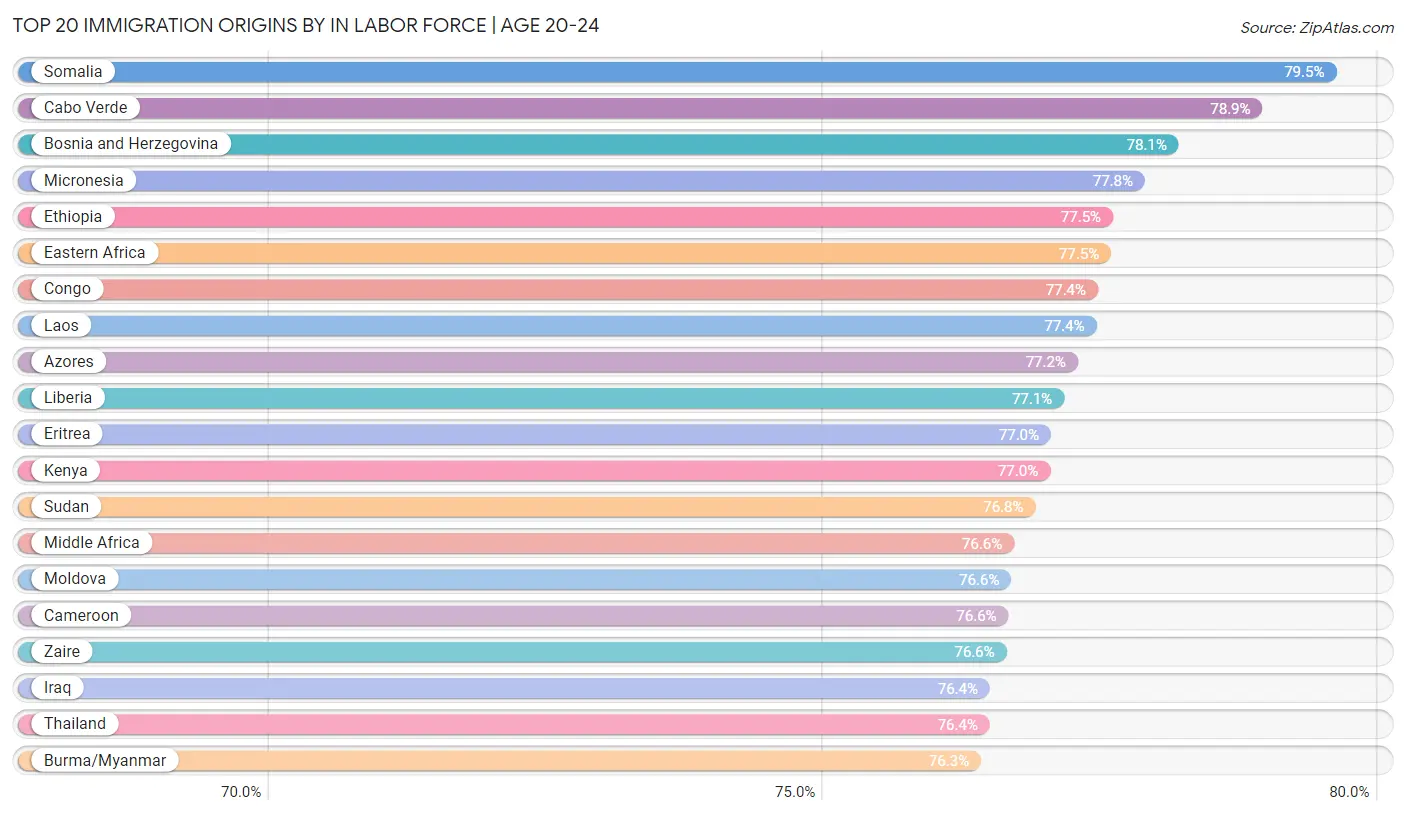
Top 20 Immigration Origins by In Labor Force | Age 20-24
Top demographics by In Labor Force | Age 20-24 within the immigration category in the United States are Immigrants from Somalia (79.5%, 100.0/100), Immigrants from Cabo Verde (78.9%, 100.0/100), Immigrants from Bosnia and Herzegovina (78.1%, 100.0/100), Immigrants from Micronesia (77.8%, 100.0/100), and Immigrants from Ethiopia (77.5%, 100.0/100).
| Immigration | Rating | Rank | In Labor Force | Age 20-24 |
| Nonimmigrants | 98.5 /100 | #96 | Exceptional 76.2% |
| Immigrants | 3.6 /100 | #234 | Tragic 74.1% |
| Afghanistan | 89.4 /100 | #128 | Excellent 75.6% |
| Africa | 94.6 /100 | #120 | Exceptional 75.8% |
| Albania | 4.3 /100 | #230 | Tragic 74.2% |
| Argentina | 0.0 /100 | #294 | Tragic 72.8% |
| Armenia | 0.0 /100 | #317 | Tragic 71.7% |
| Asia | 0.5 /100 | #263 | Tragic 73.6% |
| Australia | 14.7 /100 | #211 | Poor 74.6% |
| Austria | 88.8 /100 | #130 | Excellent 75.6% |
| Bahamas | 0.1 /100 | #283 | Tragic 73.2% |
| Bangladesh | 0.0 /100 | #331 | Tragic 70.6% |
| Barbados | 0.0 /100 | #335 | Tragic 69.7% |
| Belarus | 0.1 /100 | #290 | Tragic 73.0% |
| Belgium | 1.3 /100 | #250 | Tragic 73.9% |
| Belize | 0.0 /100 | #293 | Tragic 72.8% |
| Bolivia | 71.0 /100 | #158 | Good 75.3% |
| Bosnia and Herzegovina | 100.0 /100 | #18 | Exceptional 78.1% |
| Brazil | 84.8 /100 | #136 | Excellent 75.5% |
| Bulgaria | 94.1 /100 | #123 | Exceptional 75.8% |
| Burma/Myanmar | 99.1 /100 | #90 | Exceptional 76.3% |
| Cabo Verde | 100.0 /100 | #8 | Exceptional 78.9% |
| Cambodia | 76.7 /100 | #148 | Good 75.4% |
| Cameroon | 99.6 /100 | #77 | Exceptional 76.6% |
| Canada | 95.6 /100 | #112 | Exceptional 75.9% |
| Caribbean | 0.0 /100 | #312 | Tragic 71.9% |
| Central America | 45.0 /100 | #178 | Average 75.0% |
| Chile | 3.7 /100 | #233 | Tragic 74.1% |
| China | 0.0 /100 | #328 | Tragic 71.1% |
| Colombia | 0.2 /100 | #274 | Tragic 73.4% |
| Congo | 100.0 /100 | #41 | Exceptional 77.4% |
| Costa Rica | 36.7 /100 | #183 | Fair 74.9% |
| Croatia | 50.2 /100 | #173 | Average 75.1% |
| Cuba | 0.0 /100 | #310 | Tragic 72.0% |
| Czechoslovakia | 44.0 /100 | #180 | Average 75.0% |
| Denmark | 25.8 /100 | #194 | Fair 74.8% |
| Dominica | 0.0 /100 | #313 | Tragic 71.9% |
| Dominican Republic | 0.0 /100 | #324 | Tragic 71.2% |
| Eastern Africa | 100.0 /100 | #35 | Exceptional 77.5% |
| Eastern Asia | 0.0 /100 | #316 | Tragic 71.8% |
| Eastern Europe | 33.8 /100 | #186 | Fair 74.9% |
| Ecuador | 0.0 /100 | #307 | Tragic 72.3% |
| Egypt | 1.2 /100 | #251 | Tragic 73.8% |
| El Salvador | 71.7 /100 | #156 | Good 75.3% |
| England | 84.6 /100 | #139 | Excellent 75.5% |
| Eritrea | 99.9 /100 | #61 | Exceptional 77.0% |
| Ethiopia | 100.0 /100 | #33 | Exceptional 77.5% |
| Europe | 27.5 /100 | #192 | Fair 74.8% |
| Fiji | 5.9 /100 | #226 | Tragic 74.3% |
| France | 3.3 /100 | #236 | Tragic 74.1% |
| Germany | 98.5 /100 | #95 | Exceptional 76.2% |
| Ghana | 12.7 /100 | #215 | Poor 74.5% |
| Greece | 4.1 /100 | #231 | Tragic 74.2% |
| Grenada | 0.0 /100 | #344 | Tragic 67.2% |
| Guatemala | 71.9 /100 | #155 | Good 75.3% |
| Guyana | 0.0 /100 | #336 | Tragic 69.3% |
| Haiti | 0.5 /100 | #264 | Tragic 73.6% |
| Honduras | 33.5 /100 | #187 | Fair 74.9% |
| Hong Kong | 0.0 /100 | #318 | Tragic 71.6% |
| Hungary | 35.0 /100 | #184 | Fair 74.9% |
| India | 9.9 /100 | #222 | Tragic 74.4% |
| Indonesia | 0.3 /100 | #271 | Tragic 73.4% |
| Iran | 0.0 /100 | #315 | Tragic 71.8% |
| Iraq | 99.3 /100 | #86 | Exceptional 76.4% |
| Ireland | 5.8 /100 | #227 | Tragic 74.3% |
| Israel | 0.0 /100 | #319 | Tragic 71.6% |
| Italy | 17.6 /100 | #204 | Poor 74.6% |
| Jamaica | 0.0 /100 | #306 | Tragic 72.4% |
| Japan | 3.0 /100 | #238 | Tragic 74.1% |
| Jordan | 88.5 /100 | #131 | Excellent 75.6% |
| Kazakhstan | 1.1 /100 | #252 | Tragic 73.8% |
| Kenya | 99.9 /100 | #62 | Exceptional 77.0% |
| Korea | 0.1 /100 | #287 | Tragic 73.1% |
| Kuwait | 12.7 /100 | #216 | Poor 74.5% |
| Laos | 100.0 /100 | #43 | Exceptional 77.4% |
| Latin America | 2.7 /100 | #239 | Tragic 74.1% |
| Latvia | 44.1 /100 | #179 | Average 75.0% |
| Lebanon | 0.1 /100 | #286 | Tragic 73.1% |
| Liberia | 99.9 /100 | #55 | Exceptional 77.1% |
| Lithuania | 98.0 /100 | #97 | Exceptional 76.1% |
| Malaysia | 0.2 /100 | #277 | Tragic 73.3% |
| Mexico | 47.8 /100 | #177 | Average 75.0% |
| Micronesia | 100.0 /100 | #27 | Exceptional 77.8% |
| Middle Africa | 99.7 /100 | #75 | Exceptional 76.6% |
| Moldova | 99.6 /100 | #76 | Exceptional 76.6% |
| Morocco | 95.8 /100 | #110 | Exceptional 75.9% |
| Nepal | 97.2 /100 | #105 | Exceptional 76.0% |
| Netherlands | 95.3 /100 | #113 | Exceptional 75.9% |
| Nicaragua | 0.0 /100 | #291 | Tragic 72.9% |
| Nigeria | 24.2 /100 | #198 | Fair 74.7% |
| North America | 95.0 /100 | #116 | Exceptional 75.9% |
| North Macedonia | 97.5 /100 | #103 | Exceptional 76.1% |
| Northern Africa | 17.9 /100 | #203 | Poor 74.6% |
| Northern Europe | 32.6 /100 | #189 | Fair 74.8% |
| Norway | 10.3 /100 | #220 | Poor 74.5% |
| Oceania | 98.0 /100 | #98 | Exceptional 76.1% |
| Pakistan | 0.9 /100 | #255 | Tragic 73.8% |
| Panama | 1.6 /100 | #246 | Tragic 73.9% |
| Peru | 10.6 /100 | #218 | Poor 74.5% |
| Philippines | 55.8 /100 | #169 | Average 75.1% |
| Poland | 97.7 /100 | #101 | Exceptional 76.1% |
| Portugal | 94.8 /100 | #119 | Exceptional 75.8% |
| Romania | 64.6 /100 | #162 | Good 75.2% |
| Russia | 0.3 /100 | #270 | Tragic 73.5% |
| Saudi Arabia | 1.5 /100 | #248 | Tragic 73.9% |
| Scotland | 93.7 /100 | #125 | Exceptional 75.8% |
| Senegal | 2.1 /100 | #241 | Tragic 74.0% |
| Serbia | 94.3 /100 | #121 | Exceptional 75.8% |
| Sierra Leone | 93.8 /100 | #124 | Exceptional 75.8% |
| Singapore | 0.0 /100 | #305 | Tragic 72.4% |
| Somalia | 100.0 /100 | #2 | Exceptional 79.5% |
| South Africa | 36.9 /100 | #182 | Fair 74.9% |
| South America | 0.2 /100 | #275 | Tragic 73.3% |
| South Central Asia | 1.9 /100 | #244 | Tragic 74.0% |
| South Eastern Asia | 57.5 /100 | #167 | Average 75.1% |
| Southern Europe | 13.2 /100 | #214 | Poor 74.5% |
| Spain | 0.1 /100 | #282 | Tragic 73.2% |
| Sri Lanka | 2.3 /100 | #240 | Tragic 74.0% |
| St. Vincent and the Grenadines | 0.0 /100 | #342 | Tragic 68.4% |
| Sudan | 99.8 /100 | #69 | Exceptional 76.8% |
| Sweden | 4.6 /100 | #229 | Tragic 74.2% |
| Switzerland | 4.1 /100 | #232 | Tragic 74.2% |
| Syria | 1.9 /100 | #243 | Tragic 74.0% |
| Taiwan | 0.0 /100 | #321 | Tragic 71.5% |
| Thailand | 99.3 /100 | #87 | Exceptional 76.4% |
| Trinidad and Tobago | 0.0 /100 | #327 | Tragic 71.1% |
| Turkey | 0.7 /100 | #260 | Tragic 73.7% |
| Uganda | 97.1 /100 | #106 | Exceptional 76.0% |
| Ukraine | 5.1 /100 | #228 | Tragic 74.2% |
| Uruguay | 15.8 /100 | #208 | Poor 74.6% |
| Uzbekistan | 0.0 /100 | #332 | Tragic 70.4% |
| Venezuela | 0.1 /100 | #281 | Tragic 73.2% |
| Vietnam | 25.1 /100 | #196 | Fair 74.7% |
| West Indies | 0.0 /100 | #304 | Tragic 72.4% |
| Western Africa | 56.7 /100 | #168 | Average 75.1% |
| Western Asia | 0.4 /100 | #267 | Tragic 73.5% |
| Western Europe | 71.5 /100 | #157 | Good 75.3% |
| Yemen | 0.0 /100 | #339 | Tragic 68.9% |
| Zaire | 99.6 /100 | #79 | Exceptional 76.6% |
| Zimbabwe | 95.1 /100 | #114 | Exceptional 75.9% |
| Azores | 100.0 /100 | #53 | Exceptional 77.2% |