Tlingit-Haida Disability Age 18 to 34

COMPARE

Tlingit-Haida
Race
Ancestry
AfghanAfricanAlaska NativeAlaskan AthabascanAlbanianAleutAlsatianAmericanApacheArabArapahoArgentineanArmenianAssyrian/Chaldean/SyriacAustralianAustrianBahamianBangladeshiBarbadianBasqueBelgianBelizeanBermudanBhutaneseBlackfeetBolivianBrazilianBritishBritish West IndianBulgarianBurmeseCajunCambodianCanadianCape VerdeanCarpatho RusynCelticCentral AmericanCentral American IndianCherokeeCheyenneChickasawChileanChineseChippewaChoctawColombianColvilleComancheCosta RicanCreeCreekCroatianCrowCubanCypriotCzechCzechoslovakianDanishDelawareDominicanDutchDutch West IndianEastern EuropeanEcuadorianEgyptianEnglishEstonianEthiopianEuropeanFijianFilipinoFinnishFrenchFrench American IndianFrench CanadianGermanGerman RussianGhanaianGreekGuamanian/ChamorroGuatemalanGuyaneseHaitianHmongHonduranHopiHoumaHungarianIcelanderIndian (Asian)IndonesianInupiatIranianIraqiIrishIroquoisIsraeliItalianJamaicanJapaneseJordanianKenyanKiowaKoreanLaotianLatvianLebaneseLiberianLithuanianLumbeeLuxembourgerMacedonianMalaysianMalteseMarshalleseMenomineeMexicanMexican American IndianMongolianMoroccanNative HawaiianNavajoNepaleseNew ZealanderNicaraguanNigerianNorthern EuropeanNorwegianOkinawanOsageOttawaPaiutePakistaniPalestinianPanamanianParaguayanPennsylvania GermanPeruvianPimaPolishPortuguesePotawatomiPuebloPuerto RicanPuget Sound SalishRomanianRussianSalvadoranSamoanScandinavianScotch-IrishScottishSeminoleSenegaleseSerbianShoshoneSierra LeoneanSiouxSlavicSlovakSloveneSomaliSouth AfricanSouth AmericanSouth American IndianSoviet UnionSpaniardSpanishSpanish AmericanSpanish American IndianSri LankanSubsaharan AfricanSudaneseSwedishSwissSyrianTaiwaneseThaiTlingit-HaidaTohono O'OdhamTonganTrinidadian and TobagonianTsimshianTurkishU.S. Virgin IslanderUgandanUkrainianUruguayanUteVenezuelanVietnameseWelshWest IndianYakamaYaquiYugoslavianYumanYup'ikZimbabwean
Immigration
NonimmigrantsImmigrantsAfghanistanAfricaAlbaniaArgentinaArmeniaAsiaAustraliaAustriaBahamasBangladeshBarbadosBelarusBelgiumBelizeBoliviaBosnia and HerzegovinaBrazilBulgariaBurma/MyanmarCabo VerdeCambodiaCameroonCanadaCaribbeanCentral AmericaChileChinaColombiaCongoCosta RicaCroatiaCubaCzechoslovakiaDenmarkDominicaDominican RepublicEastern AfricaEastern AsiaEastern EuropeEcuadorEgyptEl SalvadorEnglandEritreaEthiopiaEuropeFijiFranceGermanyGhanaGreeceGrenadaGuatemalaGuyanaHaitiHondurasHong KongHungaryIndiaIndonesiaIranIraqIrelandIsraelItalyJamaicaJapanJordanKazakhstanKenyaKoreaKuwaitLaosLatin AmericaLatviaLebanonLiberiaLithuaniaMalaysiaMexicoMicronesiaMiddle AfricaMoldovaMoroccoNepalNetherlandsNicaraguaNigeriaNorth AmericaNorth MacedoniaNorthern AfricaNorthern EuropeNorwayOceaniaPakistanPanamaPeruPhilippinesPolandPortugalRomaniaRussiaSaudi ArabiaScotlandSenegalSerbiaSierra LeoneSingaporeSomaliaSouth AfricaSouth AmericaSouth Central AsiaSouth Eastern AsiaSouthern EuropeSpainSri LankaSt. Vincent and the GrenadinesSudanSwedenSwitzerlandSyriaTaiwanThailandTrinidad and TobagoTurkeyUgandaUkraineUruguayUzbekistanVenezuelaVietnamWest IndiesWestern AfricaWestern AsiaWestern EuropeYemenZaireZimbabweAzores
Select to Compare
Race
Ancestry
AfghanAfricanAlaska NativeAlaskan AthabascanAlbanianAleutAlsatianAmericanApacheArabArapahoArgentineanArmenianAssyrian/Chaldean/SyriacAustralianAustrianBahamianBangladeshiBarbadianBasqueBelgianBelizeanBermudanBhutaneseBlackfeetBolivianBrazilianBritishBritish West IndianBulgarianBurmeseCajunCambodianCanadianCape VerdeanCarpatho RusynCelticCentral AmericanCentral American IndianCherokeeCheyenneChickasawChileanChineseChippewaChoctawColombianColvilleComancheCosta RicanCreeCreekCroatianCrowCubanCypriotCzechCzechoslovakianDanishDelawareDominicanDutchDutch West IndianEastern EuropeanEcuadorianEgyptianEnglishEstonianEthiopianEuropeanFijianFilipinoFinnishFrenchFrench American IndianFrench CanadianGermanGerman RussianGhanaianGreekGuamanian/ChamorroGuatemalanGuyaneseHaitianHmongHonduranHopiHoumaHungarianIcelanderIndian (Asian)IndonesianInupiatIranianIraqiIrishIroquoisIsraeliItalianJamaicanJapaneseJordanianKenyanKiowaKoreanLaotianLatvianLebaneseLiberianLithuanianLumbeeLuxembourgerMacedonianMalaysianMalteseMarshalleseMenomineeMexicanMexican American IndianMongolianMoroccanNative HawaiianNavajoNepaleseNew ZealanderNicaraguanNigerianNorthern EuropeanNorwegianOkinawanOsageOttawaPaiutePakistaniPalestinianPanamanianParaguayanPennsylvania GermanPeruvianPimaPolishPortuguesePotawatomiPuebloPuerto RicanPuget Sound SalishRomanianRussianSalvadoranSamoanScandinavianScotch-IrishScottishSeminoleSenegaleseSerbianShoshoneSierra LeoneanSiouxSlavicSlovakSloveneSomaliSouth AfricanSouth AmericanSouth American IndianSoviet UnionSpaniardSpanishSpanish AmericanSpanish American IndianSri LankanSubsaharan AfricanSudaneseSwedishSwissSyrianTaiwaneseThaiTohono O'OdhamTonganTrinidadian and TobagonianTsimshianTurkishU.S. Virgin IslanderUgandanUkrainianUruguayanUteVenezuelanVietnameseWelshWest IndianYakamaYaquiYugoslavianYumanYup'ikZimbabwean
Immigration
NonimmigrantsImmigrantsAfghanistanAfricaAlbaniaArgentinaArmeniaAsiaAustraliaAustriaBahamasBangladeshBarbadosBelarusBelgiumBelizeBoliviaBosnia and HerzegovinaBrazilBulgariaBurma/MyanmarCabo VerdeCambodiaCameroonCanadaCaribbeanCentral AmericaChileChinaColombiaCongoCosta RicaCroatiaCubaCzechoslovakiaDenmarkDominicaDominican RepublicEastern AfricaEastern AsiaEastern EuropeEcuadorEgyptEl SalvadorEnglandEritreaEthiopiaEuropeFijiFranceGermanyGhanaGreeceGrenadaGuatemalaGuyanaHaitiHondurasHong KongHungaryIndiaIndonesiaIranIraqIrelandIsraelItalyJamaicaJapanJordanKazakhstanKenyaKoreaKuwaitLaosLatin AmericaLatviaLebanonLiberiaLithuaniaMalaysiaMexicoMicronesiaMiddle AfricaMoldovaMoroccoNepalNetherlandsNicaraguaNigeriaNorth AmericaNorth MacedoniaNorthern AfricaNorthern EuropeNorwayOceaniaPakistanPanamaPeruPhilippinesPolandPortugalRomaniaRussiaSaudi ArabiaScotlandSenegalSerbiaSierra LeoneSingaporeSomaliaSouth AfricaSouth AmericaSouth Central AsiaSouth Eastern AsiaSouthern EuropeSpainSri LankaSt. Vincent and the GrenadinesSudanSwedenSwitzerlandSyriaTaiwanThailandTrinidad and TobagoTurkeyUgandaUkraineUruguayUzbekistanVenezuelaVietnamWest IndiesWestern AfricaWestern AsiaWestern EuropeYemenZaireZimbabweAzores
Disability Age 18 to 34
Income
Poverty
Unemployment
Labor Participation
Family Structure
Vehicle Availability
Education Level
Disability

Tlingit-Haida Disability Age 18 to 34
Tragic

7.7%
DISABILITY | AGE 18 TO 34
0.0/ 100
METRIC RATING
295th/ 347
METRIC RANK

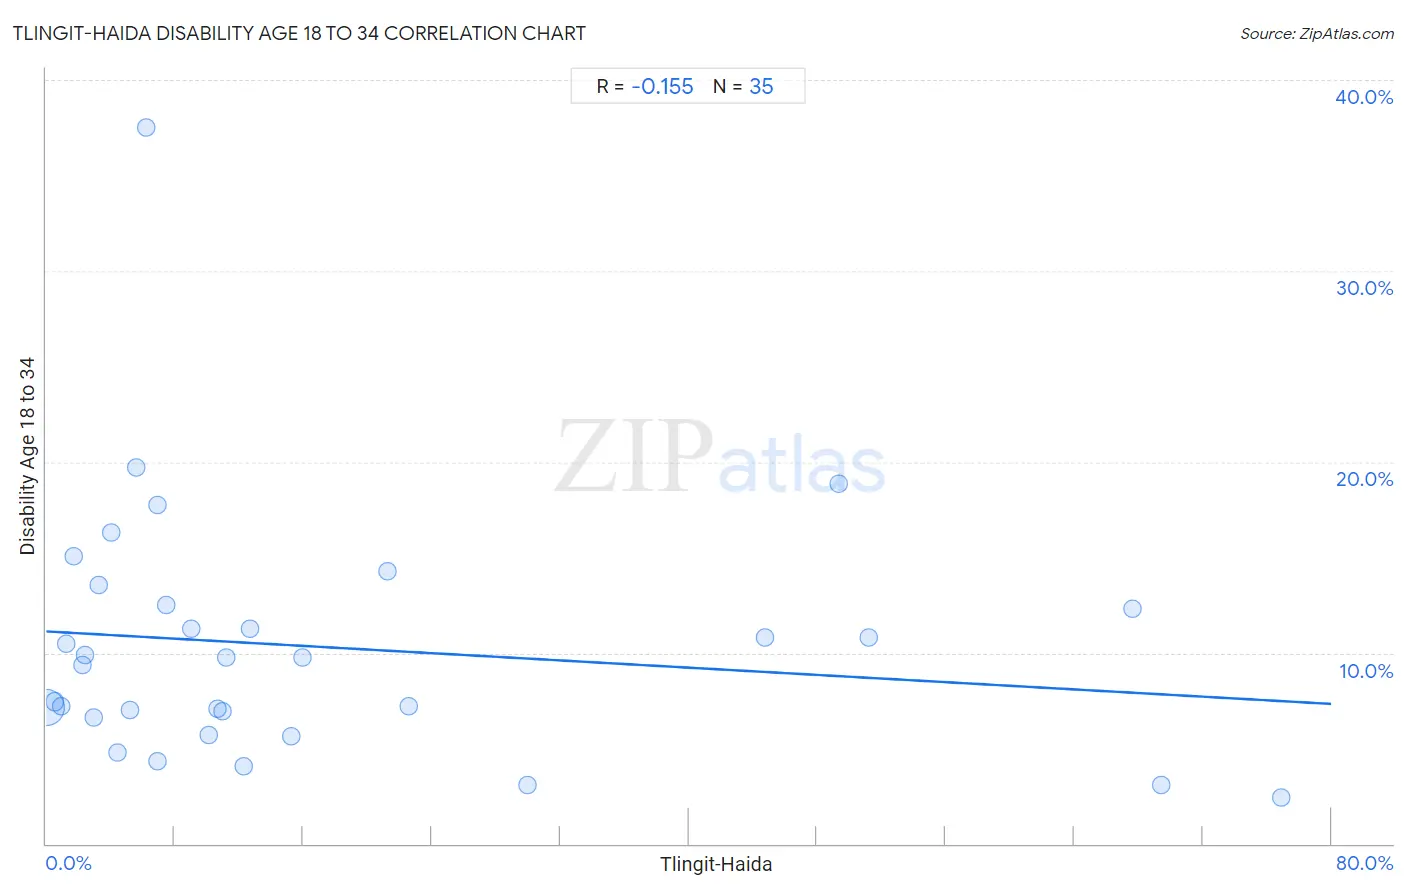
Tlingit-Haida Disability Age 18 to 34 Correlation Chart

The statistical analysis conducted on geographies consisting of 60,778,142 people shows a poor negative correlation between the proportion of Tlingit-Haida and percentage of population with a disability between the ages 18 and 35 in the United States with a correlation coefficient (R) of -0.155 and weighted average of 7.7%. On average, for every 1% (one percent) increase in Tlingit-Haida within a typical geography, there is a decrease of 0.047% in percentage of population with a disability between the ages 18 and 35.
Tlingit-Haida Disability Age 18 to 34
It is essential to understand that the correlation between the percentage of Tlingit-Haida and percentage of population with a disability between the ages 18 and 35 does not imply a direct cause-and-effect relationship. It remains uncertain whether the presence of Tlingit-Haida influences an upward or downward trend in the level of percentage of population with a disability between the ages 18 and 35 within an area, or if Tlingit-Haida simply ended up residing in those areas with higher or lower levels of percentage of population with a disability between the ages 18 and 35 due to other factors.

Demographics Similar to Tlingit-Haida by Disability Age 18 to 34

In terms of disability age 18 to 34, the demographic groups most similar to Tlingit-Haida are Immigrants from Cabo Verde (7.7%, a difference of 0.010%), Scandinavian (7.7%, a difference of 0.16%), Cape Verdean (7.7%, a difference of 0.18%), Pueblo (7.7%, a difference of 0.19%), and Black/African American (7.7%, a difference of 0.22%).
DemographicsRating | RankDisability Age 18 to 34
Whites/Caucasians
0.0
/100
|
#288
Tragic
7.6%
Nonimmigrants
0.0
/100
|
#289
Tragic
7.6%
Slovaks
0.0
/100
|
#290
Tragic
7.7%
Irish
0.0
/100
|
#291
Tragic
7.7%
Blacks/African Americans
0.0
/100
|
#292
Tragic
7.7%
Scandinavians
0.0
/100
|
#293
Tragic
7.7%
Immigrants from Cabo Verde
0.0
/100
|
#294
Tragic
7.7%
Tlingit-Haida
0.0
/100
|
#295
Tragic
7.7%
Cape Verdeans
0.0
/100
|
#296
Tragic
7.7%
Pueblo
0.0
/100
|
#297
Tragic
7.7%
Dutch
0.0
/100
|
#298
Tragic
7.7%
Germans
0.0
/100
|
#299
Tragic
7.7%
Scottish
0.0
/100
|
#300
Tragic
7.7%
Pima
0.0
/100
|
#301
Tragic
7.7%
Welsh
0.0
/100
|
#302
Tragic
7.7%

Tlingit-Haida Disability Age 18 to 34 Correlation Summary

MeasurementTlingit-Haida DataDisability Age 18 to 34 Data
Minimum0.036%2.4%
Maximum76.8%37.5%
Range76.8%35.1%
Mean17.2%10.3%
Median9.0%9.7%
Interquartile 25% (IQ1)3.3%6.6%
Interquartile 75% (IQ3)21.2%12.5%
Interquartile Range (IQR)18.0%5.9%
Standard Deviation (Sample)21.3%6.5%
Standard Deviation (Population)21.0%6.4%

Correlation Details

Tlingit-Haida PercentileSample SizeDisability Age 18 to 34
[
0.0%
-
0.5%
]
0.036%
58,973,7177.1%
[
0.5%
-
1.0%
]
0.54%
1,297,3887.4%
[
0.5%
-
1.0%
]
0.91%
245,4137.2%
[
1.0%
-
1.5%
]
1.23%
80,39710.5%
[
1.5%
-
2.0%
]
1.72%
24,57115.0%
[
2.0%
-
2.5%
]
2.29%
8,2989.3%
[
2.0%
-
2.5%
]
2.44%
2,1289.9%
[
2.5%
-
3.0%
]
2.92%
6,1946.6%
[
3.0%
-
3.5%
]
3.27%
5,87813.6%
[
4.0%
-
4.5%
]
4.04%
54416.3%
[
4.0%
-
4.5%
]
4.41%
684.8%
[
5.0%
-
5.5%
]
5.24%
4207.0%
[
5.5%
-
6.0%
]
5.62%
1,76219.7%
[
6.0%
-
6.5%
]
6.21%
17737.5%
[
6.5%
-
7.0%
]
6.91%
5644.3%
[
6.5%
-
7.0%
]
6.94%
2,14617.7%
[
7.0%
-
7.5%
]
7.50%
4012.5%
[
8.5%
-
9.0%
]
9.00%
6,69111.3%
[
10.0%
-
10.5%
]
10.13%
2,9025.7%
[
10.5%
-
11.0%
]
10.70%
29,9337.1%
[
11.0%
-
11.5%
]
11.00%
32,1086.9%
[
11.0%
-
11.5%
]
11.18%
13,9139.8%
[
12.0%
-
12.5%
]
12.26%
18,0414.0%
[
12.5%
-
13.0%
]
12.67%
8,16811.3%
[
15.0%
-
15.5%
]
15.26%
2,1695.7%
[
15.5%
-
16.0%
]
15.92%
1,7279.7%
[
21.0%
-
21.5%
]
21.23%
4,26714.2%
[
22.5%
-
23.0%
]
22.55%
1,0737.2%
[
29.5%
-
30.0%
]
29.96%
1,1283.1%
[
44.5%
-
45.0%
]
44.78%
92010.8%
[
49.0%
-
49.5%
]
49.33%
1,79218.9%
[
51.0%
-
51.5%
]
51.24%
80410.8%
[
67.5%
-
68.0%
]
67.59%
36112.3%
[
69.0%
-
69.5%
]
69.41%
1,6023.1%
[
76.5%
-
77.0%
]
76.85%
8382.4%