Fijian Disability Age 5 to 17
COMPARE
Fijian
Select to Compare
Disability Age 5 to 17
Fijian Disability Age 5 to 17
5.7%
DISABILITY | AGE 5 TO 17
31.7/ 100
METRIC RATING
186th/ 347
METRIC RANK
Fijian Disability Age 5 to 17 Correlation Chart
The statistical analysis conducted on geographies consisting of 55,882,299 people shows a mild positive correlation between the proportion of Fijians and percentage of population with a disability between the ages 5 and 17 in the United States with a correlation coefficient (R) of 0.324 and weighted average of 5.7%. On average, for every 1% (one percent) increase in Fijians within a typical geography, there is an increase of 0.19% in percentage of population with a disability between the ages 5 and 17.
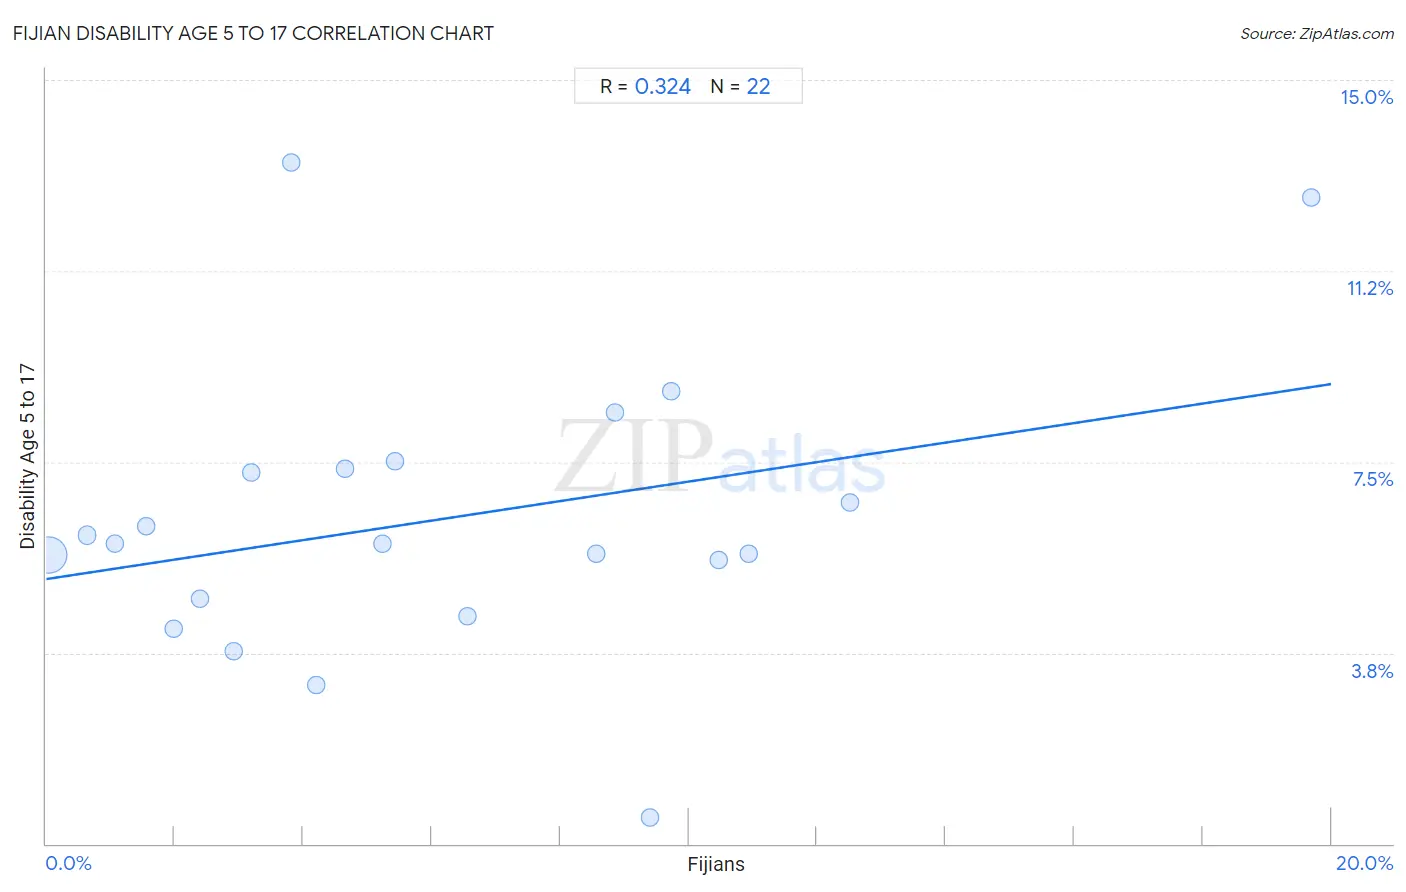
It is essential to understand that the correlation between the percentage of Fijians and percentage of population with a disability between the ages 5 and 17 does not imply a direct cause-and-effect relationship. It remains uncertain whether the presence of Fijians influences an upward or downward trend in the level of percentage of population with a disability between the ages 5 and 17 within an area, or if Fijians simply ended up residing in those areas with higher or lower levels of percentage of population with a disability between the ages 5 and 17 due to other factors.
Demographics Similar to Fijians by Disability Age 5 to 17
In terms of disability age 5 to 17, the demographic groups most similar to Fijians are Immigrants from Thailand (5.7%, a difference of 0.090%), Immigrants from Mexico (5.6%, a difference of 0.11%), Syrian (5.6%, a difference of 0.12%), Immigrants from Latin America (5.6%, a difference of 0.14%), and Mexican American Indian (5.6%, a difference of 0.20%).
| Demographics | Rating | Rank | Disability Age 5 to 17 |
| Immigrants from Barbados | 40.5 /100 | #179 | Average 5.6% |
| Immigrants from Uruguay | 37.7 /100 | #180 | Fair 5.6% |
| Immigrants from England | 36.4 /100 | #181 | Fair 5.6% |
| Mexican American Indians | 35.2 /100 | #182 | Fair 5.6% |
| Immigrants from Latin America | 34.3 /100 | #183 | Fair 5.6% |
| Syrians | 33.8 /100 | #184 | Fair 5.6% |
| Immigrants from Mexico | 33.7 /100 | #185 | Fair 5.6% |
| Fijians | 31.7 /100 | #186 | Fair 5.7% |
| Immigrants from Thailand | 30.2 /100 | #187 | Fair 5.7% |
| Marshallese | 28.1 /100 | #188 | Fair 5.7% |
| Pueblo | 27.5 /100 | #189 | Fair 5.7% |
| Immigrants from Eastern Africa | 27.3 /100 | #190 | Fair 5.7% |
| Danes | 26.5 /100 | #191 | Fair 5.7% |
| Immigrants from Bosnia and Herzegovina | 26.3 /100 | #192 | Fair 5.7% |
| Immigrants from Canada | 26.1 /100 | #193 | Fair 5.7% |
Fijian Disability Age 5 to 17 Correlation Summary
| Measurement | Fijian Data | Disability Age 5 to 17 Data |
| Minimum | 0.040% | 0.51% |
| Maximum | 19.7% | 13.4% |
| Range | 19.7% | 12.9% |
| Mean | 6.1% | 6.4% |
| Median | 4.9% | 5.9% |
| Interquartile 25% (IQ1) | 2.4% | 4.8% |
| Interquartile 75% (IQ3) | 9.4% | 7.4% |
| Interquartile Range (IQR) | 7.0% | 2.6% |
| Standard Deviation (Sample) | 4.8% | 2.8% |
| Standard Deviation (Population) | 4.7% | 2.8% |
Correlation Details
| Fijian Percentile | Sample Size | Disability Age 5 to 17 |
[ 0.0% - 0.5% ] 0.040% | 51,700,067 | 5.7% |
[ 0.5% - 1.0% ] 0.63% | 2,347,517 | 6.1% |
[ 1.0% - 1.5% ] 1.07% | 678,989 | 5.9% |
[ 1.5% - 2.0% ] 1.55% | 348,584 | 6.2% |
[ 1.5% - 2.0% ] 1.98% | 235,220 | 4.2% |
[ 2.0% - 2.5% ] 2.39% | 95,001 | 4.8% |
[ 2.5% - 3.0% ] 2.92% | 148,848 | 3.8% |
[ 3.0% - 3.5% ] 3.20% | 45,426 | 7.3% |
[ 3.5% - 4.0% ] 3.81% | 13,176 | 13.4% |
[ 4.0% - 4.5% ] 4.21% | 31,454 | 3.1% |
[ 4.5% - 5.0% ] 4.65% | 52,781 | 7.4% |
[ 5.0% - 5.5% ] 5.23% | 4,222 | 5.9% |
[ 5.0% - 5.5% ] 5.43% | 774 | 7.5% |
[ 6.5% - 7.0% ] 6.55% | 86,705 | 4.5% |
[ 8.5% - 9.0% ] 8.57% | 58,066 | 5.7% |
[ 8.5% - 9.0% ] 8.84% | 25,892 | 8.5% |
[ 9.0% - 9.5% ] 9.40% | 4,628 | 0.51% |
[ 9.5% - 10.0% ] 9.73% | 401 | 8.9% |
[ 10.0% - 10.5% ] 10.46% | 1,214 | 5.6% |
[ 10.5% - 11.0% ] 10.93% | 1,674 | 5.7% |
[ 12.5% - 13.0% ] 12.52% | 1,462 | 6.7% |
[ 19.5% - 20.0% ] 19.70% | 198 | 12.7% |