Immigrants from Belize Disability Age 5 to 17
COMPARE
Immigrants from Belize
Select to Compare
Disability Age 5 to 17
Immigrants from Belize Disability Age 5 to 17
5.4%
DISABILITY | AGE 5 TO 17
91.7/ 100
METRIC RATING
135th/ 347
METRIC RANK
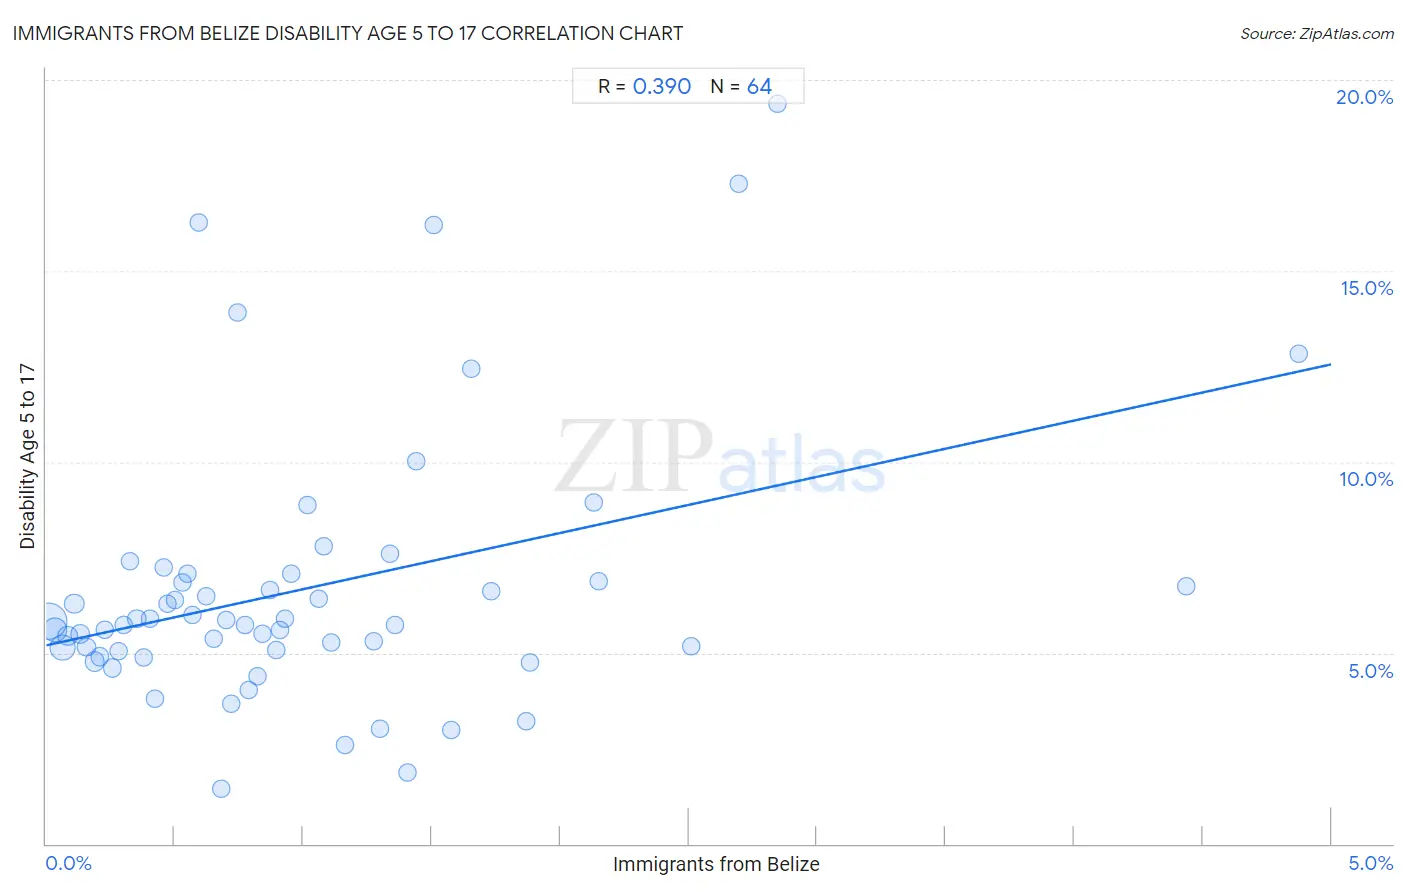
Immigrants from Belize Disability Age 5 to 17 Correlation Chart
The statistical analysis conducted on geographies consisting of 129,905,641 people shows a mild positive correlation between the proportion of Immigrants from Belize and percentage of population with a disability between the ages 5 and 17 in the United States with a correlation coefficient (R) of 0.390 and weighted average of 5.4%. On average, for every 1% (one percent) increase in Immigrants from Belize within a typical geography, there is an increase of 1.5% in percentage of population with a disability between the ages 5 and 17.
It is essential to understand that the correlation between the percentage of Immigrants from Belize and percentage of population with a disability between the ages 5 and 17 does not imply a direct cause-and-effect relationship. It remains uncertain whether the presence of Immigrants from Belize influences an upward or downward trend in the level of percentage of population with a disability between the ages 5 and 17 within an area, or if Immigrants from Belize simply ended up residing in those areas with higher or lower levels of percentage of population with a disability between the ages 5 and 17 due to other factors.
Demographics Similar to Immigrants from Belize by Disability Age 5 to 17
In terms of disability age 5 to 17, the demographic groups most similar to Immigrants from Belize are Immigrants from Denmark (5.4%, a difference of 0.050%), Yuman (5.4%, a difference of 0.10%), Navajo (5.4%, a difference of 0.13%), Immigrants from Oceania (5.4%, a difference of 0.14%), and Belizean (5.4%, a difference of 0.14%).
| Demographics | Rating | Rank | Disability Age 5 to 17 |
| Immigrants from Venezuela | 94.5 /100 | #128 | Exceptional 5.4% |
| Romanians | 94.1 /100 | #129 | Exceptional 5.4% |
| Immigrants from Bulgaria | 94.0 /100 | #130 | Exceptional 5.4% |
| Arabs | 92.9 /100 | #131 | Exceptional 5.4% |
| Immigrants from Colombia | 92.9 /100 | #132 | Exceptional 5.4% |
| Venezuelans | 92.7 /100 | #133 | Exceptional 5.4% |
| Yuman | 92.3 /100 | #134 | Exceptional 5.4% |
| Immigrants from Belize | 91.7 /100 | #135 | Exceptional 5.4% |
| Immigrants from Denmark | 91.4 /100 | #136 | Exceptional 5.4% |
| Navajo | 90.9 /100 | #137 | Exceptional 5.4% |
| Immigrants from Oceania | 90.8 /100 | #138 | Exceptional 5.4% |
| Belizeans | 90.8 /100 | #139 | Exceptional 5.4% |
| Immigrants from Netherlands | 90.5 /100 | #140 | Exceptional 5.4% |
| South American Indians | 89.3 /100 | #141 | Excellent 5.5% |
| Colombians | 88.0 /100 | #142 | Excellent 5.5% |
Immigrants from Belize Disability Age 5 to 17 Correlation Summary
| Measurement | Immigrants from Belize Data | Disability Age 5 to 17 Data |
| Minimum | 0.011% | 1.4% |
| Maximum | 4.9% | 19.4% |
| Range | 4.9% | 17.9% |
| Mean | 1.0% | 6.7% |
| Median | 0.78% | 5.8% |
| Interquartile 25% (IQ1) | 0.39% | 5.1% |
| Interquartile 75% (IQ3) | 1.3% | 7.0% |
| Interquartile Range (IQR) | 0.96% | 1.9% |
| Standard Deviation (Sample) | 0.94% | 3.5% |
| Standard Deviation (Population) | 0.93% | 3.5% |
Correlation Details
| Immigrants from Belize Percentile | Sample Size | Disability Age 5 to 17 |
[ 0.0% - 0.5% ] 0.011% | 58,237,964 | 5.8% |
[ 0.0% - 0.5% ] 0.035% | 20,374,692 | 5.6% |
[ 0.0% - 0.5% ] 0.065% | 22,673,566 | 5.1% |
[ 0.0% - 0.5% ] 0.083% | 6,269,000 | 5.4% |
[ 0.0% - 0.5% ] 0.11% | 4,492,629 | 6.3% |
[ 0.0% - 0.5% ] 0.13% | 2,559,609 | 5.5% |
[ 0.0% - 0.5% ] 0.16% | 2,146,825 | 5.1% |
[ 0.0% - 0.5% ] 0.19% | 5,774,678 | 4.8% |
[ 0.0% - 0.5% ] 0.21% | 924,855 | 4.9% |
[ 0.0% - 0.5% ] 0.23% | 1,445,325 | 5.6% |
[ 0.0% - 0.5% ] 0.26% | 762,709 | 4.6% |
[ 0.0% - 0.5% ] 0.28% | 572,760 | 5.1% |
[ 0.0% - 0.5% ] 0.30% | 323,635 | 5.7% |
[ 0.0% - 0.5% ] 0.33% | 200,259 | 7.4% |
[ 0.0% - 0.5% ] 0.35% | 319,338 | 5.9% |
[ 0.0% - 0.5% ] 0.38% | 282,813 | 4.9% |
[ 0.0% - 0.5% ] 0.40% | 168,065 | 5.9% |
[ 0.0% - 0.5% ] 0.42% | 220,001 | 3.8% |
[ 0.0% - 0.5% ] 0.46% | 204,607 | 7.2% |
[ 0.0% - 0.5% ] 0.47% | 18,260 | 6.3% |
[ 0.0% - 0.5% ] 0.50% | 140,660 | 6.4% |
[ 0.5% - 1.0% ] 0.53% | 124,315 | 6.8% |
[ 0.5% - 1.0% ] 0.55% | 137,330 | 7.1% |
[ 0.5% - 1.0% ] 0.57% | 141,791 | 6.0% |
[ 0.5% - 1.0% ] 0.60% | 1,176 | 16.3% |
[ 0.5% - 1.0% ] 0.62% | 165,594 | 6.5% |
[ 0.5% - 1.0% ] 0.65% | 93,547 | 5.4% |
[ 0.5% - 1.0% ] 0.68% | 2,204 | 1.4% |
[ 0.5% - 1.0% ] 0.70% | 27,353 | 5.9% |
[ 0.5% - 1.0% ] 0.72% | 56,498 | 3.7% |
[ 0.5% - 1.0% ] 0.74% | 29,009 | 13.9% |
[ 0.5% - 1.0% ] 0.77% | 42,343 | 5.7% |
[ 0.5% - 1.0% ] 0.79% | 59,697 | 4.0% |
[ 0.5% - 1.0% ] 0.82% | 75,024 | 4.4% |
[ 0.5% - 1.0% ] 0.84% | 89,435 | 5.5% |
[ 0.5% - 1.0% ] 0.87% | 11,824 | 6.6% |
[ 0.5% - 1.0% ] 0.89% | 117,043 | 5.1% |
[ 0.5% - 1.0% ] 0.91% | 66,333 | 5.6% |
[ 0.5% - 1.0% ] 0.93% | 42,990 | 5.9% |
[ 0.5% - 1.0% ] 0.95% | 5,765 | 7.1% |
[ 1.0% - 1.5% ] 1.02% | 1,278 | 8.9% |
[ 1.0% - 1.5% ] 1.06% | 110,279 | 6.4% |
[ 1.0% - 1.5% ] 1.08% | 4,807 | 7.8% |
[ 1.0% - 1.5% ] 1.11% | 69,064 | 5.3% |
[ 1.0% - 1.5% ] 1.16% | 47,309 | 2.6% |
[ 1.0% - 1.5% ] 1.27% | 13,022 | 5.3% |
[ 1.0% - 1.5% ] 1.30% | 13,698 | 3.0% |
[ 1.0% - 1.5% ] 1.34% | 13,456 | 7.6% |
[ 1.0% - 1.5% ] 1.36% | 15,380 | 5.7% |
[ 1.0% - 1.5% ] 1.41% | 11,453 | 1.9% |
[ 1.0% - 1.5% ] 1.44% | 14,679 | 10.0% |
[ 1.5% - 2.0% ] 1.51% | 861 | 16.2% |
[ 1.5% - 2.0% ] 1.58% | 49,898 | 3.0% |
[ 1.5% - 2.0% ] 1.65% | 15,132 | 12.4% |
[ 1.5% - 2.0% ] 1.73% | 29,307 | 6.6% |
[ 1.5% - 2.0% ] 1.87% | 44,461 | 3.2% |
[ 1.5% - 2.0% ] 1.88% | 1,489 | 4.8% |
[ 2.0% - 2.5% ] 2.13% | 2,582 | 8.9% |
[ 2.0% - 2.5% ] 2.15% | 8,134 | 6.9% |
[ 2.5% - 3.0% ] 2.51% | 33,528 | 5.2% |
[ 2.5% - 3.0% ] 2.70% | 408 | 17.3% |
[ 2.5% - 3.0% ] 2.85% | 1,932 | 19.4% |
[ 4.0% - 4.5% ] 4.44% | 834 | 6.7% |
[ 4.5% - 5.0% ] 4.87% | 1,129 | 12.8% |