Immigrants from Eritrea Disability Age 5 to 17
COMPARE
Immigrants from Eritrea
Select to Compare
Disability Age 5 to 17
Immigrants from Eritrea Disability Age 5 to 17
5.3%
DISABILITY | AGE 5 TO 17
98.0/ 100
METRIC RATING
110th/ 347
METRIC RANK
Immigrants from Eritrea Disability Age 5 to 17 Correlation Chart
The statistical analysis conducted on geographies consisting of 104,672,800 people shows a mild positive correlation between the proportion of Immigrants from Eritrea and percentage of population with a disability between the ages 5 and 17 in the United States with a correlation coefficient (R) of 0.332 and weighted average of 5.3%. On average, for every 1% (one percent) increase in Immigrants from Eritrea within a typical geography, there is an increase of 0.51% in percentage of population with a disability between the ages 5 and 17.
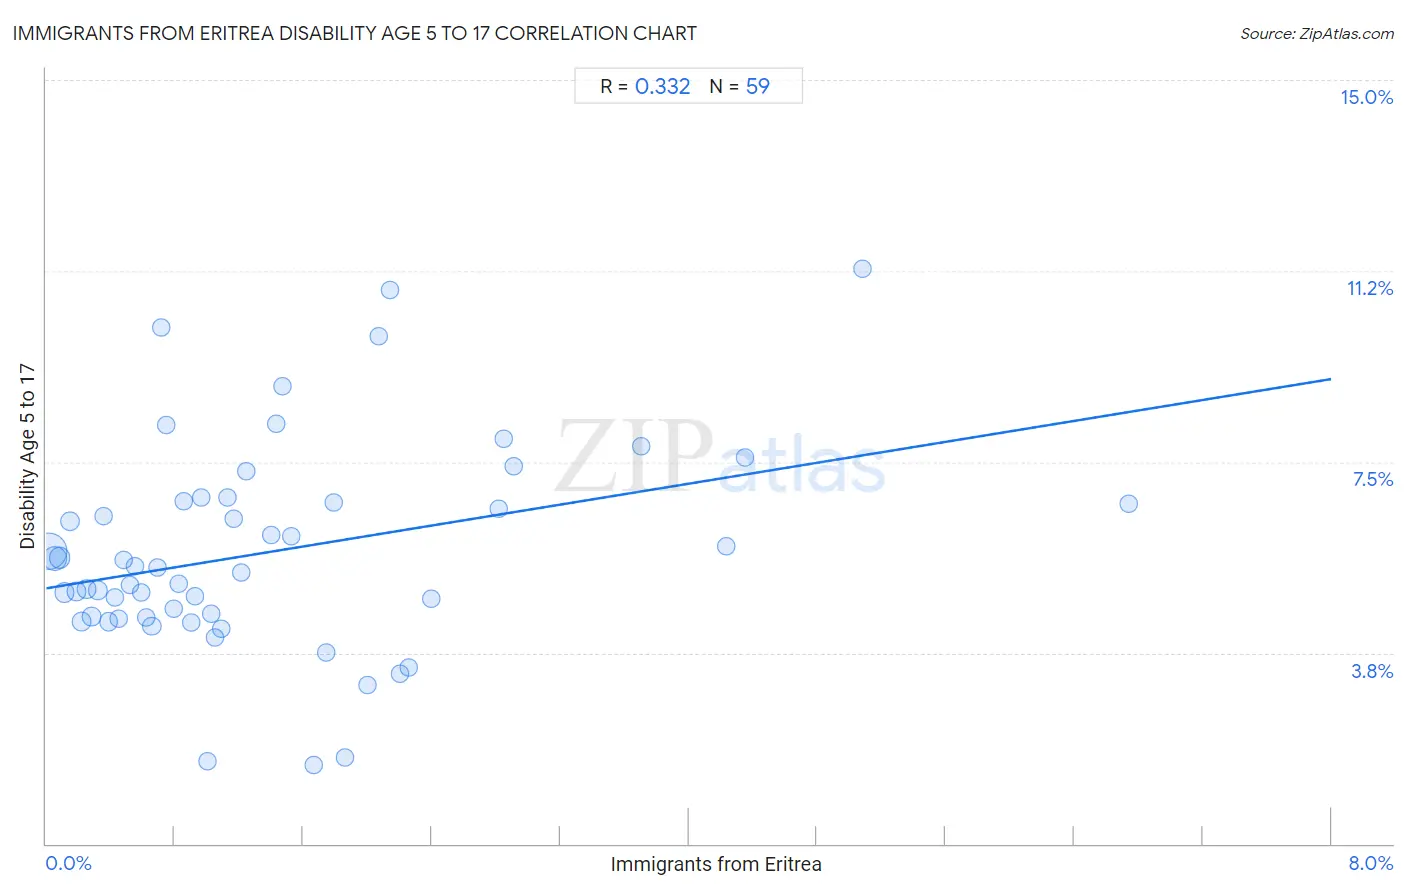
It is essential to understand that the correlation between the percentage of Immigrants from Eritrea and percentage of population with a disability between the ages 5 and 17 does not imply a direct cause-and-effect relationship. It remains uncertain whether the presence of Immigrants from Eritrea influences an upward or downward trend in the level of percentage of population with a disability between the ages 5 and 17 within an area, or if Immigrants from Eritrea simply ended up residing in those areas with higher or lower levels of percentage of population with a disability between the ages 5 and 17 due to other factors.
Demographics Similar to Immigrants from Eritrea by Disability Age 5 to 17
In terms of disability age 5 to 17, the demographic groups most similar to Immigrants from Eritrea are Immigrants from Northern Africa (5.3%, a difference of 0.040%), Ethiopian (5.3%, a difference of 0.040%), Immigrants from Latvia (5.3%, a difference of 0.050%), Immigrants from South Africa (5.3%, a difference of 0.080%), and Aleut (5.3%, a difference of 0.10%).
| Demographics | Rating | Rank | Disability Age 5 to 17 |
| Salvadorans | 98.6 /100 | #103 | Exceptional 5.3% |
| Peruvians | 98.5 /100 | #104 | Exceptional 5.3% |
| Immigrants from Italy | 98.4 /100 | #105 | Exceptional 5.3% |
| Immigrants from Yemen | 98.2 /100 | #106 | Exceptional 5.3% |
| Russians | 98.2 /100 | #107 | Exceptional 5.3% |
| Immigrants from South Africa | 98.1 /100 | #108 | Exceptional 5.3% |
| Immigrants from Northern Africa | 98.1 /100 | #109 | Exceptional 5.3% |
| Immigrants from Eritrea | 98.0 /100 | #110 | Exceptional 5.3% |
| Ethiopians | 97.9 /100 | #111 | Exceptional 5.3% |
| Immigrants from Latvia | 97.9 /100 | #112 | Exceptional 5.3% |
| Aleuts | 97.8 /100 | #113 | Exceptional 5.3% |
| Immigrants from Northern Europe | 97.8 /100 | #114 | Exceptional 5.3% |
| Cubans | 97.8 /100 | #115 | Exceptional 5.3% |
| Cypriots | 97.7 /100 | #116 | Exceptional 5.3% |
| Immigrants from Afghanistan | 97.4 /100 | #117 | Exceptional 5.3% |
Immigrants from Eritrea Disability Age 5 to 17 Correlation Summary
| Measurement | Immigrants from Eritrea Data | Disability Age 5 to 17 Data |
| Minimum | 0.014% | 1.5% |
| Maximum | 6.7% | 11.3% |
| Range | 6.7% | 9.8% |
| Mean | 1.4% | 5.7% |
| Median | 1.0% | 5.4% |
| Interquartile 25% (IQ1) | 0.49% | 4.4% |
| Interquartile 75% (IQ3) | 1.9% | 6.7% |
| Interquartile Range (IQR) | 1.4% | 2.3% |
| Standard Deviation (Sample) | 1.3% | 2.0% |
| Standard Deviation (Population) | 1.3% | 2.0% |
Correlation Details
| Immigrants from Eritrea Percentile | Sample Size | Disability Age 5 to 17 |
[ 0.0% - 0.5% ] 0.014% | 52,579,921 | 5.7% |
[ 0.0% - 0.5% ] 0.051% | 18,835,045 | 5.6% |
[ 0.0% - 0.5% ] 0.082% | 8,972,168 | 5.6% |
[ 0.0% - 0.5% ] 0.11% | 6,709,089 | 4.9% |
[ 0.0% - 0.5% ] 0.15% | 3,412,600 | 6.3% |
[ 0.0% - 0.5% ] 0.19% | 2,230,578 | 5.0% |
[ 0.0% - 0.5% ] 0.22% | 1,655,310 | 4.4% |
[ 0.0% - 0.5% ] 0.25% | 1,583,610 | 5.0% |
[ 0.0% - 0.5% ] 0.28% | 1,479,863 | 4.5% |
[ 0.0% - 0.5% ] 0.32% | 1,495,513 | 5.0% |
[ 0.0% - 0.5% ] 0.36% | 756,904 | 6.4% |
[ 0.0% - 0.5% ] 0.39% | 960,327 | 4.4% |
[ 0.0% - 0.5% ] 0.43% | 544,199 | 4.8% |
[ 0.0% - 0.5% ] 0.45% | 334,699 | 4.4% |
[ 0.0% - 0.5% ] 0.49% | 368,845 | 5.6% |
[ 0.5% - 1.0% ] 0.52% | 172,424 | 5.1% |
[ 0.5% - 1.0% ] 0.55% | 377,815 | 5.5% |
[ 0.5% - 1.0% ] 0.59% | 213,380 | 4.9% |
[ 0.5% - 1.0% ] 0.62% | 192,670 | 4.4% |
[ 0.5% - 1.0% ] 0.66% | 225,083 | 4.3% |
[ 0.5% - 1.0% ] 0.69% | 76,587 | 5.4% |
[ 0.5% - 1.0% ] 0.72% | 33,539 | 10.1% |
[ 0.5% - 1.0% ] 0.74% | 20,314 | 8.2% |
[ 0.5% - 1.0% ] 0.79% | 159,240 | 4.6% |
[ 0.5% - 1.0% ] 0.83% | 163,170 | 5.1% |
[ 0.5% - 1.0% ] 0.85% | 49,410 | 6.7% |
[ 0.5% - 1.0% ] 0.90% | 39,746 | 4.3% |
[ 0.5% - 1.0% ] 0.92% | 101,950 | 4.9% |
[ 0.5% - 1.0% ] 0.96% | 58,673 | 6.8% |
[ 1.0% - 1.5% ] 1.00% | 36,412 | 1.6% |
[ 1.0% - 1.5% ] 1.03% | 65,994 | 4.5% |
[ 1.0% - 1.5% ] 1.05% | 112,860 | 4.1% |
[ 1.0% - 1.5% ] 1.09% | 38,594 | 4.2% |
[ 1.0% - 1.5% ] 1.13% | 95,331 | 6.8% |
[ 1.0% - 1.5% ] 1.17% | 64,577 | 6.4% |
[ 1.0% - 1.5% ] 1.22% | 35,785 | 5.3% |
[ 1.0% - 1.5% ] 1.25% | 30,788 | 7.3% |
[ 1.0% - 1.5% ] 1.40% | 42,594 | 6.1% |
[ 1.0% - 1.5% ] 1.43% | 69,203 | 8.3% |
[ 1.0% - 1.5% ] 1.47% | 20,996 | 9.0% |
[ 1.5% - 2.0% ] 1.52% | 12,080 | 6.0% |
[ 1.5% - 2.0% ] 1.67% | 8,341 | 1.5% |
[ 1.5% - 2.0% ] 1.74% | 18,228 | 3.8% |
[ 1.5% - 2.0% ] 1.79% | 4,302 | 6.7% |
[ 1.5% - 2.0% ] 1.86% | 1,936 | 1.7% |
[ 2.0% - 2.5% ] 2.00% | 52,360 | 3.1% |
[ 2.0% - 2.5% ] 2.07% | 12,774 | 10.0% |
[ 2.0% - 2.5% ] 2.14% | 2,568 | 10.9% |
[ 2.0% - 2.5% ] 2.20% | 9,952 | 3.3% |
[ 2.0% - 2.5% ] 2.26% | 38,624 | 3.5% |
[ 2.0% - 2.5% ] 2.40% | 1,001 | 4.8% |
[ 2.5% - 3.0% ] 2.82% | 852 | 6.6% |
[ 2.5% - 3.0% ] 2.85% | 37,898 | 7.9% |
[ 2.5% - 3.0% ] 2.91% | 30,259 | 7.4% |
[ 3.5% - 4.0% ] 3.70% | 4,809 | 7.8% |
[ 4.0% - 4.5% ] 4.23% | 14,553 | 5.8% |
[ 4.0% - 4.5% ] 4.35% | 1,425 | 7.6% |
[ 5.0% - 5.5% ] 5.08% | 3,147 | 11.3% |
[ 6.5% - 7.0% ] 6.74% | 1,885 | 6.7% |