Immigrants from Eastern Africa Disability Age 5 to 17
COMPARE
Immigrants from Eastern Africa
Select to Compare
Disability Age 5 to 17
Immigrants from Eastern Africa Disability Age 5 to 17
5.7%
DISABILITY | AGE 5 TO 17
27.3/ 100
METRIC RATING
190th/ 347
METRIC RANK
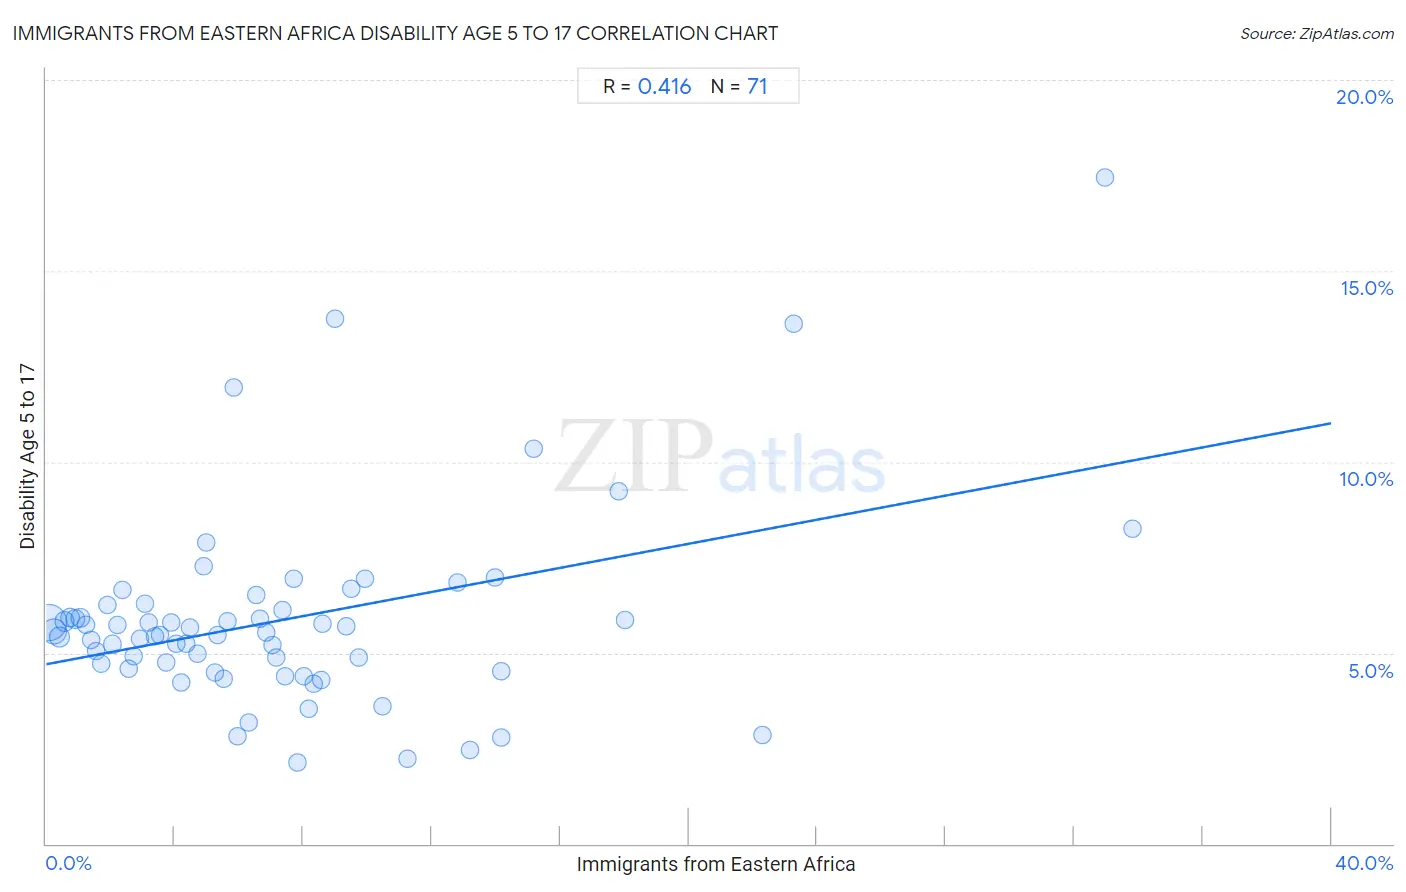
Immigrants from Eastern Africa Disability Age 5 to 17 Correlation Chart
The statistical analysis conducted on geographies consisting of 352,956,874 people shows a moderate positive correlation between the proportion of Immigrants from Eastern Africa and percentage of population with a disability between the ages 5 and 17 in the United States with a correlation coefficient (R) of 0.416 and weighted average of 5.7%. On average, for every 1% (one percent) increase in Immigrants from Eastern Africa within a typical geography, there is an increase of 0.16% in percentage of population with a disability between the ages 5 and 17.
It is essential to understand that the correlation between the percentage of Immigrants from Eastern Africa and percentage of population with a disability between the ages 5 and 17 does not imply a direct cause-and-effect relationship. It remains uncertain whether the presence of Immigrants from Eastern Africa influences an upward or downward trend in the level of percentage of population with a disability between the ages 5 and 17 within an area, or if Immigrants from Eastern Africa simply ended up residing in those areas with higher or lower levels of percentage of population with a disability between the ages 5 and 17 due to other factors.
Demographics Similar to Immigrants from Eastern Africa by Disability Age 5 to 17
In terms of disability age 5 to 17, the demographic groups most similar to Immigrants from Eastern Africa are Pueblo (5.7%, a difference of 0.010%), Marshallese (5.7%, a difference of 0.050%), Danish (5.7%, a difference of 0.050%), Immigrants from Bosnia and Herzegovina (5.7%, a difference of 0.060%), and Immigrants from Canada (5.7%, a difference of 0.080%).
| Demographics | Rating | Rank | Disability Age 5 to 17 |
| Immigrants from Latin America | 34.3 /100 | #183 | Fair 5.6% |
| Syrians | 33.8 /100 | #184 | Fair 5.6% |
| Immigrants from Mexico | 33.7 /100 | #185 | Fair 5.6% |
| Fijians | 31.7 /100 | #186 | Fair 5.7% |
| Immigrants from Thailand | 30.2 /100 | #187 | Fair 5.7% |
| Marshallese | 28.1 /100 | #188 | Fair 5.7% |
| Pueblo | 27.5 /100 | #189 | Fair 5.7% |
| Immigrants from Eastern Africa | 27.3 /100 | #190 | Fair 5.7% |
| Danes | 26.5 /100 | #191 | Fair 5.7% |
| Immigrants from Bosnia and Herzegovina | 26.3 /100 | #192 | Fair 5.7% |
| Immigrants from Canada | 26.1 /100 | #193 | Fair 5.7% |
| Croatians | 23.6 /100 | #194 | Fair 5.7% |
| Immigrants from Nigeria | 23.4 /100 | #195 | Fair 5.7% |
| Inupiat | 23.3 /100 | #196 | Fair 5.7% |
| Immigrants from North America | 23.1 /100 | #197 | Fair 5.7% |
Immigrants from Eastern Africa Disability Age 5 to 17 Correlation Summary
| Measurement | Immigrants from Eastern Africa Data | Disability Age 5 to 17 Data |
| Minimum | 0.073% | 2.1% |
| Maximum | 33.8% | 17.5% |
| Range | 33.7% | 15.3% |
| Mean | 7.4% | 5.9% |
| Median | 5.8% | 5.5% |
| Interquartile 25% (IQ1) | 2.9% | 4.6% |
| Interquartile 75% (IQ3) | 9.3% | 6.2% |
| Interquartile Range (IQR) | 6.4% | 1.7% |
| Standard Deviation (Sample) | 6.7% | 2.6% |
| Standard Deviation (Population) | 6.7% | 2.5% |
Correlation Details
| Immigrants from Eastern Africa Percentile | Sample Size | Disability Age 5 to 17 |
[ 0.0% - 0.5% ] 0.073% | 180,714,927 | 5.8% |
[ 0.0% - 0.5% ] 0.23% | 69,454,066 | 5.6% |
[ 0.0% - 0.5% ] 0.41% | 33,690,485 | 5.4% |
[ 0.5% - 1.0% ] 0.57% | 20,579,354 | 5.8% |
[ 0.5% - 1.0% ] 0.74% | 11,120,265 | 5.9% |
[ 0.5% - 1.0% ] 0.90% | 6,729,867 | 5.9% |
[ 1.0% - 1.5% ] 1.06% | 5,250,038 | 5.9% |
[ 1.0% - 1.5% ] 1.24% | 4,406,261 | 5.7% |
[ 1.0% - 1.5% ] 1.39% | 2,016,084 | 5.3% |
[ 1.5% - 2.0% ] 1.56% | 3,385,438 | 5.1% |
[ 1.5% - 2.0% ] 1.72% | 1,487,166 | 4.7% |
[ 1.5% - 2.0% ] 1.91% | 964,209 | 6.2% |
[ 2.0% - 2.5% ] 2.06% | 1,433,289 | 5.2% |
[ 2.0% - 2.5% ] 2.22% | 1,484,869 | 5.7% |
[ 2.0% - 2.5% ] 2.37% | 1,661,766 | 6.7% |
[ 2.5% - 3.0% ] 2.56% | 631,845 | 4.6% |
[ 2.5% - 3.0% ] 2.71% | 667,363 | 4.9% |
[ 2.5% - 3.0% ] 2.92% | 696,399 | 5.4% |
[ 3.0% - 3.5% ] 3.06% | 669,001 | 6.3% |
[ 3.0% - 3.5% ] 3.20% | 260,425 | 5.8% |
[ 3.0% - 3.5% ] 3.40% | 442,835 | 5.4% |
[ 3.5% - 4.0% ] 3.55% | 553,431 | 5.5% |
[ 3.5% - 4.0% ] 3.72% | 781,863 | 4.8% |
[ 3.5% - 4.0% ] 3.88% | 266,089 | 5.8% |
[ 4.0% - 4.5% ] 4.06% | 186,645 | 5.2% |
[ 4.0% - 4.5% ] 4.19% | 35,531 | 4.2% |
[ 4.0% - 4.5% ] 4.35% | 145,660 | 5.2% |
[ 4.0% - 4.5% ] 4.48% | 309,518 | 5.7% |
[ 4.5% - 5.0% ] 4.71% | 372,083 | 5.0% |
[ 4.5% - 5.0% ] 4.90% | 583,075 | 7.3% |
[ 4.5% - 5.0% ] 4.99% | 146,510 | 7.9% |
[ 5.0% - 5.5% ] 5.27% | 20,037 | 4.5% |
[ 5.0% - 5.5% ] 5.34% | 146,778 | 5.5% |
[ 5.5% - 6.0% ] 5.51% | 148,287 | 4.3% |
[ 5.5% - 6.0% ] 5.66% | 60,781 | 5.8% |
[ 5.5% - 6.0% ] 5.82% | 8,232 | 11.9% |
[ 5.5% - 6.0% ] 5.97% | 32,524 | 2.8% |
[ 6.0% - 6.5% ] 6.31% | 44,512 | 3.2% |
[ 6.5% - 7.0% ] 6.52% | 141,127 | 6.5% |
[ 6.5% - 7.0% ] 6.67% | 167,562 | 5.9% |
[ 6.5% - 7.0% ] 6.87% | 113,837 | 5.5% |
[ 7.0% - 7.5% ] 7.04% | 81,317 | 5.2% |
[ 7.0% - 7.5% ] 7.16% | 40,566 | 4.9% |
[ 7.0% - 7.5% ] 7.35% | 75,527 | 6.1% |
[ 7.0% - 7.5% ] 7.44% | 112,595 | 4.4% |
[ 7.5% - 8.0% ] 7.71% | 120,966 | 6.9% |
[ 7.5% - 8.0% ] 7.84% | 14,521 | 2.1% |
[ 8.0% - 8.5% ] 8.01% | 73,858 | 4.4% |
[ 8.0% - 8.5% ] 8.18% | 20,561 | 3.5% |
[ 8.0% - 8.5% ] 8.33% | 19,531 | 4.2% |
[ 8.5% - 9.0% ] 8.56% | 25,823 | 4.3% |
[ 8.5% - 9.0% ] 8.62% | 86,918 | 5.8% |
[ 8.5% - 9.0% ] 8.97% | 535 | 13.8% |
[ 9.0% - 9.5% ] 9.33% | 24,308 | 5.7% |
[ 9.0% - 9.5% ] 9.48% | 42,084 | 6.7% |
[ 9.5% - 10.0% ] 9.74% | 6,497 | 4.9% |
[ 9.5% - 10.0% ] 9.92% | 30,625 | 6.9% |
[ 10.0% - 10.5% ] 10.45% | 3,914 | 3.6% |
[ 11.0% - 11.5% ] 11.23% | 4,346 | 2.2% |
[ 12.5% - 13.0% ] 12.79% | 30,927 | 6.8% |
[ 13.0% - 13.5% ] 13.17% | 8,290 | 2.5% |
[ 13.5% - 14.0% ] 13.95% | 28,172 | 7.0% |
[ 14.0% - 14.5% ] 14.17% | 27,523 | 4.5% |
[ 14.0% - 14.5% ] 14.18% | 7,703 | 2.8% |
[ 15.0% - 15.5% ] 15.16% | 3,693 | 10.3% |
[ 17.5% - 18.0% ] 17.82% | 26,684 | 9.2% |
[ 18.0% - 18.5% ] 18.03% | 14,553 | 5.8% |
[ 22.0% - 22.5% ] 22.30% | 1,157 | 2.8% |
[ 23.0% - 23.5% ] 23.25% | 4,572 | 13.6% |
[ 32.5% - 33.0% ] 32.97% | 182 | 17.5% |
[ 33.5% - 34.0% ] 33.82% | 8,892 | 8.2% |