Immigrants from Ecuador Disability Age 5 to 17

COMPARE

Immigrants from Ecuador
Race
Ancestry
AfghanAfricanAlaska NativeAlaskan AthabascanAlbanianAleutAlsatianAmericanApacheArabArapahoArgentineanArmenianAssyrian/Chaldean/SyriacAustralianAustrianBahamianBangladeshiBarbadianBasqueBelgianBelizeanBermudanBhutaneseBlackfeetBolivianBrazilianBritishBritish West IndianBulgarianBurmeseCajunCambodianCanadianCape VerdeanCarpatho RusynCelticCentral AmericanCentral American IndianCherokeeCheyenneChickasawChileanChineseChippewaChoctawColombianColvilleComancheCosta RicanCreeCreekCroatianCrowCubanCypriotCzechCzechoslovakianDanishDelawareDominicanDutchDutch West IndianEastern EuropeanEcuadorianEgyptianEnglishEstonianEthiopianEuropeanFijianFilipinoFinnishFrenchFrench American IndianFrench CanadianGermanGerman RussianGhanaianGreekGuamanian/ChamorroGuatemalanGuyaneseHaitianHmongHonduranHopiHoumaHungarianIcelanderIndian (Asian)IndonesianInupiatIranianIraqiIrishIroquoisIsraeliItalianJamaicanJapaneseJordanianKenyanKiowaKoreanLaotianLatvianLebaneseLiberianLithuanianLumbeeLuxembourgerMacedonianMalaysianMalteseMarshalleseMenomineeMexicanMexican American IndianMongolianMoroccanNative HawaiianNavajoNepaleseNew ZealanderNicaraguanNigerianNorthern EuropeanNorwegianOkinawanOsageOttawaPaiutePakistaniPalestinianPanamanianParaguayanPennsylvania GermanPeruvianPimaPolishPortuguesePotawatomiPuebloPuerto RicanPuget Sound SalishRomanianRussianSalvadoranSamoanScandinavianScotch-IrishScottishSeminoleSenegaleseSerbianShoshoneSierra LeoneanSiouxSlavicSlovakSloveneSomaliSouth AfricanSouth AmericanSouth American IndianSoviet UnionSpaniardSpanishSpanish AmericanSpanish American IndianSri LankanSubsaharan AfricanSudaneseSwedishSwissSyrianTaiwaneseThaiTlingit-HaidaTohono O'OdhamTonganTrinidadian and TobagonianTsimshianTurkishU.S. Virgin IslanderUgandanUkrainianUruguayanUteVenezuelanVietnameseWelshWest IndianYakamaYaquiYugoslavianYumanYup'ikZimbabwean
Immigration
NonimmigrantsImmigrantsAfghanistanAfricaAlbaniaArgentinaArmeniaAsiaAustraliaAustriaBahamasBangladeshBarbadosBelarusBelgiumBelizeBoliviaBosnia and HerzegovinaBrazilBulgariaBurma/MyanmarCabo VerdeCambodiaCameroonCanadaCaribbeanCentral AmericaChileChinaColombiaCongoCosta RicaCroatiaCubaCzechoslovakiaDenmarkDominicaDominican RepublicEastern AfricaEastern AsiaEastern EuropeEcuadorEgyptEl SalvadorEnglandEritreaEthiopiaEuropeFijiFranceGermanyGhanaGreeceGrenadaGuatemalaGuyanaHaitiHondurasHong KongHungaryIndiaIndonesiaIranIraqIrelandIsraelItalyJamaicaJapanJordanKazakhstanKenyaKoreaKuwaitLaosLatin AmericaLatviaLebanonLiberiaLithuaniaMalaysiaMexicoMicronesiaMiddle AfricaMoldovaMoroccoNepalNetherlandsNicaraguaNigeriaNorth AmericaNorth MacedoniaNorthern AfricaNorthern EuropeNorwayOceaniaPakistanPanamaPeruPhilippinesPolandPortugalRomaniaRussiaSaudi ArabiaScotlandSenegalSerbiaSierra LeoneSingaporeSomaliaSouth AfricaSouth AmericaSouth Central AsiaSouth Eastern AsiaSouthern EuropeSpainSri LankaSt. Vincent and the GrenadinesSudanSwedenSwitzerlandSyriaTaiwanThailandTrinidad and TobagoTurkeyUgandaUkraineUruguayUzbekistanVenezuelaVietnamWest IndiesWestern AfricaWestern AsiaWestern EuropeYemenZaireZimbabweAzores
Select to Compare
Race
Ancestry
AfghanAfricanAlaska NativeAlaskan AthabascanAlbanianAleutAlsatianAmericanApacheArabArapahoArgentineanArmenianAssyrian/Chaldean/SyriacAustralianAustrianBahamianBangladeshiBarbadianBasqueBelgianBelizeanBermudanBhutaneseBlackfeetBolivianBrazilianBritishBritish West IndianBulgarianBurmeseCajunCambodianCanadianCape VerdeanCarpatho RusynCelticCentral AmericanCentral American IndianCherokeeCheyenneChickasawChileanChineseChippewaChoctawColombianColvilleComancheCosta RicanCreeCreekCroatianCrowCubanCypriotCzechCzechoslovakianDanishDelawareDominicanDutchDutch West IndianEastern EuropeanEcuadorianEgyptianEnglishEstonianEthiopianEuropeanFijianFilipinoFinnishFrenchFrench American IndianFrench CanadianGermanGerman RussianGhanaianGreekGuamanian/ChamorroGuatemalanGuyaneseHaitianHmongHonduranHopiHoumaHungarianIcelanderIndian (Asian)IndonesianInupiatIranianIraqiIrishIroquoisIsraeliItalianJamaicanJapaneseJordanianKenyanKiowaKoreanLaotianLatvianLebaneseLiberianLithuanianLumbeeLuxembourgerMacedonianMalaysianMalteseMarshalleseMenomineeMexicanMexican American IndianMongolianMoroccanNative HawaiianNavajoNepaleseNew ZealanderNicaraguanNigerianNorthern EuropeanNorwegianOkinawanOsageOttawaPaiutePakistaniPalestinianPanamanianParaguayanPennsylvania GermanPeruvianPimaPolishPortuguesePotawatomiPuebloPuerto RicanPuget Sound SalishRomanianRussianSalvadoranSamoanScandinavianScotch-IrishScottishSeminoleSenegaleseSerbianShoshoneSierra LeoneanSiouxSlavicSlovakSloveneSomaliSouth AfricanSouth AmericanSouth American IndianSoviet UnionSpaniardSpanishSpanish AmericanSpanish American IndianSri LankanSubsaharan AfricanSudaneseSwedishSwissSyrianTaiwaneseThaiTlingit-HaidaTohono O'OdhamTonganTrinidadian and TobagonianTsimshianTurkishU.S. Virgin IslanderUgandanUkrainianUruguayanUteVenezuelanVietnameseWelshWest IndianYakamaYaquiYugoslavianYumanYup'ikZimbabwean
Immigration
NonimmigrantsImmigrantsAfghanistanAfricaAlbaniaArgentinaArmeniaAsiaAustraliaAustriaBahamasBangladeshBarbadosBelarusBelgiumBelizeBoliviaBosnia and HerzegovinaBrazilBulgariaBurma/MyanmarCabo VerdeCambodiaCameroonCanadaCaribbeanCentral AmericaChileChinaColombiaCongoCosta RicaCroatiaCubaCzechoslovakiaDenmarkDominicaDominican RepublicEastern AfricaEastern AsiaEastern EuropeEgyptEl SalvadorEnglandEritreaEthiopiaEuropeFijiFranceGermanyGhanaGreeceGrenadaGuatemalaGuyanaHaitiHondurasHong KongHungaryIndiaIndonesiaIranIraqIrelandIsraelItalyJamaicaJapanJordanKazakhstanKenyaKoreaKuwaitLaosLatin AmericaLatviaLebanonLiberiaLithuaniaMalaysiaMexicoMicronesiaMiddle AfricaMoldovaMoroccoNepalNetherlandsNicaraguaNigeriaNorth AmericaNorth MacedoniaNorthern AfricaNorthern EuropeNorwayOceaniaPakistanPanamaPeruPhilippinesPolandPortugalRomaniaRussiaSaudi ArabiaScotlandSenegalSerbiaSierra LeoneSingaporeSomaliaSouth AfricaSouth AmericaSouth Central AsiaSouth Eastern AsiaSouthern EuropeSpainSri LankaSt. Vincent and the GrenadinesSudanSwedenSwitzerlandSyriaTaiwanThailandTrinidad and TobagoTurkeyUgandaUkraineUruguayUzbekistanVenezuelaVietnamWest IndiesWestern AfricaWestern AsiaWestern EuropeYemenZaireZimbabweAzores
Disability Age 5 to 17
Income
Poverty
Unemployment
Labor Participation
Family Structure
Vehicle Availability
Education Level
Disability

Immigrants from Ecuador Disability Age 5 to 17
Good

5.5%
DISABILITY | AGE 5 TO 17
78.3/ 100
METRIC RATING
155th/ 347
METRIC RANK

Immigrants from Ecuador Disability Age 5 to 17 Correlation Chart

The statistical analysis conducted on geographies consisting of 269,602,544 people shows a poor positive correlation between the proportion of Immigrants from Ecuador and percentage of population with a disability between the ages 5 and 17 in the United States with a correlation coefficient (R) of 0.148 and weighted average of 5.5%. On average, for every 1% (one percent) increase in Immigrants from Ecuador within a typical geography, there is an increase of 0.073% in percentage of population with a disability between the ages 5 and 17.
Immigrants from Ecuador Disability Age 5 to 17
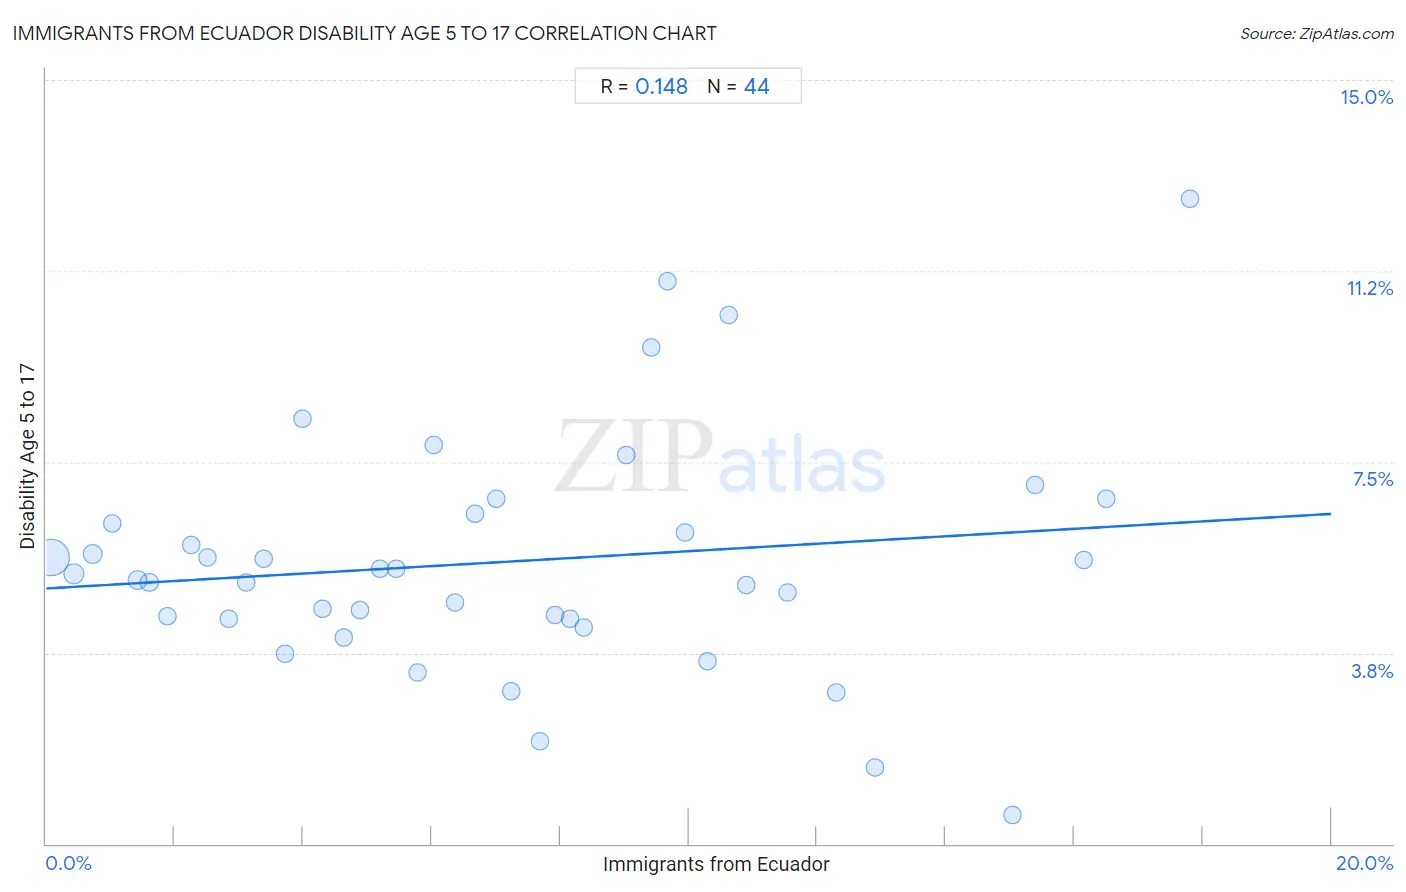
It is essential to understand that the correlation between the percentage of Immigrants from Ecuador and percentage of population with a disability between the ages 5 and 17 does not imply a direct cause-and-effect relationship. It remains uncertain whether the presence of Immigrants from Ecuador influences an upward or downward trend in the level of percentage of population with a disability between the ages 5 and 17 within an area, or if Immigrants from Ecuador simply ended up residing in those areas with higher or lower levels of percentage of population with a disability between the ages 5 and 17 due to other factors.

Demographics Similar to Immigrants from Ecuador by Disability Age 5 to 17

In terms of disability age 5 to 17, the demographic groups most similar to Immigrants from Ecuador are Hawaiian (5.5%, a difference of 0.020%), Immigrants from Costa Rica (5.5%, a difference of 0.030%), Australian (5.5%, a difference of 0.040%), Immigrants from Nepal (5.5%, a difference of 0.080%), and Ecuadorian (5.5%, a difference of 0.11%).
DemographicsRating | RankDisability Age 5 to 17
Samoans
81.9
/100
|
#148
Excellent
5.5%
Central Americans
81.6
/100
|
#149
Excellent
5.5%
Guatemalans
81.5
/100
|
#150
Excellent
5.5%
Estonians
80.8
/100
|
#151
Excellent
5.5%
Ute
80.6
/100
|
#152
Excellent
5.5%
Ecuadorians
79.7
/100
|
#153
Good
5.5%
Australians
78.8
/100
|
#154
Good
5.5%
Immigrants from Ecuador
78.3
/100
|
#155
Good
5.5%
Hawaiians
78.0
/100
|
#156
Good
5.5%
Immigrants from Costa Rica
77.9
/100
|
#157
Good
5.5%
Immigrants from Nepal
77.1
/100
|
#158
Good
5.5%
Immigrants from Zimbabwe
75.3
/100
|
#159
Good
5.5%
South Africans
73.3
/100
|
#160
Good
5.5%
Immigrants from Saudi Arabia
69.1
/100
|
#161
Good
5.5%
Zimbabweans
67.2
/100
|
#162
Good
5.5%

Immigrants from Ecuador Disability Age 5 to 17 Correlation Summary

MeasurementImmigrants from Ecuador DataDisability Age 5 to 17 Data
Minimum0.080%0.57%
Maximum17.8%12.7%
Range17.7%12.1%
Mean7.1%5.5%
Median6.5%5.2%
Interquartile 25% (IQ1)3.2%4.4%
Interquartile 75% (IQ3)10.1%6.4%
Interquartile Range (IQR)6.9%2.0%
Standard Deviation (Sample)4.7%2.4%
Standard Deviation (Population)4.7%2.3%

Correlation Details

Immigrants from Ecuador PercentileSample SizeDisability Age 5 to 17
[
0.0%
-
0.5%
]
0.080%
209,147,5985.6%
[
0.0%
-
0.5%
]
0.42%
25,759,6745.3%
[
0.5%
-
1.0%
]
0.73%
8,288,1145.7%
[
1.0%
-
1.5%
]
1.03%
5,652,3876.3%
[
1.0%
-
1.5%
]
1.42%
12,098,6475.2%
[
1.5%
-
2.0%
]
1.60%
2,056,6725.1%
[
1.5%
-
2.0%
]
1.88%
952,2854.5%
[
2.0%
-
2.5%
]
2.26%
887,9875.9%
[
2.5%
-
3.0%
]
2.51%
615,6135.6%
[
2.5%
-
3.0%
]
2.85%
355,3354.4%
[
3.0%
-
3.5%
]
3.11%
341,2475.1%
[
3.0%
-
3.5%
]
3.38%
169,3555.6%
[
3.5%
-
4.0%
]
3.71%
175,9013.7%
[
3.5%
-
4.0%
]
3.99%
145,2048.4%
[
4.0%
-
4.5%
]
4.29%
199,9634.6%
[
4.5%
-
5.0%
]
4.62%
209,4764.0%
[
4.5%
-
5.0%
]
4.89%
382,1584.6%
[
5.0%
-
5.5%
]
5.20%
107,3655.4%
[
5.0%
-
5.5%
]
5.46%
36,3335.4%
[
5.5%
-
6.0%
]
5.77%
241,2943.4%
[
6.0%
-
6.5%
]
6.03%
500,2857.8%
[
6.0%
-
6.5%
]
6.36%
40,4044.7%
[
6.5%
-
7.0%
]
6.68%
168,2166.5%
[
6.5%
-
7.0%
]
7.00%
86,4566.8%
[
7.0%
-
7.5%
]
7.24%
165,9843.0%
[
7.5%
-
8.0%
]
7.68%
32,1772.0%
[
7.5%
-
8.0%
]
7.91%
128,9184.5%
[
8.0%
-
8.5%
]
8.14%
117,8034.4%
[
8.0%
-
8.5%
]
8.37%
123,2044.2%
[
9.0%
-
9.5%
]
9.03%
58,7177.6%
[
9.0%
-
9.5%
]
9.41%
5,8649.7%
[
9.5%
-
10.0%
]
9.66%
27,07611.0%
[
9.5%
-
10.0%
]
9.94%
79,8006.1%
[
10.0%
-
10.5%
]
10.28%
10,3963.6%
[
10.5%
-
11.0%
]
10.62%
64010.4%
[
10.5%
-
11.0%
]
10.89%
8,7765.1%
[
11.5%
-
12.0%
]
11.54%
8,1784.9%
[
12.0%
-
12.5%
]
12.30%
21,0403.0%
[
12.5%
-
13.0%
]
12.90%
6,1691.5%
[
15.0%
-
15.5%
]
15.03%
9,1620.57%
[
15.0%
-
15.5%
]
15.38%
4,4077.0%
[
16.0%
-
16.5%
]
16.14%
112,7505.6%
[
16.5%
-
17.0%
]
16.50%
5,5876.8%
[
17.5%
-
18.0%
]
17.80%
57,92712.7%