Welsh Disability Age 5 to 17
COMPARE
Welsh
Select to Compare
Disability Age 5 to 17
Welsh Disability Age 5 to 17
6.3%
DISABILITY | AGE 5 TO 17
0.0/ 100
METRIC RATING
299th/ 347
METRIC RANK
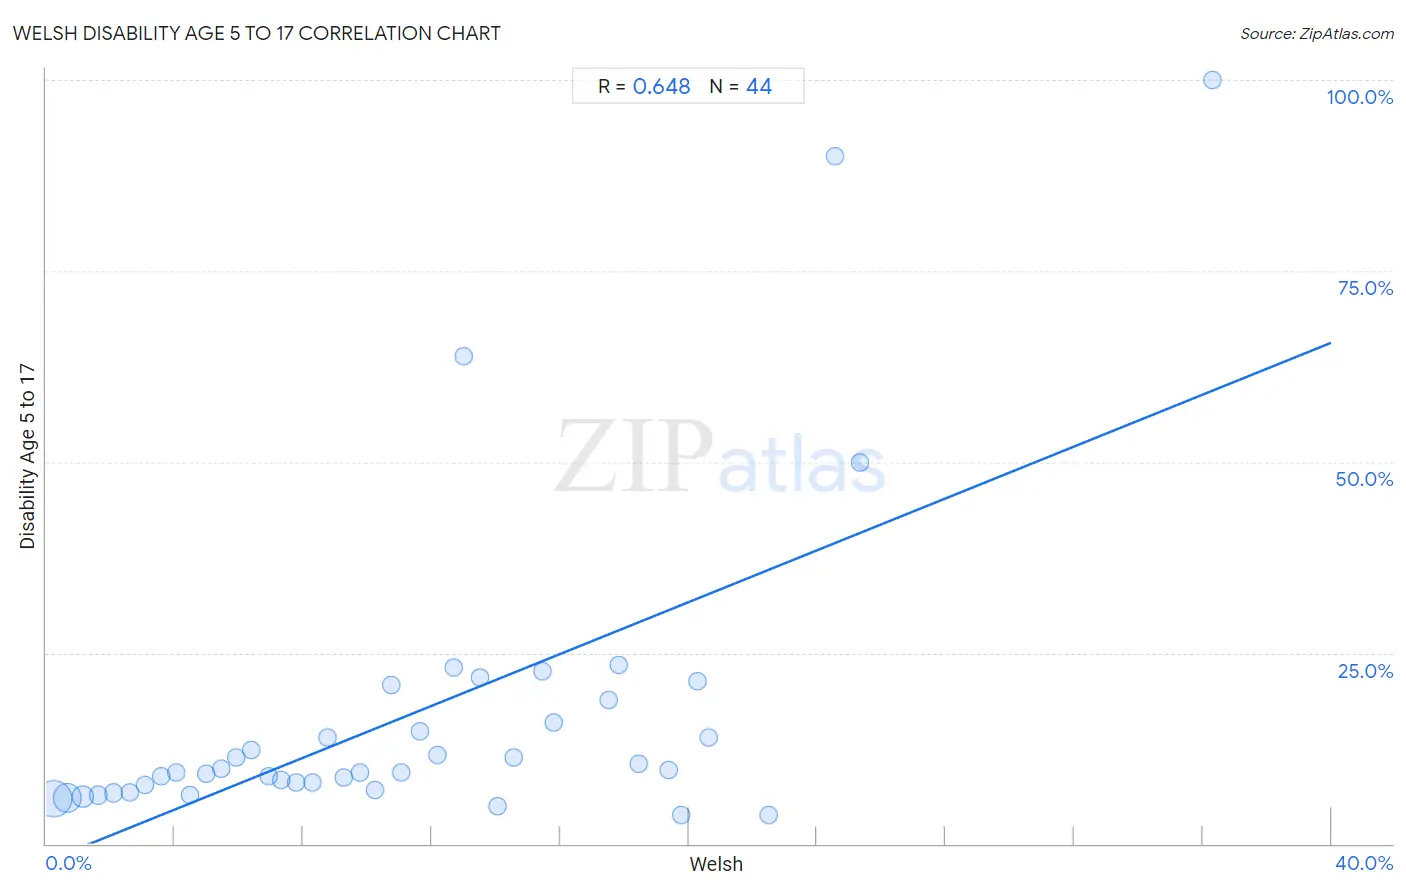
Welsh Disability Age 5 to 17 Correlation Chart
The statistical analysis conducted on geographies consisting of 518,817,158 people shows a significant positive correlation between the proportion of Welsh and percentage of population with a disability between the ages 5 and 17 in the United States with a correlation coefficient (R) of 0.648 and weighted average of 6.3%. On average, for every 1% (one percent) increase in Welsh within a typical geography, there is an increase of 1.7% in percentage of population with a disability between the ages 5 and 17.
It is essential to understand that the correlation between the percentage of Welsh and percentage of population with a disability between the ages 5 and 17 does not imply a direct cause-and-effect relationship. It remains uncertain whether the presence of Welsh influences an upward or downward trend in the level of percentage of population with a disability between the ages 5 and 17 within an area, or if Welsh simply ended up residing in those areas with higher or lower levels of percentage of population with a disability between the ages 5 and 17 due to other factors.
Demographics Similar to Welsh by Disability Age 5 to 17
In terms of disability age 5 to 17, the demographic groups most similar to Welsh are Carpatho Rusyn (6.3%, a difference of 0.12%), U.S. Virgin Islander (6.3%, a difference of 0.14%), Lumbee (6.2%, a difference of 0.15%), Immigrants from Bahamas (6.2%, a difference of 0.22%), and Spanish American (6.2%, a difference of 0.35%).
| Demographics | Rating | Rank | Disability Age 5 to 17 |
| Immigrants from Senegal | 0.0 /100 | #292 | Tragic 6.2% |
| Central American Indians | 0.0 /100 | #293 | Tragic 6.2% |
| Irish | 0.0 /100 | #294 | Tragic 6.2% |
| Cree | 0.0 /100 | #295 | Tragic 6.2% |
| Spanish Americans | 0.0 /100 | #296 | Tragic 6.2% |
| Immigrants from Bahamas | 0.0 /100 | #297 | Tragic 6.2% |
| Lumbee | 0.0 /100 | #298 | Tragic 6.2% |
| Welsh | 0.0 /100 | #299 | Tragic 6.3% |
| Carpatho Rusyns | 0.0 /100 | #300 | Tragic 6.3% |
| U.S. Virgin Islanders | 0.0 /100 | #301 | Tragic 6.3% |
| Celtics | 0.0 /100 | #302 | Tragic 6.3% |
| Yakama | 0.0 /100 | #303 | Tragic 6.3% |
| Senegalese | 0.0 /100 | #304 | Tragic 6.3% |
| Natives/Alaskans | 0.0 /100 | #305 | Tragic 6.3% |
| Nonimmigrants | 0.0 /100 | #306 | Tragic 6.3% |
Welsh Disability Age 5 to 17 Correlation Summary
| Measurement | Welsh Data | Disability Age 5 to 17 Data |
| Minimum | 0.24% | 3.7% |
| Maximum | 36.3% | 100.0% |
| Range | 36.1% | 96.3% |
| Mean | 11.4% | 17.0% |
| Median | 10.5% | 9.5% |
| Interquartile 25% (IQ1) | 5.2% | 7.4% |
| Interquartile 75% (IQ3) | 16.7% | 17.4% |
| Interquartile Range (IQR) | 11.4% | 9.9% |
| Standard Deviation (Sample) | 7.8% | 20.5% |
| Standard Deviation (Population) | 7.7% | 20.3% |
Correlation Details
| Welsh Percentile | Sample Size | Disability Age 5 to 17 |
[ 0.0% - 0.5% ] 0.24% | 285,267,022 | 5.9% |
[ 0.5% - 1.0% ] 0.67% | 159,318,379 | 6.0% |
[ 1.0% - 1.5% ] 1.13% | 46,638,561 | 6.2% |
[ 1.5% - 2.0% ] 1.62% | 15,007,256 | 6.4% |
[ 2.0% - 2.5% ] 2.09% | 6,124,874 | 6.6% |
[ 2.5% - 3.0% ] 2.59% | 3,070,873 | 6.8% |
[ 3.0% - 3.5% ] 3.06% | 1,153,824 | 7.8% |
[ 3.5% - 4.0% ] 3.56% | 796,825 | 8.8% |
[ 4.0% - 4.5% ] 4.04% | 354,116 | 9.3% |
[ 4.0% - 4.5% ] 4.49% | 233,397 | 6.4% |
[ 4.5% - 5.0% ] 4.97% | 291,429 | 9.1% |
[ 5.0% - 5.5% ] 5.46% | 152,458 | 9.8% |
[ 5.5% - 6.0% ] 5.93% | 87,859 | 11.2% |
[ 6.0% - 6.5% ] 6.40% | 72,198 | 12.3% |
[ 6.5% - 7.0% ] 6.92% | 51,658 | 8.8% |
[ 7.0% - 7.5% ] 7.31% | 41,383 | 8.4% |
[ 7.5% - 8.0% ] 7.79% | 33,927 | 8.0% |
[ 8.0% - 8.5% ] 8.28% | 18,132 | 8.0% |
[ 8.5% - 9.0% ] 8.75% | 10,999 | 13.9% |
[ 9.0% - 9.5% ] 9.28% | 7,824 | 8.6% |
[ 9.5% - 10.0% ] 9.77% | 14,304 | 9.4% |
[ 10.0% - 10.5% ] 10.22% | 3,161 | 7.1% |
[ 10.5% - 11.0% ] 10.74% | 8,053 | 20.9% |
[ 11.0% - 11.5% ] 11.06% | 1,916 | 9.4% |
[ 11.5% - 12.0% ] 11.62% | 13,030 | 14.8% |
[ 12.0% - 12.5% ] 12.19% | 11,702 | 11.6% |
[ 12.5% - 13.0% ] 12.68% | 418 | 23.1% |
[ 13.0% - 13.5% ] 13.00% | 200 | 63.9% |
[ 13.0% - 13.5% ] 13.49% | 6,301 | 21.7% |
[ 14.0% - 14.5% ] 14.06% | 2,041 | 5.0% |
[ 14.5% - 15.0% ] 14.54% | 6,403 | 11.3% |
[ 15.0% - 15.5% ] 15.44% | 745 | 22.6% |
[ 15.5% - 16.0% ] 15.82% | 803 | 16.0% |
[ 17.0% - 17.5% ] 17.50% | 240 | 18.8% |
[ 17.5% - 18.0% ] 17.83% | 1,593 | 23.4% |
[ 18.0% - 18.5% ] 18.43% | 9,039 | 10.5% |
[ 19.0% - 19.5% ] 19.38% | 289 | 9.7% |
[ 19.5% - 20.0% ] 19.78% | 278 | 3.7% |
[ 20.0% - 20.5% ] 20.28% | 143 | 21.2% |
[ 20.5% - 21.0% ] 20.61% | 849 | 13.9% |
[ 22.0% - 22.5% ] 22.49% | 2,219 | 3.8% |
[ 24.5% - 25.0% ] 24.54% | 216 | 90.0% |
[ 25.0% - 25.5% ] 25.33% | 75 | 50.0% |
[ 36.0% - 36.5% ] 36.30% | 146 | 100.0% |