Puget Sound Salish Disability Age 5 to 17

COMPARE

Puget Sound Salish
Race
Ancestry
AfghanAfricanAlaska NativeAlaskan AthabascanAlbanianAleutAlsatianAmericanApacheArabArapahoArgentineanArmenianAssyrian/Chaldean/SyriacAustralianAustrianBahamianBangladeshiBarbadianBasqueBelgianBelizeanBermudanBhutaneseBlackfeetBolivianBrazilianBritishBritish West IndianBulgarianBurmeseCajunCambodianCanadianCape VerdeanCarpatho RusynCelticCentral AmericanCentral American IndianCherokeeCheyenneChickasawChileanChineseChippewaChoctawColombianColvilleComancheCosta RicanCreeCreekCroatianCrowCubanCypriotCzechCzechoslovakianDanishDelawareDominicanDutchDutch West IndianEastern EuropeanEcuadorianEgyptianEnglishEstonianEthiopianEuropeanFijianFilipinoFinnishFrenchFrench American IndianFrench CanadianGermanGerman RussianGhanaianGreekGuamanian/ChamorroGuatemalanGuyaneseHaitianHmongHonduranHopiHoumaHungarianIcelanderIndian (Asian)IndonesianInupiatIranianIraqiIrishIroquoisIsraeliItalianJamaicanJapaneseJordanianKenyanKiowaKoreanLaotianLatvianLebaneseLiberianLithuanianLumbeeLuxembourgerMacedonianMalaysianMalteseMarshalleseMenomineeMexicanMexican American IndianMongolianMoroccanNative HawaiianNavajoNepaleseNew ZealanderNicaraguanNigerianNorthern EuropeanNorwegianOkinawanOsageOttawaPaiutePakistaniPalestinianPanamanianParaguayanPennsylvania GermanPeruvianPimaPolishPortuguesePotawatomiPuebloPuerto RicanPuget Sound SalishRomanianRussianSalvadoranSamoanScandinavianScotch-IrishScottishSeminoleSenegaleseSerbianShoshoneSierra LeoneanSiouxSlavicSlovakSloveneSomaliSouth AfricanSouth AmericanSouth American IndianSoviet UnionSpaniardSpanishSpanish AmericanSpanish American IndianSri LankanSubsaharan AfricanSudaneseSwedishSwissSyrianTaiwaneseThaiTlingit-HaidaTohono O'OdhamTonganTrinidadian and TobagonianTsimshianTurkishU.S. Virgin IslanderUgandanUkrainianUruguayanUteVenezuelanVietnameseWelshWest IndianYakamaYaquiYugoslavianYumanYup'ikZimbabwean
Immigration
NonimmigrantsImmigrantsAfghanistanAfricaAlbaniaArgentinaArmeniaAsiaAustraliaAustriaBahamasBangladeshBarbadosBelarusBelgiumBelizeBoliviaBosnia and HerzegovinaBrazilBulgariaBurma/MyanmarCabo VerdeCambodiaCameroonCanadaCaribbeanCentral AmericaChileChinaColombiaCongoCosta RicaCroatiaCubaCzechoslovakiaDenmarkDominicaDominican RepublicEastern AfricaEastern AsiaEastern EuropeEcuadorEgyptEl SalvadorEnglandEritreaEthiopiaEuropeFijiFranceGermanyGhanaGreeceGrenadaGuatemalaGuyanaHaitiHondurasHong KongHungaryIndiaIndonesiaIranIraqIrelandIsraelItalyJamaicaJapanJordanKazakhstanKenyaKoreaKuwaitLaosLatin AmericaLatviaLebanonLiberiaLithuaniaMalaysiaMexicoMicronesiaMiddle AfricaMoldovaMoroccoNepalNetherlandsNicaraguaNigeriaNorth AmericaNorth MacedoniaNorthern AfricaNorthern EuropeNorwayOceaniaPakistanPanamaPeruPhilippinesPolandPortugalRomaniaRussiaSaudi ArabiaScotlandSenegalSerbiaSierra LeoneSingaporeSomaliaSouth AfricaSouth AmericaSouth Central AsiaSouth Eastern AsiaSouthern EuropeSpainSri LankaSt. Vincent and the GrenadinesSudanSwedenSwitzerlandSyriaTaiwanThailandTrinidad and TobagoTurkeyUgandaUkraineUruguayUzbekistanVenezuelaVietnamWest IndiesWestern AfricaWestern AsiaWestern EuropeYemenZaireZimbabweAzores
Select to Compare
Race
Ancestry
AfghanAfricanAlaska NativeAlaskan AthabascanAlbanianAleutAlsatianAmericanApacheArabArapahoArgentineanArmenianAssyrian/Chaldean/SyriacAustralianAustrianBahamianBangladeshiBarbadianBasqueBelgianBelizeanBermudanBhutaneseBlackfeetBolivianBrazilianBritishBritish West IndianBulgarianBurmeseCajunCambodianCanadianCape VerdeanCarpatho RusynCelticCentral AmericanCentral American IndianCherokeeCheyenneChickasawChileanChineseChippewaChoctawColombianColvilleComancheCosta RicanCreeCreekCroatianCrowCubanCypriotCzechCzechoslovakianDanishDelawareDominicanDutchDutch West IndianEastern EuropeanEcuadorianEgyptianEnglishEstonianEthiopianEuropeanFijianFilipinoFinnishFrenchFrench American IndianFrench CanadianGermanGerman RussianGhanaianGreekGuamanian/ChamorroGuatemalanGuyaneseHaitianHmongHonduranHopiHoumaHungarianIcelanderIndian (Asian)IndonesianInupiatIranianIraqiIrishIroquoisIsraeliItalianJamaicanJapaneseJordanianKenyanKiowaKoreanLaotianLatvianLebaneseLiberianLithuanianLumbeeLuxembourgerMacedonianMalaysianMalteseMarshalleseMenomineeMexicanMexican American IndianMongolianMoroccanNative HawaiianNavajoNepaleseNew ZealanderNicaraguanNigerianNorthern EuropeanNorwegianOkinawanOsageOttawaPaiutePakistaniPalestinianPanamanianParaguayanPennsylvania GermanPeruvianPimaPolishPortuguesePotawatomiPuebloPuerto RicanRomanianRussianSalvadoranSamoanScandinavianScotch-IrishScottishSeminoleSenegaleseSerbianShoshoneSierra LeoneanSiouxSlavicSlovakSloveneSomaliSouth AfricanSouth AmericanSouth American IndianSoviet UnionSpaniardSpanishSpanish AmericanSpanish American IndianSri LankanSubsaharan AfricanSudaneseSwedishSwissSyrianTaiwaneseThaiTlingit-HaidaTohono O'OdhamTonganTrinidadian and TobagonianTsimshianTurkishU.S. Virgin IslanderUgandanUkrainianUruguayanUteVenezuelanVietnameseWelshWest IndianYakamaYaquiYugoslavianYumanYup'ikZimbabwean
Immigration
NonimmigrantsImmigrantsAfghanistanAfricaAlbaniaArgentinaArmeniaAsiaAustraliaAustriaBahamasBangladeshBarbadosBelarusBelgiumBelizeBoliviaBosnia and HerzegovinaBrazilBulgariaBurma/MyanmarCabo VerdeCambodiaCameroonCanadaCaribbeanCentral AmericaChileChinaColombiaCongoCosta RicaCroatiaCubaCzechoslovakiaDenmarkDominicaDominican RepublicEastern AfricaEastern AsiaEastern EuropeEcuadorEgyptEl SalvadorEnglandEritreaEthiopiaEuropeFijiFranceGermanyGhanaGreeceGrenadaGuatemalaGuyanaHaitiHondurasHong KongHungaryIndiaIndonesiaIranIraqIrelandIsraelItalyJamaicaJapanJordanKazakhstanKenyaKoreaKuwaitLaosLatin AmericaLatviaLebanonLiberiaLithuaniaMalaysiaMexicoMicronesiaMiddle AfricaMoldovaMoroccoNepalNetherlandsNicaraguaNigeriaNorth AmericaNorth MacedoniaNorthern AfricaNorthern EuropeNorwayOceaniaPakistanPanamaPeruPhilippinesPolandPortugalRomaniaRussiaSaudi ArabiaScotlandSenegalSerbiaSierra LeoneSingaporeSomaliaSouth AfricaSouth AmericaSouth Central AsiaSouth Eastern AsiaSouthern EuropeSpainSri LankaSt. Vincent and the GrenadinesSudanSwedenSwitzerlandSyriaTaiwanThailandTrinidad and TobagoTurkeyUgandaUkraineUruguayUzbekistanVenezuelaVietnamWest IndiesWestern AfricaWestern AsiaWestern EuropeYemenZaireZimbabweAzores
Disability Age 5 to 17
Income
Poverty
Unemployment
Labor Participation
Family Structure
Vehicle Availability
Education Level
Disability

Puget Sound Salish Disability Age 5 to 17
Tragic

6.1%
DISABILITY | AGE 5 TO 17
0.1/ 100
METRIC RATING
277th/ 347
METRIC RANK

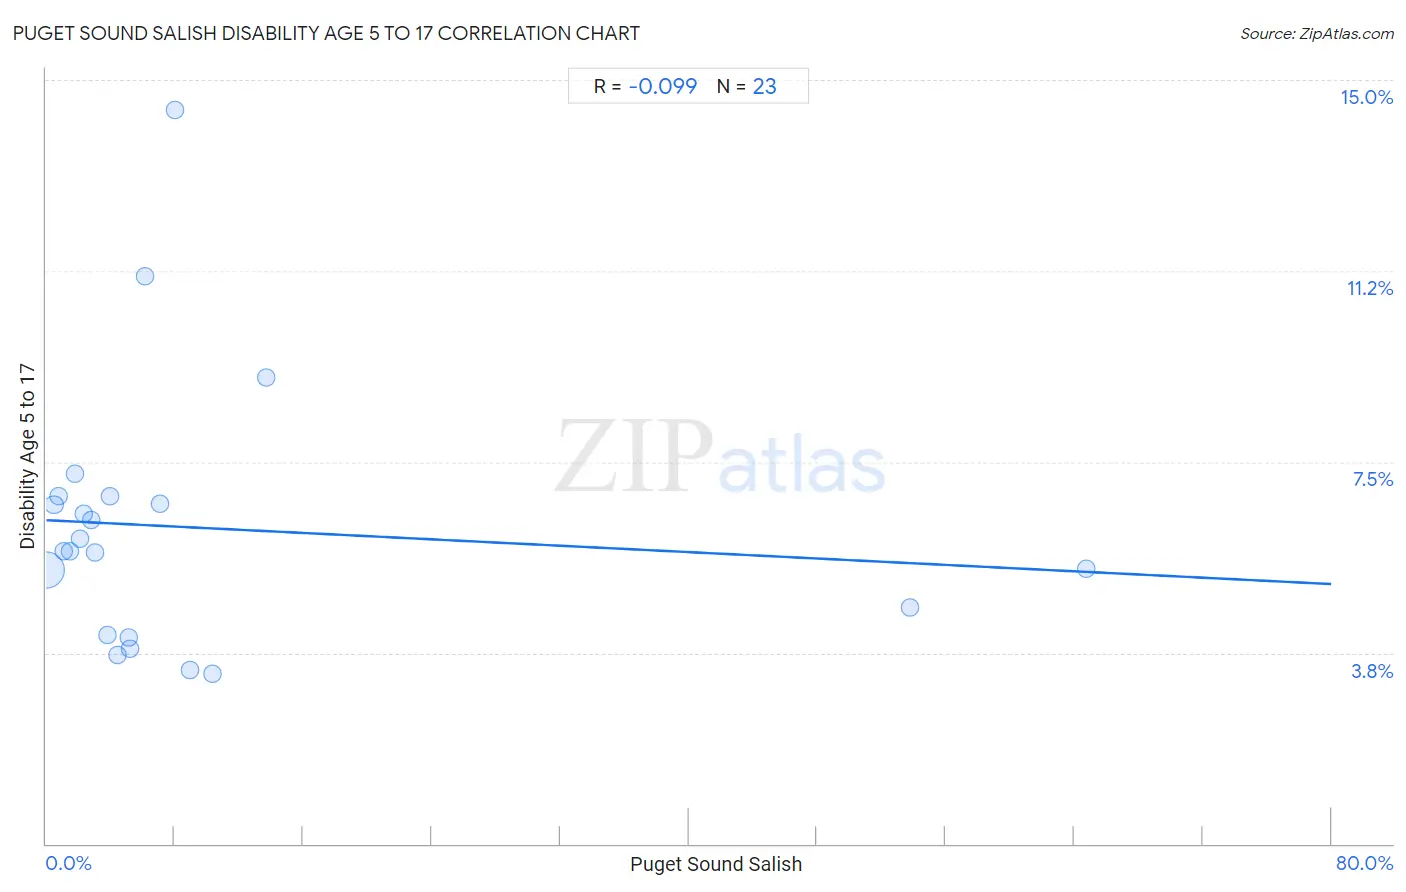
Puget Sound Salish Disability Age 5 to 17 Correlation Chart

The statistical analysis conducted on geographies consisting of 46,037,254 people shows a slight negative correlation between the proportion of Puget Sound Salish and percentage of population with a disability between the ages 5 and 17 in the United States with a correlation coefficient (R) of -0.099 and weighted average of 6.1%. On average, for every 1% (one percent) increase in Puget Sound Salish within a typical geography, there is a decrease of 0.016% in percentage of population with a disability between the ages 5 and 17.
Puget Sound Salish Disability Age 5 to 17
It is essential to understand that the correlation between the percentage of Puget Sound Salish and percentage of population with a disability between the ages 5 and 17 does not imply a direct cause-and-effect relationship. It remains uncertain whether the presence of Puget Sound Salish influences an upward or downward trend in the level of percentage of population with a disability between the ages 5 and 17 within an area, or if Puget Sound Salish simply ended up residing in those areas with higher or lower levels of percentage of population with a disability between the ages 5 and 17 due to other factors.

Demographics Similar to Puget Sound Salish by Disability Age 5 to 17

In terms of disability age 5 to 17, the demographic groups most similar to Puget Sound Salish are Immigrants from Liberia (6.1%, a difference of 0.080%), Immigrants from Jamaica (6.1%, a difference of 0.22%), Portuguese (6.1%, a difference of 0.36%), Scottish (6.1%, a difference of 0.61%), and Japanese (6.1%, a difference of 0.72%).
DemographicsRating | RankDisability Age 5 to 17
Immigrants from Somalia
0.4
/100
|
#270
Tragic
6.0%
Immigrants from Zaire
0.2
/100
|
#271
Tragic
6.0%
Finns
0.2
/100
|
#272
Tragic
6.0%
Alaska Natives
0.2
/100
|
#273
Tragic
6.0%
Cheyenne
0.2
/100
|
#274
Tragic
6.0%
Dutch
0.2
/100
|
#275
Tragic
6.0%
Japanese
0.1
/100
|
#276
Tragic
6.1%
Puget Sound Salish
0.1
/100
|
#277
Tragic
6.1%
Immigrants from Liberia
0.1
/100
|
#278
Tragic
6.1%
Immigrants from Jamaica
0.1
/100
|
#279
Tragic
6.1%
Portuguese
0.1
/100
|
#280
Tragic
6.1%
Scottish
0.0
/100
|
#281
Tragic
6.1%
Germans
0.0
/100
|
#282
Tragic
6.1%
Ugandans
0.0
/100
|
#283
Tragic
6.2%
Sub-Saharan Africans
0.0
/100
|
#284
Tragic
6.2%

Puget Sound Salish Disability Age 5 to 17 Correlation Summary

MeasurementPuget Sound Salish DataDisability Age 5 to 17 Data
Minimum0.031%3.3%
Maximum64.8%14.4%
Range64.7%11.1%
Mean9.2%6.2%
Median4.0%5.8%
Interquartile 25% (IQ1)1.8%4.1%
Interquartile 75% (IQ3)8.0%6.8%
Interquartile Range (IQR)6.2%2.7%
Standard Deviation (Sample)16.3%2.6%
Standard Deviation (Population)15.9%2.5%

Correlation Details

Puget Sound Salish PercentileSample SizeDisability Age 5 to 17
[
0.0%
-
0.5%
]
0.031%
43,316,0075.4%
[
0.0%
-
0.5%
]
0.48%
1,401,4406.7%
[
0.5%
-
1.0%
]
0.75%
625,2966.8%
[
1.0%
-
1.5%
]
1.07%
225,9765.8%
[
1.5%
-
2.0%
]
1.51%
120,3605.7%
[
1.5%
-
2.0%
]
1.82%
125,9057.3%
[
2.0%
-
2.5%
]
2.08%
65,4206.0%
[
2.0%
-
2.5%
]
2.35%
19,1396.5%
[
2.5%
-
3.0%
]
2.81%
37,0656.4%
[
3.0%
-
3.5%
]
3.03%
44,8505.7%
[
3.5%
-
4.0%
]
3.77%
2,0404.1%
[
3.5%
-
4.0%
]
3.95%
7346.8%
[
4.0%
-
4.5%
]
4.44%
2,1853.7%
[
5.0%
-
5.5%
]
5.14%
2,0414.0%
[
5.0%
-
5.5%
]
5.22%
9973.8%
[
6.0%
-
6.5%
]
6.18%
3,28411.1%
[
7.0%
-
7.5%
]
7.09%
30,2626.7%
[
8.0%
-
8.5%
]
8.00%
1,00014.4%
[
8.5%
-
9.0%
]
8.96%
3,2033.4%
[
10.0%
-
10.5%
]
10.33%
4,3293.3%
[
13.5%
-
14.0%
]
13.67%
4,4849.2%
[
53.5%
-
54.0%
]
53.79%
5934.7%
[
64.5%
-
65.0%
]
64.75%
6445.4%