French Canadian Disability Age 5 to 17
COMPARE
French Canadian
Select to Compare
Disability Age 5 to 17
French Canadian Disability Age 5 to 17
6.7%
DISABILITY | AGE 5 TO 17
0.0/ 100
METRIC RATING
331st/ 347
METRIC RANK
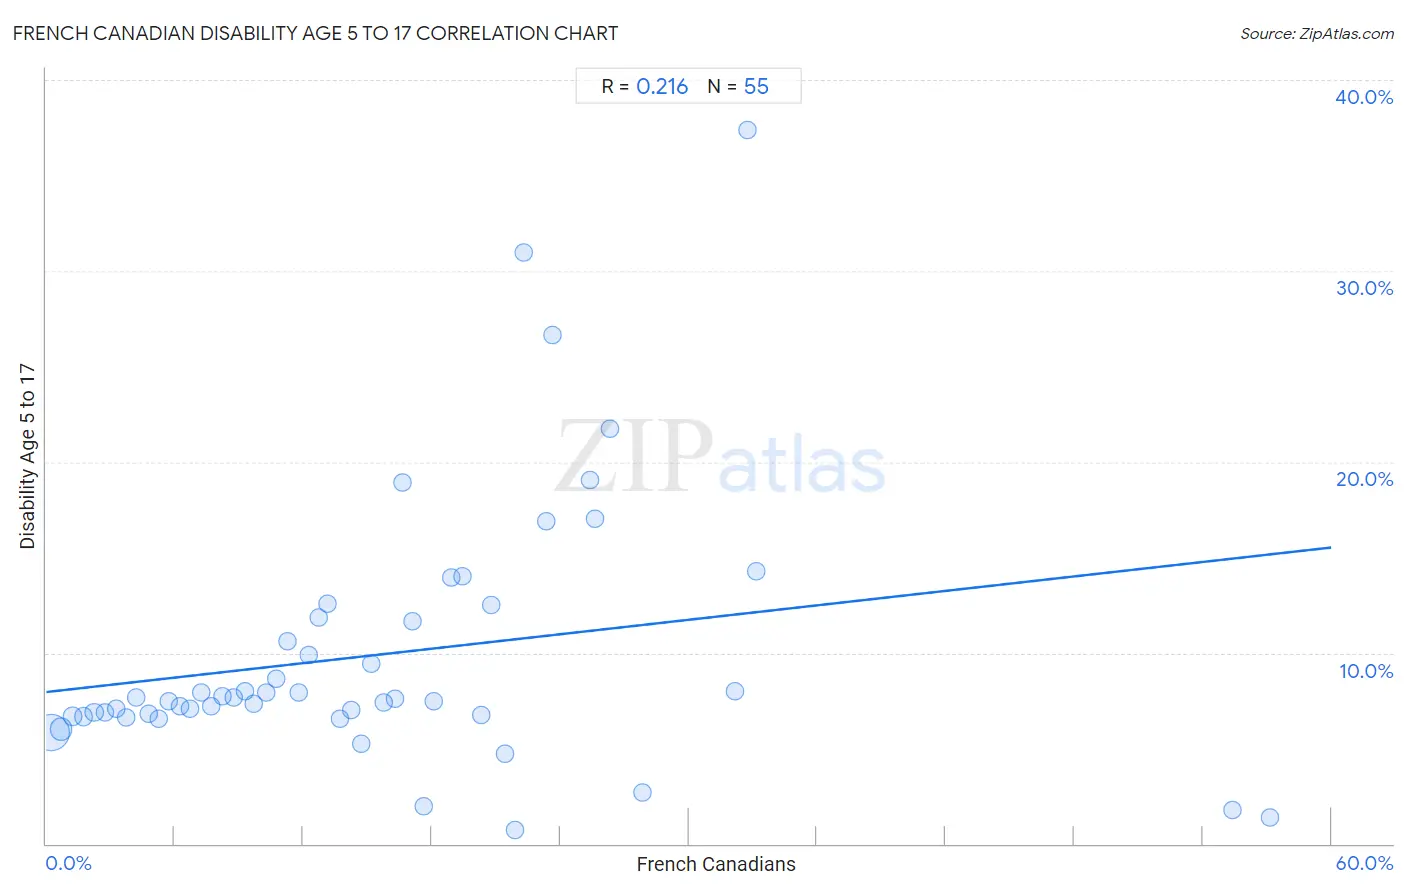
French Canadian Disability Age 5 to 17 Correlation Chart
The statistical analysis conducted on geographies consisting of 494,798,155 people shows a weak positive correlation between the proportion of French Canadians and percentage of population with a disability between the ages 5 and 17 in the United States with a correlation coefficient (R) of 0.216 and weighted average of 6.7%. On average, for every 1% (one percent) increase in French Canadians within a typical geography, there is an increase of 0.13% in percentage of population with a disability between the ages 5 and 17.
It is essential to understand that the correlation between the percentage of French Canadians and percentage of population with a disability between the ages 5 and 17 does not imply a direct cause-and-effect relationship. It remains uncertain whether the presence of French Canadians influences an upward or downward trend in the level of percentage of population with a disability between the ages 5 and 17 within an area, or if French Canadians simply ended up residing in those areas with higher or lower levels of percentage of population with a disability between the ages 5 and 17 due to other factors.
Demographics Similar to French Canadians by Disability Age 5 to 17
In terms of disability age 5 to 17, the demographic groups most similar to French Canadians are Immigrants from the Azores (6.7%, a difference of 0.020%), Dutch West Indian (6.7%, a difference of 0.080%), Black/African American (6.8%, a difference of 0.61%), Seminole (6.8%, a difference of 0.66%), and Ottawa (6.8%, a difference of 1.4%).
| Demographics | Rating | Rank | Disability Age 5 to 17 |
| Dominicans | 0.0 /100 | #324 | Tragic 6.5% |
| Americans | 0.0 /100 | #325 | Tragic 6.5% |
| Potawatomi | 0.0 /100 | #326 | Tragic 6.5% |
| French American Indians | 0.0 /100 | #327 | Tragic 6.6% |
| Pennsylvania Germans | 0.0 /100 | #328 | Tragic 6.6% |
| Blackfeet | 0.0 /100 | #329 | Tragic 6.6% |
| Dutch West Indians | 0.0 /100 | #330 | Tragic 6.7% |
| French Canadians | 0.0 /100 | #331 | Tragic 6.7% |
| Immigrants from the Azores | 0.0 /100 | #332 | Tragic 6.7% |
| Blacks/African Americans | 0.0 /100 | #333 | Tragic 6.8% |
| Seminole | 0.0 /100 | #334 | Tragic 6.8% |
| Ottawa | 0.0 /100 | #335 | Tragic 6.8% |
| Chickasaw | 0.0 /100 | #336 | Tragic 6.8% |
| Creek | 0.0 /100 | #337 | Tragic 6.9% |
| Iroquois | 0.0 /100 | #338 | Tragic 6.9% |
French Canadian Disability Age 5 to 17 Correlation Summary
| Measurement | French Canadian Data | Disability Age 5 to 17 Data |
| Minimum | 0.21% | 0.75% |
| Maximum | 57.2% | 37.4% |
| Range | 56.9% | 36.6% |
| Mean | 15.4% | 9.9% |
| Median | 13.7% | 7.6% |
| Interquartile 25% (IQ1) | 6.7% | 6.7% |
| Interquartile 75% (IQ3) | 21.4% | 11.8% |
| Interquartile Range (IQR) | 14.7% | 5.2% |
| Standard Deviation (Sample) | 11.8% | 6.9% |
| Standard Deviation (Population) | 11.7% | 6.8% |
Correlation Details
| French Canadian Percentile | Sample Size | Disability Age 5 to 17 |
[ 0.0% - 0.5% ] 0.21% | 360,331,061 | 5.8% |
[ 0.5% - 1.0% ] 0.68% | 79,994,315 | 6.0% |
[ 1.0% - 1.5% ] 1.21% | 21,734,362 | 6.7% |
[ 1.5% - 2.0% ] 1.73% | 9,255,421 | 6.7% |
[ 2.0% - 2.5% ] 2.24% | 5,498,842 | 6.9% |
[ 2.5% - 3.0% ] 2.71% | 3,307,923 | 6.9% |
[ 3.0% - 3.5% ] 3.26% | 2,592,918 | 7.1% |
[ 3.5% - 4.0% ] 3.75% | 1,982,976 | 6.6% |
[ 4.0% - 4.5% ] 4.22% | 1,425,379 | 7.6% |
[ 4.5% - 5.0% ] 4.76% | 1,116,900 | 6.8% |
[ 5.0% - 5.5% ] 5.27% | 955,012 | 6.5% |
[ 5.5% - 6.0% ] 5.72% | 741,664 | 7.5% |
[ 6.0% - 6.5% ] 6.24% | 858,125 | 7.2% |
[ 6.5% - 7.0% ] 6.72% | 618,158 | 7.1% |
[ 7.0% - 7.5% ] 7.21% | 701,180 | 7.9% |
[ 7.5% - 8.0% ] 7.72% | 484,561 | 7.2% |
[ 8.0% - 8.5% ] 8.24% | 720,214 | 7.7% |
[ 8.5% - 9.0% ] 8.76% | 214,326 | 7.6% |
[ 9.0% - 9.5% ] 9.26% | 324,720 | 8.0% |
[ 9.5% - 10.0% ] 9.66% | 210,129 | 7.3% |
[ 10.0% - 10.5% ] 10.28% | 354,846 | 8.0% |
[ 10.5% - 11.0% ] 10.77% | 264,395 | 8.7% |
[ 11.0% - 11.5% ] 11.27% | 117,305 | 10.6% |
[ 11.5% - 12.0% ] 11.80% | 71,399 | 7.9% |
[ 12.0% - 12.5% ] 12.28% | 107,338 | 9.9% |
[ 12.5% - 13.0% ] 12.74% | 246,288 | 11.8% |
[ 13.0% - 13.5% ] 13.14% | 27,487 | 12.5% |
[ 13.5% - 14.0% ] 13.73% | 35,130 | 6.5% |
[ 14.0% - 14.5% ] 14.25% | 92,349 | 7.0% |
[ 14.5% - 15.0% ] 14.71% | 66,514 | 5.2% |
[ 15.0% - 15.5% ] 15.15% | 23,170 | 9.4% |
[ 15.5% - 16.0% ] 15.74% | 49,815 | 7.4% |
[ 16.0% - 16.5% ] 16.27% | 35,496 | 7.6% |
[ 16.5% - 17.0% ] 16.65% | 28,996 | 18.9% |
[ 17.0% - 17.5% ] 17.11% | 49,685 | 11.6% |
[ 17.5% - 18.0% ] 17.64% | 2,970 | 2.0% |
[ 18.0% - 18.5% ] 18.10% | 9,518 | 7.5% |
[ 18.5% - 19.0% ] 18.94% | 94,286 | 14.0% |
[ 19.0% - 19.5% ] 19.41% | 12,320 | 14.0% |
[ 20.0% - 20.5% ] 20.32% | 9,324 | 6.7% |
[ 20.5% - 21.0% ] 20.79% | 7,324 | 12.5% |
[ 21.0% - 21.5% ] 21.41% | 3,988 | 4.7% |
[ 21.5% - 22.0% ] 21.87% | 2,154 | 0.75% |
[ 22.0% - 22.5% ] 22.29% | 691 | 31.0% |
[ 23.0% - 23.5% ] 23.34% | 1,474 | 16.9% |
[ 23.5% - 24.0% ] 23.64% | 423 | 26.7% |
[ 25.0% - 25.5% ] 25.37% | 6,425 | 19.1% |
[ 25.5% - 26.0% ] 25.62% | 121 | 17.0% |
[ 26.0% - 26.5% ] 26.32% | 3,104 | 21.7% |
[ 27.5% - 28.0% ] 27.82% | 1,668 | 2.7% |
[ 32.0% - 32.5% ] 32.14% | 224 | 8.0% |
[ 32.5% - 33.0% ] 32.77% | 946 | 37.4% |
[ 33.0% - 33.5% ] 33.13% | 483 | 14.3% |
[ 55.0% - 55.5% ] 55.41% | 915 | 1.8% |
[ 57.0% - 57.5% ] 57.15% | 1,398 | 1.4% |