South American Indian Disability Age 5 to 17

COMPARE

South American Indian
Race
Ancestry
AfghanAfricanAlaska NativeAlaskan AthabascanAlbanianAleutAlsatianAmericanApacheArabArapahoArgentineanArmenianAssyrian/Chaldean/SyriacAustralianAustrianBahamianBangladeshiBarbadianBasqueBelgianBelizeanBermudanBhutaneseBlackfeetBolivianBrazilianBritishBritish West IndianBulgarianBurmeseCajunCambodianCanadianCape VerdeanCarpatho RusynCelticCentral AmericanCentral American IndianCherokeeCheyenneChickasawChileanChineseChippewaChoctawColombianColvilleComancheCosta RicanCreeCreekCroatianCrowCubanCypriotCzechCzechoslovakianDanishDelawareDominicanDutchDutch West IndianEastern EuropeanEcuadorianEgyptianEnglishEstonianEthiopianEuropeanFijianFilipinoFinnishFrenchFrench American IndianFrench CanadianGermanGerman RussianGhanaianGreekGuamanian/ChamorroGuatemalanGuyaneseHaitianHmongHonduranHopiHoumaHungarianIcelanderIndian (Asian)IndonesianInupiatIranianIraqiIrishIroquoisIsraeliItalianJamaicanJapaneseJordanianKenyanKiowaKoreanLaotianLatvianLebaneseLiberianLithuanianLumbeeLuxembourgerMacedonianMalaysianMalteseMarshalleseMenomineeMexicanMexican American IndianMongolianMoroccanNative HawaiianNavajoNepaleseNew ZealanderNicaraguanNigerianNorthern EuropeanNorwegianOkinawanOsageOttawaPaiutePakistaniPalestinianPanamanianParaguayanPennsylvania GermanPeruvianPimaPolishPortuguesePotawatomiPuebloPuerto RicanPuget Sound SalishRomanianRussianSalvadoranSamoanScandinavianScotch-IrishScottishSeminoleSenegaleseSerbianShoshoneSierra LeoneanSiouxSlavicSlovakSloveneSomaliSouth AfricanSouth AmericanSouth American IndianSoviet UnionSpaniardSpanishSpanish AmericanSpanish American IndianSri LankanSubsaharan AfricanSudaneseSwedishSwissSyrianTaiwaneseThaiTlingit-HaidaTohono O'OdhamTonganTrinidadian and TobagonianTsimshianTurkishU.S. Virgin IslanderUgandanUkrainianUruguayanUteVenezuelanVietnameseWelshWest IndianYakamaYaquiYugoslavianYumanYup'ikZimbabwean
Immigration
NonimmigrantsImmigrantsAfghanistanAfricaAlbaniaArgentinaArmeniaAsiaAustraliaAustriaBahamasBangladeshBarbadosBelarusBelgiumBelizeBoliviaBosnia and HerzegovinaBrazilBulgariaBurma/MyanmarCabo VerdeCambodiaCameroonCanadaCaribbeanCentral AmericaChileChinaColombiaCongoCosta RicaCroatiaCubaCzechoslovakiaDenmarkDominicaDominican RepublicEastern AfricaEastern AsiaEastern EuropeEcuadorEgyptEl SalvadorEnglandEritreaEthiopiaEuropeFijiFranceGermanyGhanaGreeceGrenadaGuatemalaGuyanaHaitiHondurasHong KongHungaryIndiaIndonesiaIranIraqIrelandIsraelItalyJamaicaJapanJordanKazakhstanKenyaKoreaKuwaitLaosLatin AmericaLatviaLebanonLiberiaLithuaniaMalaysiaMexicoMicronesiaMiddle AfricaMoldovaMoroccoNepalNetherlandsNicaraguaNigeriaNorth AmericaNorth MacedoniaNorthern AfricaNorthern EuropeNorwayOceaniaPakistanPanamaPeruPhilippinesPolandPortugalRomaniaRussiaSaudi ArabiaScotlandSenegalSerbiaSierra LeoneSingaporeSomaliaSouth AfricaSouth AmericaSouth Central AsiaSouth Eastern AsiaSouthern EuropeSpainSri LankaSt. Vincent and the GrenadinesSudanSwedenSwitzerlandSyriaTaiwanThailandTrinidad and TobagoTurkeyUgandaUkraineUruguayUzbekistanVenezuelaVietnamWest IndiesWestern AfricaWestern AsiaWestern EuropeYemenZaireZimbabweAzores
Select to Compare
Race
Ancestry
AfghanAfricanAlaska NativeAlaskan AthabascanAlbanianAleutAlsatianAmericanApacheArabArapahoArgentineanArmenianAssyrian/Chaldean/SyriacAustralianAustrianBahamianBangladeshiBarbadianBasqueBelgianBelizeanBermudanBhutaneseBlackfeetBolivianBrazilianBritishBritish West IndianBulgarianBurmeseCajunCambodianCanadianCape VerdeanCarpatho RusynCelticCentral AmericanCentral American IndianCherokeeCheyenneChickasawChileanChineseChippewaChoctawColombianColvilleComancheCosta RicanCreeCreekCroatianCrowCubanCypriotCzechCzechoslovakianDanishDelawareDominicanDutchDutch West IndianEastern EuropeanEcuadorianEgyptianEnglishEstonianEthiopianEuropeanFijianFilipinoFinnishFrenchFrench American IndianFrench CanadianGermanGerman RussianGhanaianGreekGuamanian/ChamorroGuatemalanGuyaneseHaitianHmongHonduranHopiHoumaHungarianIcelanderIndian (Asian)IndonesianInupiatIranianIraqiIrishIroquoisIsraeliItalianJamaicanJapaneseJordanianKenyanKiowaKoreanLaotianLatvianLebaneseLiberianLithuanianLumbeeLuxembourgerMacedonianMalaysianMalteseMarshalleseMenomineeMexicanMexican American IndianMongolianMoroccanNative HawaiianNavajoNepaleseNew ZealanderNicaraguanNigerianNorthern EuropeanNorwegianOkinawanOsageOttawaPaiutePakistaniPalestinianPanamanianParaguayanPennsylvania GermanPeruvianPimaPolishPortuguesePotawatomiPuebloPuerto RicanPuget Sound SalishRomanianRussianSalvadoranSamoanScandinavianScotch-IrishScottishSeminoleSenegaleseSerbianShoshoneSierra LeoneanSiouxSlavicSlovakSloveneSomaliSouth AfricanSouth AmericanSoviet UnionSpaniardSpanishSpanish AmericanSpanish American IndianSri LankanSubsaharan AfricanSudaneseSwedishSwissSyrianTaiwaneseThaiTlingit-HaidaTohono O'OdhamTonganTrinidadian and TobagonianTsimshianTurkishU.S. Virgin IslanderUgandanUkrainianUruguayanUteVenezuelanVietnameseWelshWest IndianYakamaYaquiYugoslavianYumanYup'ikZimbabwean
Immigration
NonimmigrantsImmigrantsAfghanistanAfricaAlbaniaArgentinaArmeniaAsiaAustraliaAustriaBahamasBangladeshBarbadosBelarusBelgiumBelizeBoliviaBosnia and HerzegovinaBrazilBulgariaBurma/MyanmarCabo VerdeCambodiaCameroonCanadaCaribbeanCentral AmericaChileChinaColombiaCongoCosta RicaCroatiaCubaCzechoslovakiaDenmarkDominicaDominican RepublicEastern AfricaEastern AsiaEastern EuropeEcuadorEgyptEl SalvadorEnglandEritreaEthiopiaEuropeFijiFranceGermanyGhanaGreeceGrenadaGuatemalaGuyanaHaitiHondurasHong KongHungaryIndiaIndonesiaIranIraqIrelandIsraelItalyJamaicaJapanJordanKazakhstanKenyaKoreaKuwaitLaosLatin AmericaLatviaLebanonLiberiaLithuaniaMalaysiaMexicoMicronesiaMiddle AfricaMoldovaMoroccoNepalNetherlandsNicaraguaNigeriaNorth AmericaNorth MacedoniaNorthern AfricaNorthern EuropeNorwayOceaniaPakistanPanamaPeruPhilippinesPolandPortugalRomaniaRussiaSaudi ArabiaScotlandSenegalSerbiaSierra LeoneSingaporeSomaliaSouth AfricaSouth AmericaSouth Central AsiaSouth Eastern AsiaSouthern EuropeSpainSri LankaSt. Vincent and the GrenadinesSudanSwedenSwitzerlandSyriaTaiwanThailandTrinidad and TobagoTurkeyUgandaUkraineUruguayUzbekistanVenezuelaVietnamWest IndiesWestern AfricaWestern AsiaWestern EuropeYemenZaireZimbabweAzores
Disability Age 5 to 17
Income
Poverty
Unemployment
Labor Participation
Family Structure
Vehicle Availability
Education Level
Disability

South American Indian Disability Age 5 to 17
Excellent

5.5%
DISABILITY | AGE 5 TO 17
89.3/ 100
METRIC RATING
141st/ 347
METRIC RANK

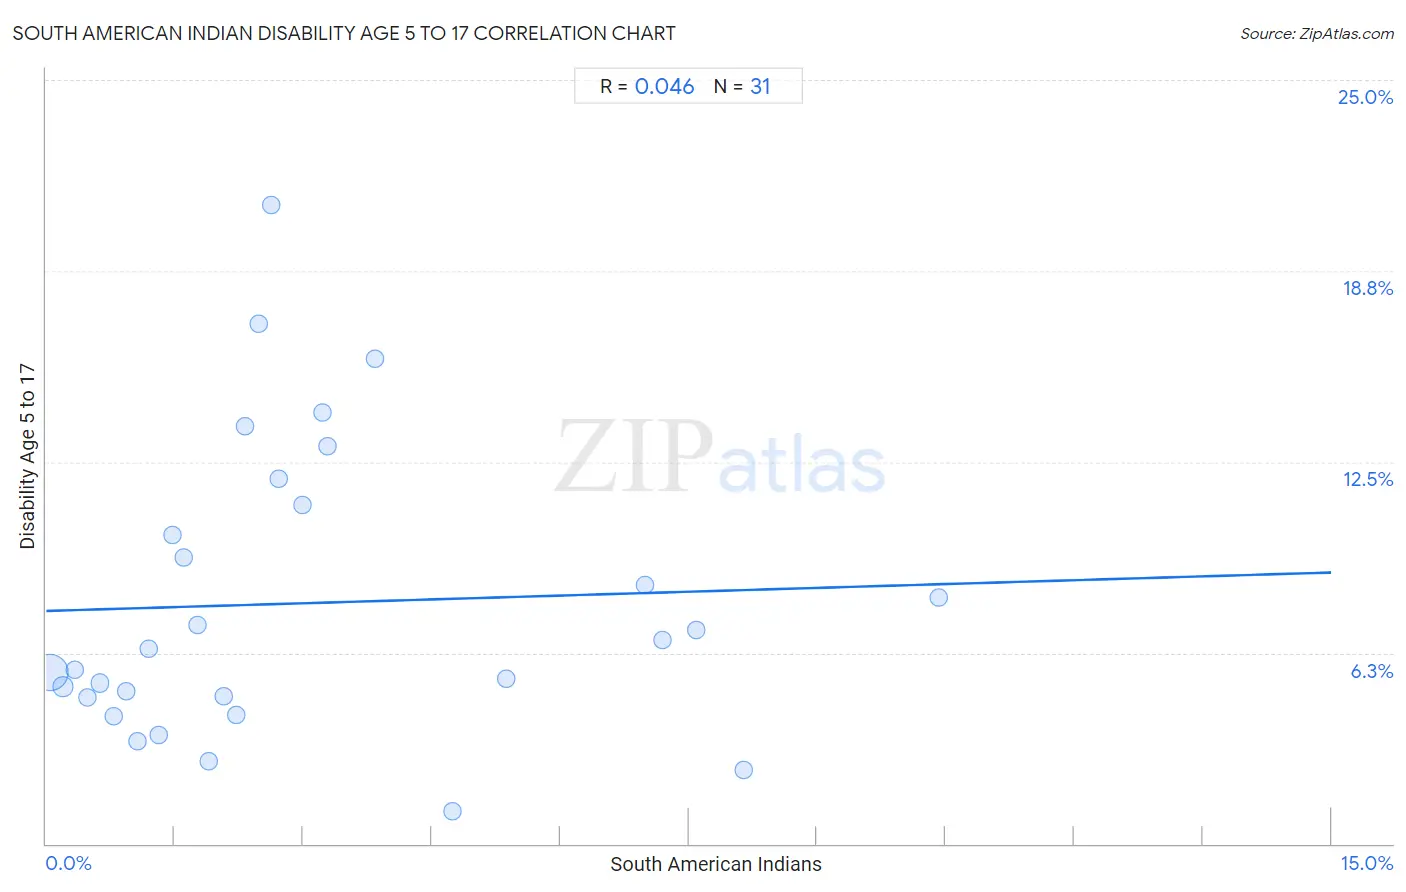
South American Indian Disability Age 5 to 17 Correlation Chart

The statistical analysis conducted on geographies consisting of 164,285,003 people shows no correlation between the proportion of South American Indians and percentage of population with a disability between the ages 5 and 17 in the United States with a correlation coefficient (R) of 0.046 and weighted average of 5.5%. On average, for every 1% (one percent) increase in South American Indians within a typical geography, there is an increase of 0.084% in percentage of population with a disability between the ages 5 and 17.
South American Indian Disability Age 5 to 17
It is essential to understand that the correlation between the percentage of South American Indians and percentage of population with a disability between the ages 5 and 17 does not imply a direct cause-and-effect relationship. It remains uncertain whether the presence of South American Indians influences an upward or downward trend in the level of percentage of population with a disability between the ages 5 and 17 within an area, or if South American Indians simply ended up residing in those areas with higher or lower levels of percentage of population with a disability between the ages 5 and 17 due to other factors.

Demographics Similar to South American Indians by Disability Age 5 to 17

In terms of disability age 5 to 17, the demographic groups most similar to South American Indians are Colombian (5.5%, a difference of 0.15%), Immigrants from Netherlands (5.4%, a difference of 0.17%), Immigrants from Hungary (5.5%, a difference of 0.17%), Immigrants from Oceania (5.4%, a difference of 0.22%), and Belizean (5.4%, a difference of 0.22%).
DemographicsRating | RankDisability Age 5 to 17
Yuman
92.3
/100
|
#134
Exceptional
5.4%
Immigrants from Belize
91.7
/100
|
#135
Exceptional
5.4%
Immigrants from Denmark
91.4
/100
|
#136
Exceptional
5.4%
Navajo
90.9
/100
|
#137
Exceptional
5.4%
Immigrants from Oceania
90.8
/100
|
#138
Exceptional
5.4%
Belizeans
90.8
/100
|
#139
Exceptional
5.4%
Immigrants from Netherlands
90.5
/100
|
#140
Exceptional
5.4%
South American Indians
89.3
/100
|
#141
Excellent
5.5%
Colombians
88.0
/100
|
#142
Excellent
5.5%
Immigrants from Hungary
87.9
/100
|
#143
Excellent
5.5%
Pakistanis
87.3
/100
|
#144
Excellent
5.5%
Immigrants from Guatemala
86.6
/100
|
#145
Excellent
5.5%
Albanians
83.7
/100
|
#146
Excellent
5.5%
Immigrants from Albania
83.1
/100
|
#147
Excellent
5.5%
Samoans
81.9
/100
|
#148
Excellent
5.5%

South American Indian Disability Age 5 to 17 Correlation Summary

MeasurementSouth American Indian DataDisability Age 5 to 17 Data
Minimum0.038%1.1%
Maximum10.4%20.9%
Range10.4%19.8%
Mean3.0%7.9%
Median2.2%6.4%
Interquartile 25% (IQ1)1.1%4.8%
Interquartile 75% (IQ3)3.8%11.1%
Interquartile Range (IQR)2.8%6.3%
Standard Deviation (Sample)2.6%4.8%
Standard Deviation (Population)2.6%4.7%

Correlation Details

South American Indian PercentileSample SizeDisability Age 5 to 17
[
0.0%
-
0.5%
]
0.038%
145,729,5925.6%
[
0.0%
-
0.5%
]
0.20%
12,398,8955.1%
[
0.0%
-
0.5%
]
0.33%
3,258,0205.7%
[
0.0%
-
0.5%
]
0.48%
1,008,3394.8%
[
0.5%
-
1.0%
]
0.63%
847,5335.3%
[
0.5%
-
1.0%
]
0.78%
343,0334.2%
[
0.5%
-
1.0%
]
0.93%
109,8835.0%
[
1.0%
-
1.5%
]
1.07%
207,6883.3%
[
1.0%
-
1.5%
]
1.19%
102,6666.4%
[
1.0%
-
1.5%
]
1.32%
113,9983.6%
[
1.0%
-
1.5%
]
1.48%
34,88710.1%
[
1.5%
-
2.0%
]
1.60%
16,7039.4%
[
1.5%
-
2.0%
]
1.76%
19,4807.2%
[
1.5%
-
2.0%
]
1.90%
11,4482.7%
[
2.0%
-
2.5%
]
2.07%
2,4194.8%
[
2.0%
-
2.5%
]
2.22%
33,6914.2%
[
2.0%
-
2.5%
]
2.33%
1,59013.7%
[
2.0%
-
2.5%
]
2.48%
12117.0%
[
2.5%
-
3.0%
]
2.63%
1,67620.9%
[
2.5%
-
3.0%
]
2.71%
14,23511.9%
[
2.5%
-
3.0%
]
2.99%
1,17211.1%
[
3.0%
-
3.5%
]
3.22%
11,97114.1%
[
3.0%
-
3.5%
]
3.29%
1,03513.0%
[
3.5%
-
4.0%
]
3.84%
3,88315.9%
[
4.5%
-
5.0%
]
4.74%
2,8291.1%
[
5.0%
-
5.5%
]
5.37%
1,3595.4%
[
6.5%
-
7.0%
]
6.98%
3,7818.5%
[
7.0%
-
7.5%
]
7.20%
6256.7%
[
7.5%
-
8.0%
]
7.58%
9637.0%
[
8.0%
-
8.5%
]
8.14%
1,0562.4%
[
10.0%
-
10.5%
]
10.42%
4328.0%