Hawaiian Disability Age 5 to 17
COMPARE
Hawaiian
Select to Compare
Disability Age 5 to 17
Hawaiian Disability Age 5 to 17
5.5%
DISABILITY | AGE 5 TO 17
78.0/ 100
METRIC RATING
156th/ 347
METRIC RANK
Hawaiian Disability Age 5 to 17 Correlation Chart
The statistical analysis conducted on geographies consisting of 325,545,332 people shows a poor negative correlation between the proportion of Hawaiians and percentage of population with a disability between the ages 5 and 17 in the United States with a correlation coefficient (R) of -0.145 and weighted average of 5.5%. On average, for every 1% (one percent) increase in Hawaiians within a typical geography, there is a decrease of 0.017% in percentage of population with a disability between the ages 5 and 17.
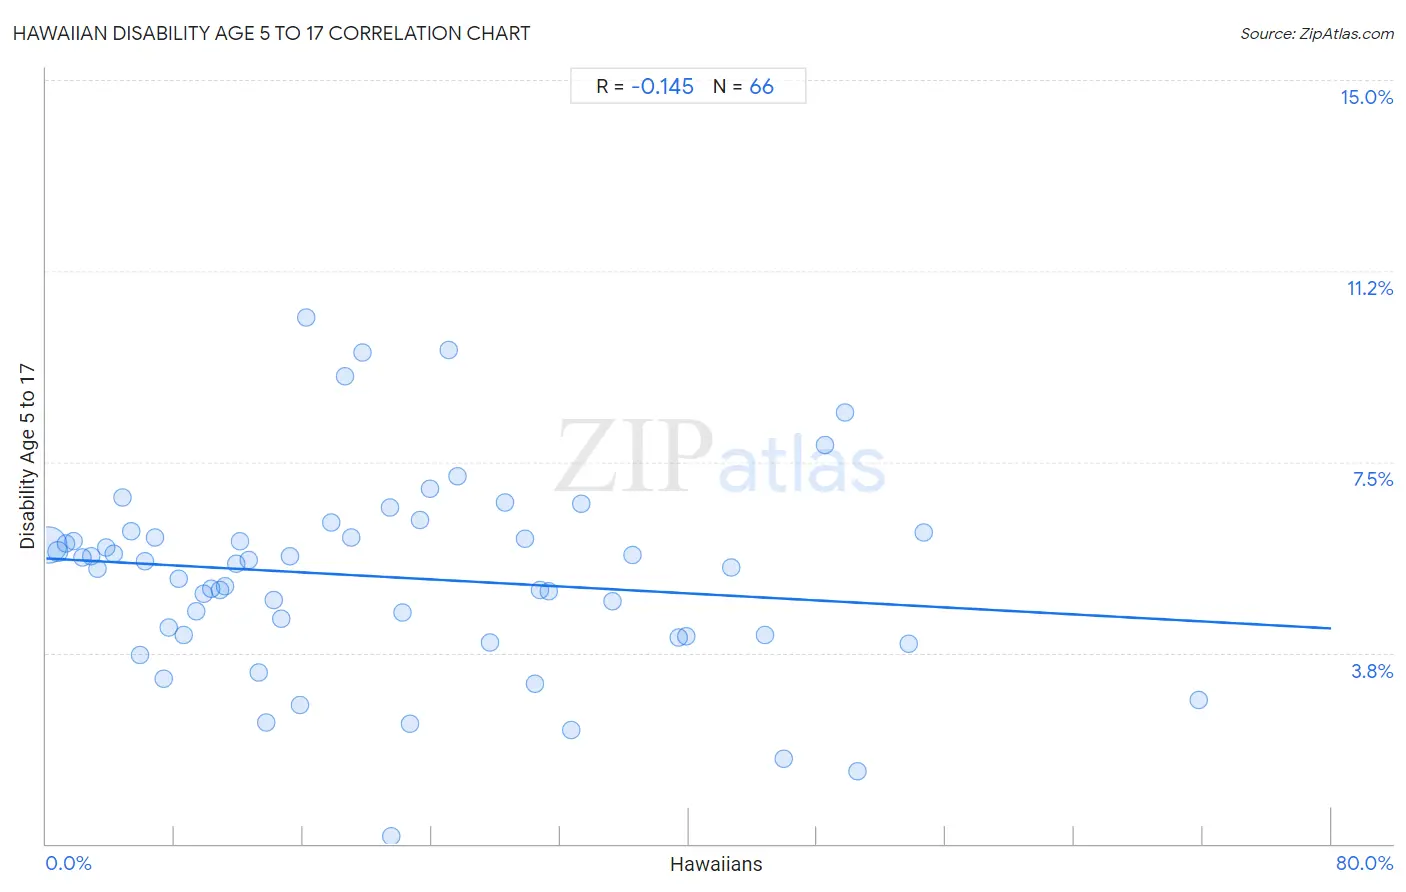
It is essential to understand that the correlation between the percentage of Hawaiians and percentage of population with a disability between the ages 5 and 17 does not imply a direct cause-and-effect relationship. It remains uncertain whether the presence of Hawaiians influences an upward or downward trend in the level of percentage of population with a disability between the ages 5 and 17 within an area, or if Hawaiians simply ended up residing in those areas with higher or lower levels of percentage of population with a disability between the ages 5 and 17 due to other factors.
Demographics Similar to Hawaiians by Disability Age 5 to 17
In terms of disability age 5 to 17, the demographic groups most similar to Hawaiians are Immigrants from Costa Rica (5.5%, a difference of 0.010%), Immigrants from Ecuador (5.5%, a difference of 0.020%), Australian (5.5%, a difference of 0.060%), Immigrants from Nepal (5.5%, a difference of 0.060%), and Ecuadorian (5.5%, a difference of 0.13%).
| Demographics | Rating | Rank | Disability Age 5 to 17 |
| Central Americans | 81.6 /100 | #149 | Excellent 5.5% |
| Guatemalans | 81.5 /100 | #150 | Excellent 5.5% |
| Estonians | 80.8 /100 | #151 | Excellent 5.5% |
| Ute | 80.6 /100 | #152 | Excellent 5.5% |
| Ecuadorians | 79.7 /100 | #153 | Good 5.5% |
| Australians | 78.8 /100 | #154 | Good 5.5% |
| Immigrants from Ecuador | 78.3 /100 | #155 | Good 5.5% |
| Hawaiians | 78.0 /100 | #156 | Good 5.5% |
| Immigrants from Costa Rica | 77.9 /100 | #157 | Good 5.5% |
| Immigrants from Nepal | 77.1 /100 | #158 | Good 5.5% |
| Immigrants from Zimbabwe | 75.3 /100 | #159 | Good 5.5% |
| South Africans | 73.3 /100 | #160 | Good 5.5% |
| Immigrants from Saudi Arabia | 69.1 /100 | #161 | Good 5.5% |
| Zimbabweans | 67.2 /100 | #162 | Good 5.5% |
| Immigrants from Southern Europe | 64.0 /100 | #163 | Good 5.6% |
Hawaiian Disability Age 5 to 17 Correlation Summary
| Measurement | Hawaiian Data | Disability Age 5 to 17 Data |
| Minimum | 0.13% | 0.15% |
| Maximum | 71.7% | 10.3% |
| Range | 71.6% | 10.2% |
| Mean | 21.1% | 5.2% |
| Median | 17.0% | 5.5% |
| Interquartile 25% (IQ1) | 8.2% | 4.1% |
| Interquartile 75% (IQ3) | 30.8% | 6.0% |
| Interquartile Range (IQR) | 22.5% | 1.9% |
| Standard Deviation (Sample) | 16.2% | 1.9% |
| Standard Deviation (Population) | 16.0% | 1.9% |
Correlation Details
| Hawaiian Percentile | Sample Size | Disability Age 5 to 17 |
[ 0.0% - 0.5% ] 0.13% | 277,760,343 | 5.9% |
[ 0.5% - 1.0% ] 0.71% | 27,680,194 | 5.7% |
[ 1.0% - 1.5% ] 1.22% | 8,061,759 | 5.9% |
[ 1.5% - 2.0% ] 1.73% | 4,556,396 | 6.0% |
[ 2.0% - 2.5% ] 2.23% | 1,344,286 | 5.6% |
[ 2.5% - 3.0% ] 2.78% | 1,228,579 | 5.7% |
[ 3.0% - 3.5% ] 3.22% | 851,880 | 5.4% |
[ 3.5% - 4.0% ] 3.73% | 518,995 | 5.8% |
[ 4.0% - 4.5% ] 4.19% | 462,696 | 5.7% |
[ 4.5% - 5.0% ] 4.73% | 342,397 | 6.8% |
[ 5.0% - 5.5% ] 5.28% | 199,844 | 6.1% |
[ 5.5% - 6.0% ] 5.86% | 69,048 | 3.7% |
[ 6.0% - 6.5% ] 6.13% | 108,251 | 5.6% |
[ 6.5% - 7.0% ] 6.78% | 160,341 | 6.0% |
[ 7.0% - 7.5% ] 7.31% | 327,302 | 3.2% |
[ 7.5% - 8.0% ] 7.65% | 120,282 | 4.2% |
[ 8.0% - 8.5% ] 8.23% | 85,245 | 5.2% |
[ 8.5% - 9.0% ] 8.53% | 377,500 | 4.1% |
[ 9.0% - 9.5% ] 9.33% | 133,512 | 4.6% |
[ 9.5% - 10.0% ] 9.78% | 125,773 | 4.9% |
[ 10.0% - 10.5% ] 10.29% | 90,896 | 5.0% |
[ 10.5% - 11.0% ] 10.78% | 179,075 | 5.0% |
[ 11.0% - 11.5% ] 11.13% | 14,411 | 5.1% |
[ 11.5% - 12.0% ] 11.83% | 77,689 | 5.5% |
[ 12.0% - 12.5% ] 12.07% | 65,702 | 5.9% |
[ 12.5% - 13.0% ] 12.64% | 41,336 | 5.6% |
[ 13.0% - 13.5% ] 13.23% | 95,035 | 3.4% |
[ 13.5% - 14.0% ] 13.73% | 25,506 | 2.4% |
[ 14.0% - 14.5% ] 14.14% | 124,786 | 4.8% |
[ 14.5% - 15.0% ] 14.63% | 70,200 | 4.4% |
[ 15.0% - 15.5% ] 15.15% | 3,590 | 5.7% |
[ 15.5% - 16.0% ] 15.78% | 16,898 | 2.7% |
[ 16.0% - 16.5% ] 16.21% | 7,704 | 10.3% |
[ 17.5% - 18.0% ] 17.71% | 1,592 | 6.3% |
[ 18.5% - 19.0% ] 18.62% | 7,198 | 9.2% |
[ 19.0% - 19.5% ] 19.00% | 2,489 | 6.0% |
[ 19.5% - 20.0% ] 19.70% | 7,436 | 9.6% |
[ 21.0% - 21.5% ] 21.39% | 2,211 | 6.6% |
[ 21.5% - 22.0% ] 21.52% | 3,221 | 0.15% |
[ 22.0% - 22.5% ] 22.19% | 6,626 | 4.5% |
[ 22.5% - 23.0% ] 22.66% | 11,029 | 2.4% |
[ 23.0% - 23.5% ] 23.27% | 2,742 | 6.4% |
[ 23.5% - 24.0% ] 23.91% | 4,555 | 7.0% |
[ 25.0% - 25.5% ] 25.04% | 1,278 | 9.7% |
[ 25.5% - 26.0% ] 25.61% | 5,267 | 7.2% |
[ 27.5% - 28.0% ] 27.65% | 8,710 | 3.9% |
[ 28.5% - 29.0% ] 28.59% | 1,462 | 6.7% |
[ 29.5% - 30.0% ] 29.77% | 6,694 | 6.0% |
[ 30.0% - 30.5% ] 30.47% | 2,872 | 3.1% |
[ 30.5% - 31.0% ] 30.76% | 2,971 | 5.0% |
[ 31.0% - 31.5% ] 31.25% | 5,891 | 5.0% |
[ 32.5% - 33.0% ] 32.69% | 10,307 | 2.2% |
[ 33.0% - 33.5% ] 33.33% | 465 | 6.7% |
[ 35.0% - 35.5% ] 35.24% | 4,827 | 4.8% |
[ 36.5% - 37.0% ] 36.53% | 3,553 | 5.7% |
[ 39.0% - 39.5% ] 39.37% | 10,042 | 4.0% |
[ 39.5% - 40.0% ] 39.87% | 4,475 | 4.1% |
[ 42.5% - 43.0% ] 42.64% | 12,114 | 5.4% |
[ 44.5% - 45.0% ] 44.73% | 65,116 | 4.1% |
[ 45.5% - 46.0% ] 45.93% | 3,412 | 1.7% |
[ 48.0% - 48.5% ] 48.46% | 130 | 7.8% |
[ 49.5% - 50.0% ] 49.74% | 380 | 8.5% |
[ 50.0% - 50.5% ] 50.47% | 2,853 | 1.4% |
[ 53.5% - 54.0% ] 53.69% | 2,157 | 3.9% |
[ 54.5% - 55.0% ] 54.63% | 12,370 | 6.1% |
[ 71.5% - 72.0% ] 71.73% | 1,436 | 2.8% |