Belgian Disability Age 5 to 17

COMPARE

Belgian
Race
Ancestry
AfghanAfricanAlaska NativeAlaskan AthabascanAlbanianAleutAlsatianAmericanApacheArabArapahoArgentineanArmenianAssyrian/Chaldean/SyriacAustralianAustrianBahamianBangladeshiBarbadianBasqueBelgianBelizeanBermudanBhutaneseBlackfeetBolivianBrazilianBritishBritish West IndianBulgarianBurmeseCajunCambodianCanadianCape VerdeanCarpatho RusynCelticCentral AmericanCentral American IndianCherokeeCheyenneChickasawChileanChineseChippewaChoctawColombianColvilleComancheCosta RicanCreeCreekCroatianCrowCubanCypriotCzechCzechoslovakianDanishDelawareDominicanDutchDutch West IndianEastern EuropeanEcuadorianEgyptianEnglishEstonianEthiopianEuropeanFijianFilipinoFinnishFrenchFrench American IndianFrench CanadianGermanGerman RussianGhanaianGreekGuamanian/ChamorroGuatemalanGuyaneseHaitianHmongHonduranHopiHoumaHungarianIcelanderIndian (Asian)IndonesianInupiatIranianIraqiIrishIroquoisIsraeliItalianJamaicanJapaneseJordanianKenyanKiowaKoreanLaotianLatvianLebaneseLiberianLithuanianLumbeeLuxembourgerMacedonianMalaysianMalteseMarshalleseMenomineeMexicanMexican American IndianMongolianMoroccanNative HawaiianNavajoNepaleseNew ZealanderNicaraguanNigerianNorthern EuropeanNorwegianOkinawanOsageOttawaPaiutePakistaniPalestinianPanamanianParaguayanPennsylvania GermanPeruvianPimaPolishPortuguesePotawatomiPuebloPuerto RicanPuget Sound SalishRomanianRussianSalvadoranSamoanScandinavianScotch-IrishScottishSeminoleSenegaleseSerbianShoshoneSierra LeoneanSiouxSlavicSlovakSloveneSomaliSouth AfricanSouth AmericanSouth American IndianSoviet UnionSpaniardSpanishSpanish AmericanSpanish American IndianSri LankanSubsaharan AfricanSudaneseSwedishSwissSyrianTaiwaneseThaiTlingit-HaidaTohono O'OdhamTonganTrinidadian and TobagonianTsimshianTurkishU.S. Virgin IslanderUgandanUkrainianUruguayanUteVenezuelanVietnameseWelshWest IndianYakamaYaquiYugoslavianYumanYup'ikZimbabwean
Immigration
NonimmigrantsImmigrantsAfghanistanAfricaAlbaniaArgentinaArmeniaAsiaAustraliaAustriaBahamasBangladeshBarbadosBelarusBelgiumBelizeBoliviaBosnia and HerzegovinaBrazilBulgariaBurma/MyanmarCabo VerdeCambodiaCameroonCanadaCaribbeanCentral AmericaChileChinaColombiaCongoCosta RicaCroatiaCubaCzechoslovakiaDenmarkDominicaDominican RepublicEastern AfricaEastern AsiaEastern EuropeEcuadorEgyptEl SalvadorEnglandEritreaEthiopiaEuropeFijiFranceGermanyGhanaGreeceGrenadaGuatemalaGuyanaHaitiHondurasHong KongHungaryIndiaIndonesiaIranIraqIrelandIsraelItalyJamaicaJapanJordanKazakhstanKenyaKoreaKuwaitLaosLatin AmericaLatviaLebanonLiberiaLithuaniaMalaysiaMexicoMicronesiaMiddle AfricaMoldovaMoroccoNepalNetherlandsNicaraguaNigeriaNorth AmericaNorth MacedoniaNorthern AfricaNorthern EuropeNorwayOceaniaPakistanPanamaPeruPhilippinesPolandPortugalRomaniaRussiaSaudi ArabiaScotlandSenegalSerbiaSierra LeoneSingaporeSomaliaSouth AfricaSouth AmericaSouth Central AsiaSouth Eastern AsiaSouthern EuropeSpainSri LankaSt. Vincent and the GrenadinesSudanSwedenSwitzerlandSyriaTaiwanThailandTrinidad and TobagoTurkeyUgandaUkraineUruguayUzbekistanVenezuelaVietnamWest IndiesWestern AfricaWestern AsiaWestern EuropeYemenZaireZimbabweAzores
Select to Compare
Race
Ancestry
AfghanAfricanAlaska NativeAlaskan AthabascanAlbanianAleutAlsatianAmericanApacheArabArapahoArgentineanArmenianAssyrian/Chaldean/SyriacAustralianAustrianBahamianBangladeshiBarbadianBasqueBelizeanBermudanBhutaneseBlackfeetBolivianBrazilianBritishBritish West IndianBulgarianBurmeseCajunCambodianCanadianCape VerdeanCarpatho RusynCelticCentral AmericanCentral American IndianCherokeeCheyenneChickasawChileanChineseChippewaChoctawColombianColvilleComancheCosta RicanCreeCreekCroatianCrowCubanCypriotCzechCzechoslovakianDanishDelawareDominicanDutchDutch West IndianEastern EuropeanEcuadorianEgyptianEnglishEstonianEthiopianEuropeanFijianFilipinoFinnishFrenchFrench American IndianFrench CanadianGermanGerman RussianGhanaianGreekGuamanian/ChamorroGuatemalanGuyaneseHaitianHmongHonduranHopiHoumaHungarianIcelanderIndian (Asian)IndonesianInupiatIranianIraqiIrishIroquoisIsraeliItalianJamaicanJapaneseJordanianKenyanKiowaKoreanLaotianLatvianLebaneseLiberianLithuanianLumbeeLuxembourgerMacedonianMalaysianMalteseMarshalleseMenomineeMexicanMexican American IndianMongolianMoroccanNative HawaiianNavajoNepaleseNew ZealanderNicaraguanNigerianNorthern EuropeanNorwegianOkinawanOsageOttawaPaiutePakistaniPalestinianPanamanianParaguayanPennsylvania GermanPeruvianPimaPolishPortuguesePotawatomiPuebloPuerto RicanPuget Sound SalishRomanianRussianSalvadoranSamoanScandinavianScotch-IrishScottishSeminoleSenegaleseSerbianShoshoneSierra LeoneanSiouxSlavicSlovakSloveneSomaliSouth AfricanSouth AmericanSouth American IndianSoviet UnionSpaniardSpanishSpanish AmericanSpanish American IndianSri LankanSubsaharan AfricanSudaneseSwedishSwissSyrianTaiwaneseThaiTlingit-HaidaTohono O'OdhamTonganTrinidadian and TobagonianTsimshianTurkishU.S. Virgin IslanderUgandanUkrainianUruguayanUteVenezuelanVietnameseWelshWest IndianYakamaYaquiYugoslavianYumanYup'ikZimbabwean
Immigration
NonimmigrantsImmigrantsAfghanistanAfricaAlbaniaArgentinaArmeniaAsiaAustraliaAustriaBahamasBangladeshBarbadosBelarusBelgiumBelizeBoliviaBosnia and HerzegovinaBrazilBulgariaBurma/MyanmarCabo VerdeCambodiaCameroonCanadaCaribbeanCentral AmericaChileChinaColombiaCongoCosta RicaCroatiaCubaCzechoslovakiaDenmarkDominicaDominican RepublicEastern AfricaEastern AsiaEastern EuropeEcuadorEgyptEl SalvadorEnglandEritreaEthiopiaEuropeFijiFranceGermanyGhanaGreeceGrenadaGuatemalaGuyanaHaitiHondurasHong KongHungaryIndiaIndonesiaIranIraqIrelandIsraelItalyJamaicaJapanJordanKazakhstanKenyaKoreaKuwaitLaosLatin AmericaLatviaLebanonLiberiaLithuaniaMalaysiaMexicoMicronesiaMiddle AfricaMoldovaMoroccoNepalNetherlandsNicaraguaNigeriaNorth AmericaNorth MacedoniaNorthern AfricaNorthern EuropeNorwayOceaniaPakistanPanamaPeruPhilippinesPolandPortugalRomaniaRussiaSaudi ArabiaScotlandSenegalSerbiaSierra LeoneSingaporeSomaliaSouth AfricaSouth AmericaSouth Central AsiaSouth Eastern AsiaSouthern EuropeSpainSri LankaSt. Vincent and the GrenadinesSudanSwedenSwitzerlandSyriaTaiwanThailandTrinidad and TobagoTurkeyUgandaUkraineUruguayUzbekistanVenezuelaVietnamWest IndiesWestern AfricaWestern AsiaWestern EuropeYemenZaireZimbabweAzores
Disability Age 5 to 17
Income
Poverty
Unemployment
Labor Participation
Family Structure
Vehicle Availability
Education Level
Disability

Belgian Disability Age 5 to 17
Tragic

5.8%
DISABILITY | AGE 5 TO 17
6.9/ 100
METRIC RATING
220th/ 347
METRIC RANK

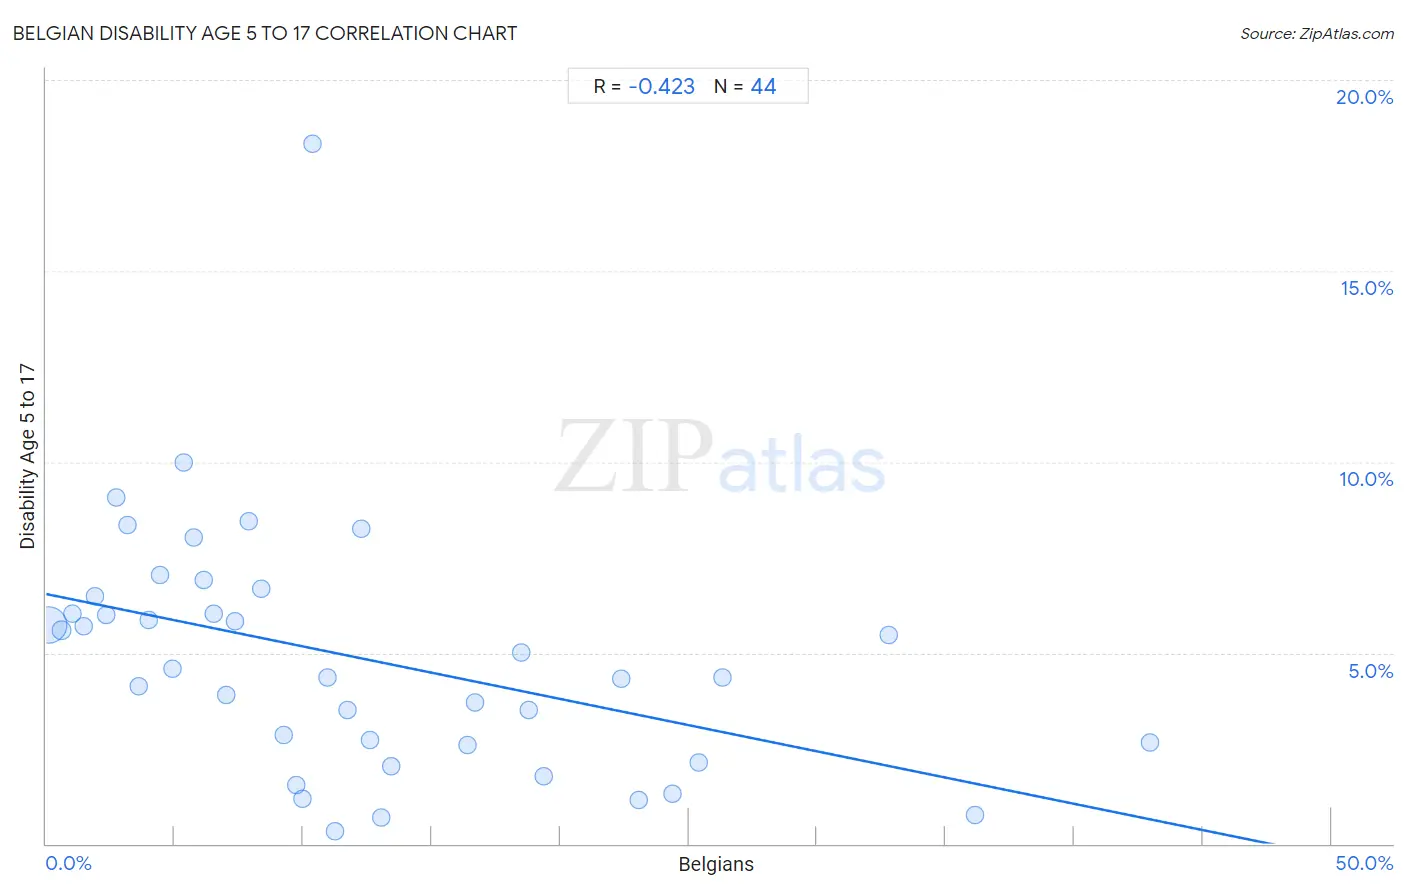
Belgian Disability Age 5 to 17 Correlation Chart

The statistical analysis conducted on geographies consisting of 352,796,896 people shows a moderate negative correlation between the proportion of Belgians and percentage of population with a disability between the ages 5 and 17 in the United States with a correlation coefficient (R) of -0.423 and weighted average of 5.8%. On average, for every 1% (one percent) increase in Belgians within a typical geography, there is a decrease of 0.14% in percentage of population with a disability between the ages 5 and 17.
Belgian Disability Age 5 to 17
It is essential to understand that the correlation between the percentage of Belgians and percentage of population with a disability between the ages 5 and 17 does not imply a direct cause-and-effect relationship. It remains uncertain whether the presence of Belgians influences an upward or downward trend in the level of percentage of population with a disability between the ages 5 and 17 within an area, or if Belgians simply ended up residing in those areas with higher or lower levels of percentage of population with a disability between the ages 5 and 17 due to other factors.

Demographics Similar to Belgians by Disability Age 5 to 17

In terms of disability age 5 to 17, the demographic groups most similar to Belgians are Sierra Leonean (5.8%, a difference of 0.010%), Immigrants from Sierra Leone (5.8%, a difference of 0.030%), Lithuanian (5.8%, a difference of 0.040%), Immigrants from Sudan (5.8%, a difference of 0.040%), and Czech (5.8%, a difference of 0.080%).
DemographicsRating | RankDisability Age 5 to 17
Immigrants from Cameroon
8.3
/100
|
#213
Tragic
5.8%
Immigrants from Morocco
8.3
/100
|
#214
Tragic
5.8%
Swedes
8.1
/100
|
#215
Tragic
5.8%
Nigerians
7.5
/100
|
#216
Tragic
5.8%
Czechs
7.4
/100
|
#217
Tragic
5.8%
Immigrants from Sierra Leone
7.1
/100
|
#218
Tragic
5.8%
Sierra Leoneans
7.0
/100
|
#219
Tragic
5.8%
Belgians
6.9
/100
|
#220
Tragic
5.8%
Lithuanians
6.7
/100
|
#221
Tragic
5.8%
Immigrants from Sudan
6.7
/100
|
#222
Tragic
5.8%
Alsatians
6.0
/100
|
#223
Tragic
5.8%
Mexicans
5.7
/100
|
#224
Tragic
5.8%
Guamanians/Chamorros
5.6
/100
|
#225
Tragic
5.8%
British West Indians
5.4
/100
|
#226
Tragic
5.8%
Swiss
5.1
/100
|
#227
Tragic
5.8%

Belgian Disability Age 5 to 17 Correlation Summary

MeasurementBelgian DataDisability Age 5 to 17 Data
Minimum0.098%0.33%
Maximum42.9%18.3%
Range42.9%18.0%
Mean12.1%4.9%
Median9.8%4.5%
Interquartile 25% (IQ1)4.7%2.6%
Interquartile 75% (IQ3)17.6%6.3%
Interquartile Range (IQR)12.9%3.6%
Standard Deviation (Sample)10.0%3.2%
Standard Deviation (Population)9.9%3.2%

Correlation Details

Belgian PercentileSample SizeDisability Age 5 to 17
[
0.0%
-
0.5%
]
0.098%
333,113,0325.7%
[
0.5%
-
1.0%
]
0.58%
13,111,8045.6%
[
1.0%
-
1.5%
]
1.03%
3,295,8836.0%
[
1.0%
-
1.5%
]
1.46%
1,029,8115.7%
[
1.5%
-
2.0%
]
1.88%
578,1046.5%
[
2.0%
-
2.5%
]
2.34%
366,8396.0%
[
2.5%
-
3.0%
]
2.74%
270,8459.1%
[
3.0%
-
3.5%
]
3.17%
172,2708.4%
[
3.5%
-
4.0%
]
3.59%
108,4504.1%
[
3.5%
-
4.0%
]
3.99%
50,3155.8%
[
4.0%
-
4.5%
]
4.42%
55,1397.0%
[
4.5%
-
5.0%
]
4.93%
156,9354.6%
[
5.0%
-
5.5%
]
5.35%
76,57210.0%
[
5.5%
-
6.0%
]
5.72%
144,8108.0%
[
6.0%
-
6.5%
]
6.13%
25,3086.9%
[
6.5%
-
7.0%
]
6.52%
44,7226.0%
[
7.0%
-
7.5%
]
7.01%
26,6703.9%
[
7.0%
-
7.5%
]
7.33%
16,1655.8%
[
7.5%
-
8.0%
]
7.88%
10,4688.4%
[
8.0%
-
8.5%
]
8.35%
24,2586.7%
[
9.0%
-
9.5%
]
9.24%
38,1312.8%
[
9.5%
-
10.0%
]
9.70%
16,0861.6%
[
9.5%
-
10.0%
]
9.96%
12,1031.2%
[
10.0%
-
10.5%
]
10.37%
65618.3%
[
10.5%
-
11.0%
]
10.93%
2,5614.3%
[
11.0%
-
11.5%
]
11.24%
1,7430.33%
[
11.5%
-
12.0%
]
11.71%
8713.5%
[
12.0%
-
12.5%
]
12.24%
4338.2%
[
12.5%
-
13.0%
]
12.59%
1352.7%
[
13.0%
-
13.5%
]
13.03%
1,4200.69%
[
13.0%
-
13.5%
]
13.44%
9,6482.0%
[
16.0%
-
16.5%
]
16.37%
2,4372.6%
[
16.5%
-
17.0%
]
16.67%
5,2903.7%
[
18.0%
-
18.5%
]
18.46%
3,2445.0%
[
18.5%
-
19.0%
]
18.80%
1,6813.5%
[
19.0%
-
19.5%
]
19.37%
7901.8%
[
22.0%
-
22.5%
]
22.37%
1,4534.3%
[
23.0%
-
23.5%
]
23.06%
4,9261.1%
[
24.0%
-
24.5%
]
24.39%
1,4641.3%
[
25.0%
-
25.5%
]
25.40%
1,0672.1%
[
26.0%
-
26.5%
]
26.31%
7,6364.4%
[
32.5%
-
33.0%
]
32.78%
5985.5%
[
36.0%
-
36.5%
]
36.15%
1,9390.77%
[
42.5%
-
43.0%
]
42.95%
2,1842.7%