Cypriot Disability Age 5 to 17

COMPARE

Cypriot
Race
Ancestry
AfghanAfricanAlaska NativeAlaskan AthabascanAlbanianAleutAlsatianAmericanApacheArabArapahoArgentineanArmenianAssyrian/Chaldean/SyriacAustralianAustrianBahamianBangladeshiBarbadianBasqueBelgianBelizeanBermudanBhutaneseBlackfeetBolivianBrazilianBritishBritish West IndianBulgarianBurmeseCajunCambodianCanadianCape VerdeanCarpatho RusynCelticCentral AmericanCentral American IndianCherokeeCheyenneChickasawChileanChineseChippewaChoctawColombianColvilleComancheCosta RicanCreeCreekCroatianCrowCubanCypriotCzechCzechoslovakianDanishDelawareDominicanDutchDutch West IndianEastern EuropeanEcuadorianEgyptianEnglishEstonianEthiopianEuropeanFijianFilipinoFinnishFrenchFrench American IndianFrench CanadianGermanGerman RussianGhanaianGreekGuamanian/ChamorroGuatemalanGuyaneseHaitianHmongHonduranHopiHoumaHungarianIcelanderIndian (Asian)IndonesianInupiatIranianIraqiIrishIroquoisIsraeliItalianJamaicanJapaneseJordanianKenyanKiowaKoreanLaotianLatvianLebaneseLiberianLithuanianLumbeeLuxembourgerMacedonianMalaysianMalteseMarshalleseMenomineeMexicanMexican American IndianMongolianMoroccanNative HawaiianNavajoNepaleseNew ZealanderNicaraguanNigerianNorthern EuropeanNorwegianOkinawanOsageOttawaPaiutePakistaniPalestinianPanamanianParaguayanPennsylvania GermanPeruvianPimaPolishPortuguesePotawatomiPuebloPuerto RicanPuget Sound SalishRomanianRussianSalvadoranSamoanScandinavianScotch-IrishScottishSeminoleSenegaleseSerbianShoshoneSierra LeoneanSiouxSlavicSlovakSloveneSomaliSouth AfricanSouth AmericanSouth American IndianSoviet UnionSpaniardSpanishSpanish AmericanSpanish American IndianSri LankanSubsaharan AfricanSudaneseSwedishSwissSyrianTaiwaneseThaiTlingit-HaidaTohono O'OdhamTonganTrinidadian and TobagonianTsimshianTurkishU.S. Virgin IslanderUgandanUkrainianUruguayanUteVenezuelanVietnameseWelshWest IndianYakamaYaquiYugoslavianYumanYup'ikZimbabwean
Immigration
NonimmigrantsImmigrantsAfghanistanAfricaAlbaniaArgentinaArmeniaAsiaAustraliaAustriaBahamasBangladeshBarbadosBelarusBelgiumBelizeBoliviaBosnia and HerzegovinaBrazilBulgariaBurma/MyanmarCabo VerdeCambodiaCameroonCanadaCaribbeanCentral AmericaChileChinaColombiaCongoCosta RicaCroatiaCubaCzechoslovakiaDenmarkDominicaDominican RepublicEastern AfricaEastern AsiaEastern EuropeEcuadorEgyptEl SalvadorEnglandEritreaEthiopiaEuropeFijiFranceGermanyGhanaGreeceGrenadaGuatemalaGuyanaHaitiHondurasHong KongHungaryIndiaIndonesiaIranIraqIrelandIsraelItalyJamaicaJapanJordanKazakhstanKenyaKoreaKuwaitLaosLatin AmericaLatviaLebanonLiberiaLithuaniaMalaysiaMexicoMicronesiaMiddle AfricaMoldovaMoroccoNepalNetherlandsNicaraguaNigeriaNorth AmericaNorth MacedoniaNorthern AfricaNorthern EuropeNorwayOceaniaPakistanPanamaPeruPhilippinesPolandPortugalRomaniaRussiaSaudi ArabiaScotlandSenegalSerbiaSierra LeoneSingaporeSomaliaSouth AfricaSouth AmericaSouth Central AsiaSouth Eastern AsiaSouthern EuropeSpainSri LankaSt. Vincent and the GrenadinesSudanSwedenSwitzerlandSyriaTaiwanThailandTrinidad and TobagoTurkeyUgandaUkraineUruguayUzbekistanVenezuelaVietnamWest IndiesWestern AfricaWestern AsiaWestern EuropeYemenZaireZimbabweAzores
Select to Compare
Race
Ancestry
AfghanAfricanAlaska NativeAlaskan AthabascanAlbanianAleutAlsatianAmericanApacheArabArapahoArgentineanArmenianAssyrian/Chaldean/SyriacAustralianAustrianBahamianBangladeshiBarbadianBasqueBelgianBelizeanBermudanBhutaneseBlackfeetBolivianBrazilianBritishBritish West IndianBulgarianBurmeseCajunCambodianCanadianCape VerdeanCarpatho RusynCelticCentral AmericanCentral American IndianCherokeeCheyenneChickasawChileanChineseChippewaChoctawColombianColvilleComancheCosta RicanCreeCreekCroatianCrowCubanCzechCzechoslovakianDanishDelawareDominicanDutchDutch West IndianEastern EuropeanEcuadorianEgyptianEnglishEstonianEthiopianEuropeanFijianFilipinoFinnishFrenchFrench American IndianFrench CanadianGermanGerman RussianGhanaianGreekGuamanian/ChamorroGuatemalanGuyaneseHaitianHmongHonduranHopiHoumaHungarianIcelanderIndian (Asian)IndonesianInupiatIranianIraqiIrishIroquoisIsraeliItalianJamaicanJapaneseJordanianKenyanKiowaKoreanLaotianLatvianLebaneseLiberianLithuanianLumbeeLuxembourgerMacedonianMalaysianMalteseMarshalleseMenomineeMexicanMexican American IndianMongolianMoroccanNative HawaiianNavajoNepaleseNew ZealanderNicaraguanNigerianNorthern EuropeanNorwegianOkinawanOsageOttawaPaiutePakistaniPalestinianPanamanianParaguayanPennsylvania GermanPeruvianPimaPolishPortuguesePotawatomiPuebloPuerto RicanPuget Sound SalishRomanianRussianSalvadoranSamoanScandinavianScotch-IrishScottishSeminoleSenegaleseSerbianShoshoneSierra LeoneanSiouxSlavicSlovakSloveneSomaliSouth AfricanSouth AmericanSouth American IndianSoviet UnionSpaniardSpanishSpanish AmericanSpanish American IndianSri LankanSubsaharan AfricanSudaneseSwedishSwissSyrianTaiwaneseThaiTlingit-HaidaTohono O'OdhamTonganTrinidadian and TobagonianTsimshianTurkishU.S. Virgin IslanderUgandanUkrainianUruguayanUteVenezuelanVietnameseWelshWest IndianYakamaYaquiYugoslavianYumanYup'ikZimbabwean
Immigration
NonimmigrantsImmigrantsAfghanistanAfricaAlbaniaArgentinaArmeniaAsiaAustraliaAustriaBahamasBangladeshBarbadosBelarusBelgiumBelizeBoliviaBosnia and HerzegovinaBrazilBulgariaBurma/MyanmarCabo VerdeCambodiaCameroonCanadaCaribbeanCentral AmericaChileChinaColombiaCongoCosta RicaCroatiaCubaCzechoslovakiaDenmarkDominicaDominican RepublicEastern AfricaEastern AsiaEastern EuropeEcuadorEgyptEl SalvadorEnglandEritreaEthiopiaEuropeFijiFranceGermanyGhanaGreeceGrenadaGuatemalaGuyanaHaitiHondurasHong KongHungaryIndiaIndonesiaIranIraqIrelandIsraelItalyJamaicaJapanJordanKazakhstanKenyaKoreaKuwaitLaosLatin AmericaLatviaLebanonLiberiaLithuaniaMalaysiaMexicoMicronesiaMiddle AfricaMoldovaMoroccoNepalNetherlandsNicaraguaNigeriaNorth AmericaNorth MacedoniaNorthern AfricaNorthern EuropeNorwayOceaniaPakistanPanamaPeruPhilippinesPolandPortugalRomaniaRussiaSaudi ArabiaScotlandSenegalSerbiaSierra LeoneSingaporeSomaliaSouth AfricaSouth AmericaSouth Central AsiaSouth Eastern AsiaSouthern EuropeSpainSri LankaSt. Vincent and the GrenadinesSudanSwedenSwitzerlandSyriaTaiwanThailandTrinidad and TobagoTurkeyUgandaUkraineUruguayUzbekistanVenezuelaVietnamWest IndiesWestern AfricaWestern AsiaWestern EuropeYemenZaireZimbabweAzores
Disability Age 5 to 17
Income
Poverty
Unemployment
Labor Participation
Family Structure
Vehicle Availability
Education Level
Disability

Cypriot Disability Age 5 to 17
Exceptional

5.3%
DISABILITY | AGE 5 TO 17
97.7/ 100
METRIC RATING
116th/ 347
METRIC RANK

Cypriot Disability Age 5 to 17 Correlation Chart

The statistical analysis conducted on geographies consisting of 61,709,626 people shows a mild positive correlation between the proportion of Cypriots and percentage of population with a disability between the ages 5 and 17 in the United States with a correlation coefficient (R) of 0.334 and weighted average of 5.3%. On average, for every 1% (one percent) increase in Cypriots within a typical geography, there is an increase of 1.8% in percentage of population with a disability between the ages 5 and 17.
Cypriot Disability Age 5 to 17
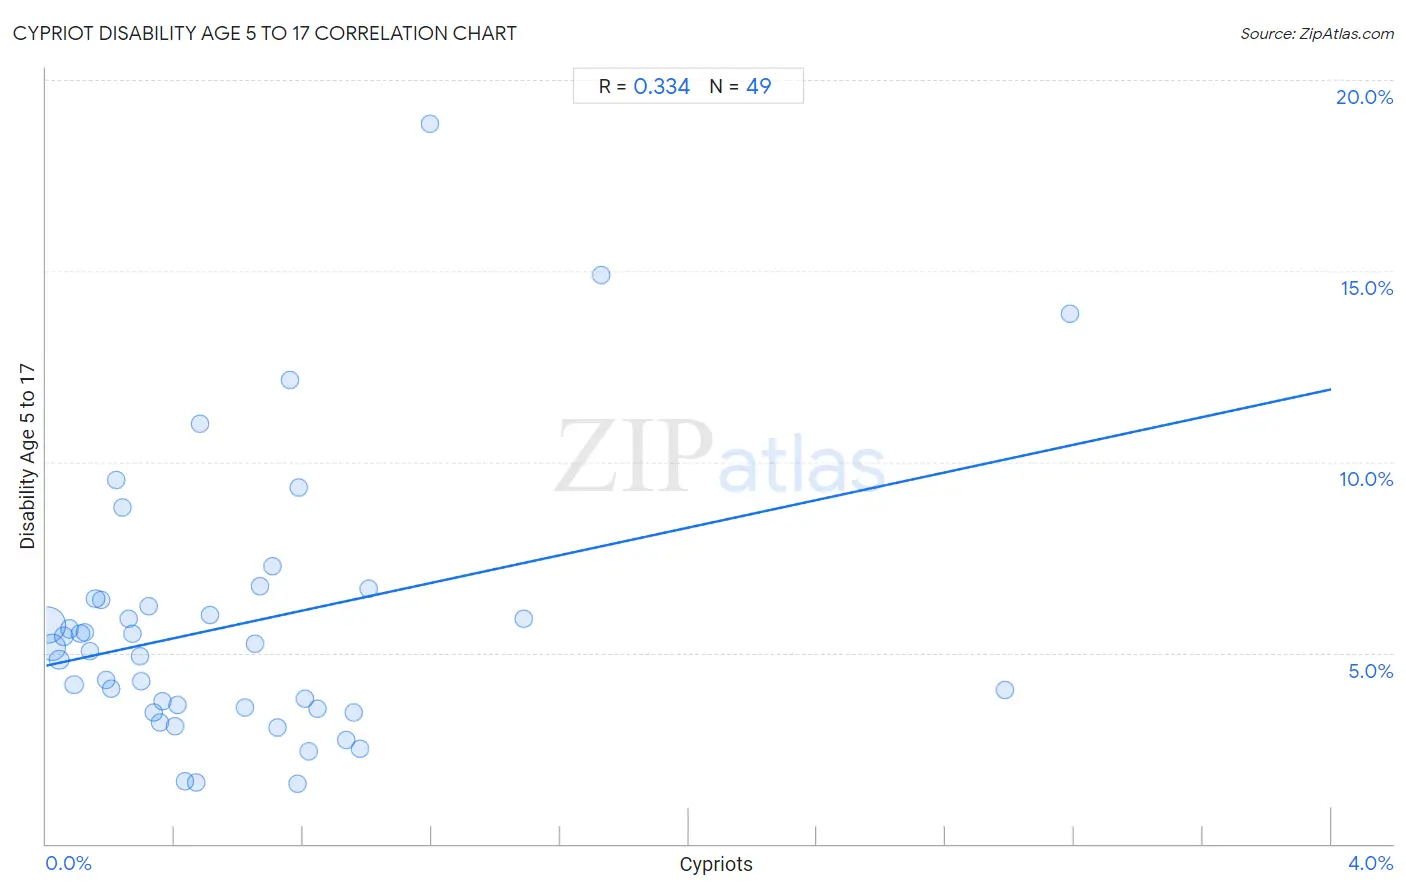
It is essential to understand that the correlation between the percentage of Cypriots and percentage of population with a disability between the ages 5 and 17 does not imply a direct cause-and-effect relationship. It remains uncertain whether the presence of Cypriots influences an upward or downward trend in the level of percentage of population with a disability between the ages 5 and 17 within an area, or if Cypriots simply ended up residing in those areas with higher or lower levels of percentage of population with a disability between the ages 5 and 17 due to other factors.

Demographics Similar to Cypriots by Disability Age 5 to 17

In terms of disability age 5 to 17, the demographic groups most similar to Cypriots are Cuban (5.3%, a difference of 0.060%), Immigrants from Northern Europe (5.3%, a difference of 0.080%), Aleut (5.3%, a difference of 0.10%), Immigrants from Latvia (5.3%, a difference of 0.15%), and Ethiopian (5.3%, a difference of 0.16%).
DemographicsRating | RankDisability Age 5 to 17
Immigrants from Northern Africa
98.1
/100
|
#109
Exceptional
5.3%
Immigrants from Eritrea
98.0
/100
|
#110
Exceptional
5.3%
Ethiopians
97.9
/100
|
#111
Exceptional
5.3%
Immigrants from Latvia
97.9
/100
|
#112
Exceptional
5.3%
Aleuts
97.8
/100
|
#113
Exceptional
5.3%
Immigrants from Northern Europe
97.8
/100
|
#114
Exceptional
5.3%
Cubans
97.8
/100
|
#115
Exceptional
5.3%
Cypriots
97.7
/100
|
#116
Exceptional
5.3%
Immigrants from Afghanistan
97.4
/100
|
#117
Exceptional
5.3%
South Americans
97.1
/100
|
#118
Exceptional
5.4%
Immigrants from South America
97.1
/100
|
#119
Exceptional
5.4%
Immigrants
97.0
/100
|
#120
Exceptional
5.4%
Maltese
96.0
/100
|
#121
Exceptional
5.4%
Chileans
95.8
/100
|
#122
Exceptional
5.4%
Immigrants from Ethiopia
95.5
/100
|
#123
Exceptional
5.4%

Cypriot Disability Age 5 to 17 Correlation Summary

MeasurementCypriot DataDisability Age 5 to 17 Data
Minimum0.0054%1.6%
Maximum3.2%18.9%
Range3.2%17.3%
Mean0.60%5.8%
Median0.41%5.2%
Interquartile 25% (IQ1)0.19%3.6%
Interquartile 75% (IQ3)0.80%6.4%
Interquartile Range (IQR)0.60%2.9%
Standard Deviation (Sample)0.64%3.5%
Standard Deviation (Population)0.64%3.5%

Correlation Details

Cypriot PercentileSample SizeDisability Age 5 to 17
[
0.0%
-
0.5%
]
0.0054%
33,992,2005.7%
[
0.0%
-
0.5%
]
0.020%
16,345,5095.2%
[
0.0%
-
0.5%
]
0.040%
3,122,8994.8%
[
0.0%
-
0.5%
]
0.056%
2,025,9495.4%
[
0.0%
-
0.5%
]
0.073%
1,642,8325.6%
[
0.0%
-
0.5%
]
0.087%
948,5164.2%
[
0.0%
-
0.5%
]
0.11%
605,7005.5%
[
0.0%
-
0.5%
]
0.12%
475,9065.5%
[
0.0%
-
0.5%
]
0.14%
328,3865.0%
[
0.0%
-
0.5%
]
0.15%
305,5696.4%
[
0.0%
-
0.5%
]
0.17%
276,1286.4%
[
0.0%
-
0.5%
]
0.19%
250,7234.3%
[
0.0%
-
0.5%
]
0.20%
237,7524.1%
[
0.0%
-
0.5%
]
0.22%
60,5339.5%
[
0.0%
-
0.5%
]
0.24%
112,8808.8%
[
0.0%
-
0.5%
]
0.26%
52,2845.9%
[
0.0%
-
0.5%
]
0.27%
72,1715.5%
[
0.0%
-
0.5%
]
0.29%
30,7734.9%
[
0.0%
-
0.5%
]
0.30%
138,3344.3%
[
0.0%
-
0.5%
]
0.32%
67,2176.2%
[
0.0%
-
0.5%
]
0.34%
27,0393.4%
[
0.0%
-
0.5%
]
0.35%
82,2903.2%
[
0.0%
-
0.5%
]
0.36%
28,6973.7%
[
0.0%
-
0.5%
]
0.40%
62,5473.1%
[
0.0%
-
0.5%
]
0.41%
16,8183.6%
[
0.0%
-
0.5%
]
0.43%
34,3411.6%
[
0.0%
-
0.5%
]
0.47%
22,0231.6%
[
0.0%
-
0.5%
]
0.48%
68,33111.0%
[
0.5%
-
1.0%
]
0.51%
20,7346.0%
[
0.5%
-
1.0%
]
0.62%
12,2603.6%
[
0.5%
-
1.0%
]
0.65%
9,2345.2%
[
0.5%
-
1.0%
]
0.67%
6,4446.7%
[
0.5%
-
1.0%
]
0.71%
36,0287.3%
[
0.5%
-
1.0%
]
0.72%
5,1403.1%
[
0.5%
-
1.0%
]
0.76%
2,37512.2%
[
0.5%
-
1.0%
]
0.78%
2,0501.6%
[
0.5%
-
1.0%
]
0.79%
12,1869.3%
[
0.5%
-
1.0%
]
0.80%
7,4583.8%
[
0.5%
-
1.0%
]
0.82%
8,0962.4%
[
0.5%
-
1.0%
]
0.84%
18,7483.5%
[
0.5%
-
1.0%
]
0.93%
7,0602.7%
[
0.5%
-
1.0%
]
0.96%
36,8423.4%
[
0.5%
-
1.0%
]
0.98%
7162.5%
[
1.0%
-
1.5%
]
1.00%
57,0466.7%
[
1.0%
-
1.5%
]
1.20%
2,59118.9%
[
1.0%
-
1.5%
]
1.48%
17,1105.9%
[
1.5%
-
2.0%
]
1.73%
46314.9%
[
2.5%
-
3.0%
]
2.99%
11,7884.0%
[
3.0%
-
3.5%
]
3.19%
91013.9%