Sierra Leonean Disability Age 5 to 17

COMPARE

Sierra Leonean
Race
Ancestry
AfghanAfricanAlaska NativeAlaskan AthabascanAlbanianAleutAlsatianAmericanApacheArabArapahoArgentineanArmenianAssyrian/Chaldean/SyriacAustralianAustrianBahamianBangladeshiBarbadianBasqueBelgianBelizeanBermudanBhutaneseBlackfeetBolivianBrazilianBritishBritish West IndianBulgarianBurmeseCajunCambodianCanadianCape VerdeanCarpatho RusynCelticCentral AmericanCentral American IndianCherokeeCheyenneChickasawChileanChineseChippewaChoctawColombianColvilleComancheCosta RicanCreeCreekCroatianCrowCubanCypriotCzechCzechoslovakianDanishDelawareDominicanDutchDutch West IndianEastern EuropeanEcuadorianEgyptianEnglishEstonianEthiopianEuropeanFijianFilipinoFinnishFrenchFrench American IndianFrench CanadianGermanGerman RussianGhanaianGreekGuamanian/ChamorroGuatemalanGuyaneseHaitianHmongHonduranHopiHoumaHungarianIcelanderIndian (Asian)IndonesianInupiatIranianIraqiIrishIroquoisIsraeliItalianJamaicanJapaneseJordanianKenyanKiowaKoreanLaotianLatvianLebaneseLiberianLithuanianLumbeeLuxembourgerMacedonianMalaysianMalteseMarshalleseMenomineeMexicanMexican American IndianMongolianMoroccanNative HawaiianNavajoNepaleseNew ZealanderNicaraguanNigerianNorthern EuropeanNorwegianOkinawanOsageOttawaPaiutePakistaniPalestinianPanamanianParaguayanPennsylvania GermanPeruvianPimaPolishPortuguesePotawatomiPuebloPuerto RicanPuget Sound SalishRomanianRussianSalvadoranSamoanScandinavianScotch-IrishScottishSeminoleSenegaleseSerbianShoshoneSierra LeoneanSiouxSlavicSlovakSloveneSomaliSouth AfricanSouth AmericanSouth American IndianSoviet UnionSpaniardSpanishSpanish AmericanSpanish American IndianSri LankanSubsaharan AfricanSudaneseSwedishSwissSyrianTaiwaneseThaiTlingit-HaidaTohono O'OdhamTonganTrinidadian and TobagonianTsimshianTurkishU.S. Virgin IslanderUgandanUkrainianUruguayanUteVenezuelanVietnameseWelshWest IndianYakamaYaquiYugoslavianYumanYup'ikZimbabwean
Immigration
NonimmigrantsImmigrantsAfghanistanAfricaAlbaniaArgentinaArmeniaAsiaAustraliaAustriaBahamasBangladeshBarbadosBelarusBelgiumBelizeBoliviaBosnia and HerzegovinaBrazilBulgariaBurma/MyanmarCabo VerdeCambodiaCameroonCanadaCaribbeanCentral AmericaChileChinaColombiaCongoCosta RicaCroatiaCubaCzechoslovakiaDenmarkDominicaDominican RepublicEastern AfricaEastern AsiaEastern EuropeEcuadorEgyptEl SalvadorEnglandEritreaEthiopiaEuropeFijiFranceGermanyGhanaGreeceGrenadaGuatemalaGuyanaHaitiHondurasHong KongHungaryIndiaIndonesiaIranIraqIrelandIsraelItalyJamaicaJapanJordanKazakhstanKenyaKoreaKuwaitLaosLatin AmericaLatviaLebanonLiberiaLithuaniaMalaysiaMexicoMicronesiaMiddle AfricaMoldovaMoroccoNepalNetherlandsNicaraguaNigeriaNorth AmericaNorth MacedoniaNorthern AfricaNorthern EuropeNorwayOceaniaPakistanPanamaPeruPhilippinesPolandPortugalRomaniaRussiaSaudi ArabiaScotlandSenegalSerbiaSierra LeoneSingaporeSomaliaSouth AfricaSouth AmericaSouth Central AsiaSouth Eastern AsiaSouthern EuropeSpainSri LankaSt. Vincent and the GrenadinesSudanSwedenSwitzerlandSyriaTaiwanThailandTrinidad and TobagoTurkeyUgandaUkraineUruguayUzbekistanVenezuelaVietnamWest IndiesWestern AfricaWestern AsiaWestern EuropeYemenZaireZimbabweAzores
Select to Compare
Race
Ancestry
AfghanAfricanAlaska NativeAlaskan AthabascanAlbanianAleutAlsatianAmericanApacheArabArapahoArgentineanArmenianAssyrian/Chaldean/SyriacAustralianAustrianBahamianBangladeshiBarbadianBasqueBelgianBelizeanBermudanBhutaneseBlackfeetBolivianBrazilianBritishBritish West IndianBulgarianBurmeseCajunCambodianCanadianCape VerdeanCarpatho RusynCelticCentral AmericanCentral American IndianCherokeeCheyenneChickasawChileanChineseChippewaChoctawColombianColvilleComancheCosta RicanCreeCreekCroatianCrowCubanCypriotCzechCzechoslovakianDanishDelawareDominicanDutchDutch West IndianEastern EuropeanEcuadorianEgyptianEnglishEstonianEthiopianEuropeanFijianFilipinoFinnishFrenchFrench American IndianFrench CanadianGermanGerman RussianGhanaianGreekGuamanian/ChamorroGuatemalanGuyaneseHaitianHmongHonduranHopiHoumaHungarianIcelanderIndian (Asian)IndonesianInupiatIranianIraqiIrishIroquoisIsraeliItalianJamaicanJapaneseJordanianKenyanKiowaKoreanLaotianLatvianLebaneseLiberianLithuanianLumbeeLuxembourgerMacedonianMalaysianMalteseMarshalleseMenomineeMexicanMexican American IndianMongolianMoroccanNative HawaiianNavajoNepaleseNew ZealanderNicaraguanNigerianNorthern EuropeanNorwegianOkinawanOsageOttawaPaiutePakistaniPalestinianPanamanianParaguayanPennsylvania GermanPeruvianPimaPolishPortuguesePotawatomiPuebloPuerto RicanPuget Sound SalishRomanianRussianSalvadoranSamoanScandinavianScotch-IrishScottishSeminoleSenegaleseSerbianShoshoneSiouxSlavicSlovakSloveneSomaliSouth AfricanSouth AmericanSouth American IndianSoviet UnionSpaniardSpanishSpanish AmericanSpanish American IndianSri LankanSubsaharan AfricanSudaneseSwedishSwissSyrianTaiwaneseThaiTlingit-HaidaTohono O'OdhamTonganTrinidadian and TobagonianTsimshianTurkishU.S. Virgin IslanderUgandanUkrainianUruguayanUteVenezuelanVietnameseWelshWest IndianYakamaYaquiYugoslavianYumanYup'ikZimbabwean
Immigration
NonimmigrantsImmigrantsAfghanistanAfricaAlbaniaArgentinaArmeniaAsiaAustraliaAustriaBahamasBangladeshBarbadosBelarusBelgiumBelizeBoliviaBosnia and HerzegovinaBrazilBulgariaBurma/MyanmarCabo VerdeCambodiaCameroonCanadaCaribbeanCentral AmericaChileChinaColombiaCongoCosta RicaCroatiaCubaCzechoslovakiaDenmarkDominicaDominican RepublicEastern AfricaEastern AsiaEastern EuropeEcuadorEgyptEl SalvadorEnglandEritreaEthiopiaEuropeFijiFranceGermanyGhanaGreeceGrenadaGuatemalaGuyanaHaitiHondurasHong KongHungaryIndiaIndonesiaIranIraqIrelandIsraelItalyJamaicaJapanJordanKazakhstanKenyaKoreaKuwaitLaosLatin AmericaLatviaLebanonLiberiaLithuaniaMalaysiaMexicoMicronesiaMiddle AfricaMoldovaMoroccoNepalNetherlandsNicaraguaNigeriaNorth AmericaNorth MacedoniaNorthern AfricaNorthern EuropeNorwayOceaniaPakistanPanamaPeruPhilippinesPolandPortugalRomaniaRussiaSaudi ArabiaScotlandSenegalSerbiaSierra LeoneSingaporeSomaliaSouth AfricaSouth AmericaSouth Central AsiaSouth Eastern AsiaSouthern EuropeSpainSri LankaSt. Vincent and the GrenadinesSudanSwedenSwitzerlandSyriaTaiwanThailandTrinidad and TobagoTurkeyUgandaUkraineUruguayUzbekistanVenezuelaVietnamWest IndiesWestern AfricaWestern AsiaWestern EuropeYemenZaireZimbabweAzores
Disability Age 5 to 17
Income
Poverty
Unemployment
Labor Participation
Family Structure
Vehicle Availability
Education Level
Disability

Sierra Leonean Disability Age 5 to 17
Tragic

5.8%
DISABILITY | AGE 5 TO 17
7.0/ 100
METRIC RATING
219th/ 347
METRIC RANK

Sierra Leonean Disability Age 5 to 17 Correlation Chart

The statistical analysis conducted on geographies consisting of 83,260,070 people shows a poor positive correlation between the proportion of Sierra Leoneans and percentage of population with a disability between the ages 5 and 17 in the United States with a correlation coefficient (R) of 0.173 and weighted average of 5.8%. On average, for every 1% (one percent) increase in Sierra Leoneans within a typical geography, there is an increase of 0.29% in percentage of population with a disability between the ages 5 and 17.
Sierra Leonean Disability Age 5 to 17
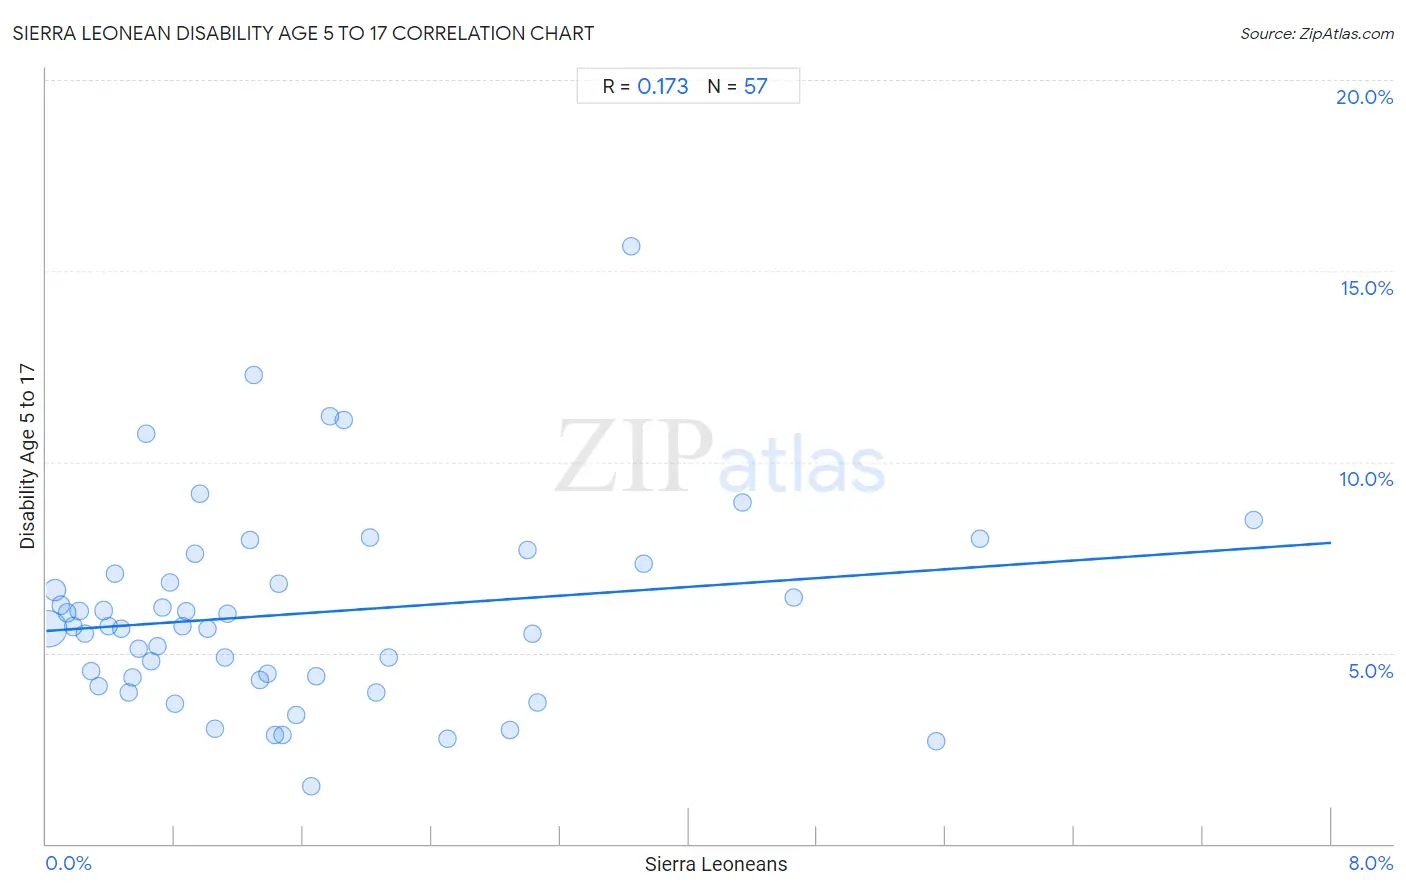
It is essential to understand that the correlation between the percentage of Sierra Leoneans and percentage of population with a disability between the ages 5 and 17 does not imply a direct cause-and-effect relationship. It remains uncertain whether the presence of Sierra Leoneans influences an upward or downward trend in the level of percentage of population with a disability between the ages 5 and 17 within an area, or if Sierra Leoneans simply ended up residing in those areas with higher or lower levels of percentage of population with a disability between the ages 5 and 17 due to other factors.

Demographics Similar to Sierra Leoneans by Disability Age 5 to 17

In terms of disability age 5 to 17, the demographic groups most similar to Sierra Leoneans are Immigrants from Sierra Leone (5.8%, a difference of 0.010%), Belgian (5.8%, a difference of 0.010%), Lithuanian (5.8%, a difference of 0.050%), Czech (5.8%, a difference of 0.060%), and Immigrants from Sudan (5.8%, a difference of 0.060%).
DemographicsRating | RankDisability Age 5 to 17
Immigrants from Panama
8.7
/100
|
#212
Tragic
5.8%
Immigrants from Cameroon
8.3
/100
|
#213
Tragic
5.8%
Immigrants from Morocco
8.3
/100
|
#214
Tragic
5.8%
Swedes
8.1
/100
|
#215
Tragic
5.8%
Nigerians
7.5
/100
|
#216
Tragic
5.8%
Czechs
7.4
/100
|
#217
Tragic
5.8%
Immigrants from Sierra Leone
7.1
/100
|
#218
Tragic
5.8%
Sierra Leoneans
7.0
/100
|
#219
Tragic
5.8%
Belgians
6.9
/100
|
#220
Tragic
5.8%
Lithuanians
6.7
/100
|
#221
Tragic
5.8%
Immigrants from Sudan
6.7
/100
|
#222
Tragic
5.8%
Alsatians
6.0
/100
|
#223
Tragic
5.8%
Mexicans
5.7
/100
|
#224
Tragic
5.8%
Guamanians/Chamorros
5.6
/100
|
#225
Tragic
5.8%
British West Indians
5.4
/100
|
#226
Tragic
5.8%

Sierra Leonean Disability Age 5 to 17 Correlation Summary

MeasurementSierra Leonean DataDisability Age 5 to 17 Data
Minimum0.013%1.5%
Maximum7.5%15.7%
Range7.5%14.2%
Mean1.6%6.0%
Median1.1%5.7%
Interquartile 25% (IQ1)0.53%4.3%
Interquartile 75% (IQ3)2.0%7.2%
Interquartile Range (IQR)1.5%2.9%
Standard Deviation (Sample)1.6%2.6%
Standard Deviation (Population)1.6%2.6%

Correlation Details

Sierra Leonean PercentileSample SizeDisability Age 5 to 17
[
0.0%
-
0.5%
]
0.013%
57,496,2165.6%
[
0.0%
-
0.5%
]
0.055%
11,196,4306.7%
[
0.0%
-
0.5%
]
0.092%
2,813,1306.3%
[
0.0%
-
0.5%
]
0.13%
1,824,1396.0%
[
0.0%
-
0.5%
]
0.17%
2,266,3315.7%
[
0.0%
-
0.5%
]
0.21%
1,130,8706.1%
[
0.0%
-
0.5%
]
0.24%
1,071,2255.5%
[
0.0%
-
0.5%
]
0.28%
746,4264.5%
[
0.0%
-
0.5%
]
0.32%
483,1344.1%
[
0.0%
-
0.5%
]
0.36%
455,9116.1%
[
0.0%
-
0.5%
]
0.39%
543,1875.7%
[
0.0%
-
0.5%
]
0.43%
460,9457.1%
[
0.0%
-
0.5%
]
0.47%
236,9205.6%
[
0.5%
-
1.0%
]
0.51%
206,8704.0%
[
0.5%
-
1.0%
]
0.54%
155,9504.3%
[
0.5%
-
1.0%
]
0.57%
408,8175.1%
[
0.5%
-
1.0%
]
0.63%
116,75410.7%
[
0.5%
-
1.0%
]
0.66%
234,2274.8%
[
0.5%
-
1.0%
]
0.69%
144,3205.2%
[
0.5%
-
1.0%
]
0.73%
103,1536.2%
[
0.5%
-
1.0%
]
0.77%
127,9006.8%
[
0.5%
-
1.0%
]
0.81%
111,7703.7%
[
0.5%
-
1.0%
]
0.85%
52,3565.7%
[
0.5%
-
1.0%
]
0.87%
134,1706.1%
[
0.5%
-
1.0%
]
0.92%
60,6837.6%
[
0.5%
-
1.0%
]
0.96%
45,5559.1%
[
1.0%
-
1.5%
]
1.00%
40,7515.6%
[
1.0%
-
1.5%
]
1.05%
50,6923.0%
[
1.0%
-
1.5%
]
1.11%
70,7724.9%
[
1.0%
-
1.5%
]
1.13%
13,4256.0%
[
1.0%
-
1.5%
]
1.27%
48,5637.9%
[
1.0%
-
1.5%
]
1.29%
17,87512.3%
[
1.0%
-
1.5%
]
1.33%
4,9504.3%
[
1.0%
-
1.5%
]
1.38%
13,9824.5%
[
1.0%
-
1.5%
]
1.42%
9,8352.9%
[
1.0%
-
1.5%
]
1.44%
38,2956.8%
[
1.0%
-
1.5%
]
1.47%
9,5272.9%
[
1.5%
-
2.0%
]
1.55%
26,2533.4%
[
1.5%
-
2.0%
]
1.65%
15,2441.5%
[
1.5%
-
2.0%
]
1.68%
9,0244.4%
[
1.5%
-
2.0%
]
1.77%
7,51511.2%
[
1.5%
-
2.0%
]
1.85%
11,45511.1%
[
2.0%
-
2.5%
]
2.01%
19,3698.0%
[
2.0%
-
2.5%
]
2.06%
43,7974.0%
[
2.0%
-
2.5%
]
2.13%
7,1684.9%
[
2.5%
-
3.0%
]
2.50%
9,0372.7%
[
2.5%
-
3.0%
]
2.89%
14,9013.0%
[
2.5%
-
3.0%
]
3.00%
31,0187.7%
[
3.0%
-
3.5%
]
3.03%
9,1835.5%
[
3.0%
-
3.5%
]
3.06%
52,3733.7%
[
3.5%
-
4.0%
]
3.64%
4,22615.7%
[
3.5%
-
4.0%
]
3.72%
4,9967.3%
[
4.0%
-
4.5%
]
4.33%
19,4658.9%
[
4.5%
-
5.0%
]
4.65%
5,9766.4%
[
5.5%
-
6.0%
]
5.54%
18,1042.7%
[
5.5%
-
6.0%
]
5.81%
3,2878.0%
[
7.5%
-
8.0%
]
7.52%
1,6238.5%