Immigrants from Cameroon Disability Age 5 to 17

COMPARE

Immigrants from Cameroon
Race
Ancestry
AfghanAfricanAlaska NativeAlaskan AthabascanAlbanianAleutAlsatianAmericanApacheArabArapahoArgentineanArmenianAssyrian/Chaldean/SyriacAustralianAustrianBahamianBangladeshiBarbadianBasqueBelgianBelizeanBermudanBhutaneseBlackfeetBolivianBrazilianBritishBritish West IndianBulgarianBurmeseCajunCambodianCanadianCape VerdeanCarpatho RusynCelticCentral AmericanCentral American IndianCherokeeCheyenneChickasawChileanChineseChippewaChoctawColombianColvilleComancheCosta RicanCreeCreekCroatianCrowCubanCypriotCzechCzechoslovakianDanishDelawareDominicanDutchDutch West IndianEastern EuropeanEcuadorianEgyptianEnglishEstonianEthiopianEuropeanFijianFilipinoFinnishFrenchFrench American IndianFrench CanadianGermanGerman RussianGhanaianGreekGuamanian/ChamorroGuatemalanGuyaneseHaitianHmongHonduranHopiHoumaHungarianIcelanderIndian (Asian)IndonesianInupiatIranianIraqiIrishIroquoisIsraeliItalianJamaicanJapaneseJordanianKenyanKiowaKoreanLaotianLatvianLebaneseLiberianLithuanianLumbeeLuxembourgerMacedonianMalaysianMalteseMarshalleseMenomineeMexicanMexican American IndianMongolianMoroccanNative HawaiianNavajoNepaleseNew ZealanderNicaraguanNigerianNorthern EuropeanNorwegianOkinawanOsageOttawaPaiutePakistaniPalestinianPanamanianParaguayanPennsylvania GermanPeruvianPimaPolishPortuguesePotawatomiPuebloPuerto RicanPuget Sound SalishRomanianRussianSalvadoranSamoanScandinavianScotch-IrishScottishSeminoleSenegaleseSerbianShoshoneSierra LeoneanSiouxSlavicSlovakSloveneSomaliSouth AfricanSouth AmericanSouth American IndianSoviet UnionSpaniardSpanishSpanish AmericanSpanish American IndianSri LankanSubsaharan AfricanSudaneseSwedishSwissSyrianTaiwaneseThaiTlingit-HaidaTohono O'OdhamTonganTrinidadian and TobagonianTsimshianTurkishU.S. Virgin IslanderUgandanUkrainianUruguayanUteVenezuelanVietnameseWelshWest IndianYakamaYaquiYugoslavianYumanYup'ikZimbabwean
Immigration
NonimmigrantsImmigrantsAfghanistanAfricaAlbaniaArgentinaArmeniaAsiaAustraliaAustriaBahamasBangladeshBarbadosBelarusBelgiumBelizeBoliviaBosnia and HerzegovinaBrazilBulgariaBurma/MyanmarCabo VerdeCambodiaCameroonCanadaCaribbeanCentral AmericaChileChinaColombiaCongoCosta RicaCroatiaCubaCzechoslovakiaDenmarkDominicaDominican RepublicEastern AfricaEastern AsiaEastern EuropeEcuadorEgyptEl SalvadorEnglandEritreaEthiopiaEuropeFijiFranceGermanyGhanaGreeceGrenadaGuatemalaGuyanaHaitiHondurasHong KongHungaryIndiaIndonesiaIranIraqIrelandIsraelItalyJamaicaJapanJordanKazakhstanKenyaKoreaKuwaitLaosLatin AmericaLatviaLebanonLiberiaLithuaniaMalaysiaMexicoMicronesiaMiddle AfricaMoldovaMoroccoNepalNetherlandsNicaraguaNigeriaNorth AmericaNorth MacedoniaNorthern AfricaNorthern EuropeNorwayOceaniaPakistanPanamaPeruPhilippinesPolandPortugalRomaniaRussiaSaudi ArabiaScotlandSenegalSerbiaSierra LeoneSingaporeSomaliaSouth AfricaSouth AmericaSouth Central AsiaSouth Eastern AsiaSouthern EuropeSpainSri LankaSt. Vincent and the GrenadinesSudanSwedenSwitzerlandSyriaTaiwanThailandTrinidad and TobagoTurkeyUgandaUkraineUruguayUzbekistanVenezuelaVietnamWest IndiesWestern AfricaWestern AsiaWestern EuropeYemenZaireZimbabweAzores
Select to Compare
Race
Ancestry
AfghanAfricanAlaska NativeAlaskan AthabascanAlbanianAleutAlsatianAmericanApacheArabArapahoArgentineanArmenianAssyrian/Chaldean/SyriacAustralianAustrianBahamianBangladeshiBarbadianBasqueBelgianBelizeanBermudanBhutaneseBlackfeetBolivianBrazilianBritishBritish West IndianBulgarianBurmeseCajunCambodianCanadianCape VerdeanCarpatho RusynCelticCentral AmericanCentral American IndianCherokeeCheyenneChickasawChileanChineseChippewaChoctawColombianColvilleComancheCosta RicanCreeCreekCroatianCrowCubanCypriotCzechCzechoslovakianDanishDelawareDominicanDutchDutch West IndianEastern EuropeanEcuadorianEgyptianEnglishEstonianEthiopianEuropeanFijianFilipinoFinnishFrenchFrench American IndianFrench CanadianGermanGerman RussianGhanaianGreekGuamanian/ChamorroGuatemalanGuyaneseHaitianHmongHonduranHopiHoumaHungarianIcelanderIndian (Asian)IndonesianInupiatIranianIraqiIrishIroquoisIsraeliItalianJamaicanJapaneseJordanianKenyanKiowaKoreanLaotianLatvianLebaneseLiberianLithuanianLumbeeLuxembourgerMacedonianMalaysianMalteseMarshalleseMenomineeMexicanMexican American IndianMongolianMoroccanNative HawaiianNavajoNepaleseNew ZealanderNicaraguanNigerianNorthern EuropeanNorwegianOkinawanOsageOttawaPaiutePakistaniPalestinianPanamanianParaguayanPennsylvania GermanPeruvianPimaPolishPortuguesePotawatomiPuebloPuerto RicanPuget Sound SalishRomanianRussianSalvadoranSamoanScandinavianScotch-IrishScottishSeminoleSenegaleseSerbianShoshoneSierra LeoneanSiouxSlavicSlovakSloveneSomaliSouth AfricanSouth AmericanSouth American IndianSoviet UnionSpaniardSpanishSpanish AmericanSpanish American IndianSri LankanSubsaharan AfricanSudaneseSwedishSwissSyrianTaiwaneseThaiTlingit-HaidaTohono O'OdhamTonganTrinidadian and TobagonianTsimshianTurkishU.S. Virgin IslanderUgandanUkrainianUruguayanUteVenezuelanVietnameseWelshWest IndianYakamaYaquiYugoslavianYumanYup'ikZimbabwean
Immigration
NonimmigrantsImmigrantsAfghanistanAfricaAlbaniaArgentinaArmeniaAsiaAustraliaAustriaBahamasBangladeshBarbadosBelarusBelgiumBelizeBoliviaBosnia and HerzegovinaBrazilBulgariaBurma/MyanmarCabo VerdeCambodiaCanadaCaribbeanCentral AmericaChileChinaColombiaCongoCosta RicaCroatiaCubaCzechoslovakiaDenmarkDominicaDominican RepublicEastern AfricaEastern AsiaEastern EuropeEcuadorEgyptEl SalvadorEnglandEritreaEthiopiaEuropeFijiFranceGermanyGhanaGreeceGrenadaGuatemalaGuyanaHaitiHondurasHong KongHungaryIndiaIndonesiaIranIraqIrelandIsraelItalyJamaicaJapanJordanKazakhstanKenyaKoreaKuwaitLaosLatin AmericaLatviaLebanonLiberiaLithuaniaMalaysiaMexicoMicronesiaMiddle AfricaMoldovaMoroccoNepalNetherlandsNicaraguaNigeriaNorth AmericaNorth MacedoniaNorthern AfricaNorthern EuropeNorwayOceaniaPakistanPanamaPeruPhilippinesPolandPortugalRomaniaRussiaSaudi ArabiaScotlandSenegalSerbiaSierra LeoneSingaporeSomaliaSouth AfricaSouth AmericaSouth Central AsiaSouth Eastern AsiaSouthern EuropeSpainSri LankaSt. Vincent and the GrenadinesSudanSwedenSwitzerlandSyriaTaiwanThailandTrinidad and TobagoTurkeyUgandaUkraineUruguayUzbekistanVenezuelaVietnamWest IndiesWestern AfricaWestern AsiaWestern EuropeYemenZaireZimbabweAzores
Disability Age 5 to 17
Income
Poverty
Unemployment
Labor Participation
Family Structure
Vehicle Availability
Education Level
Disability

Immigrants from Cameroon Disability Age 5 to 17
Tragic

5.8%
DISABILITY | AGE 5 TO 17
8.3/ 100
METRIC RATING
213th/ 347
METRIC RANK

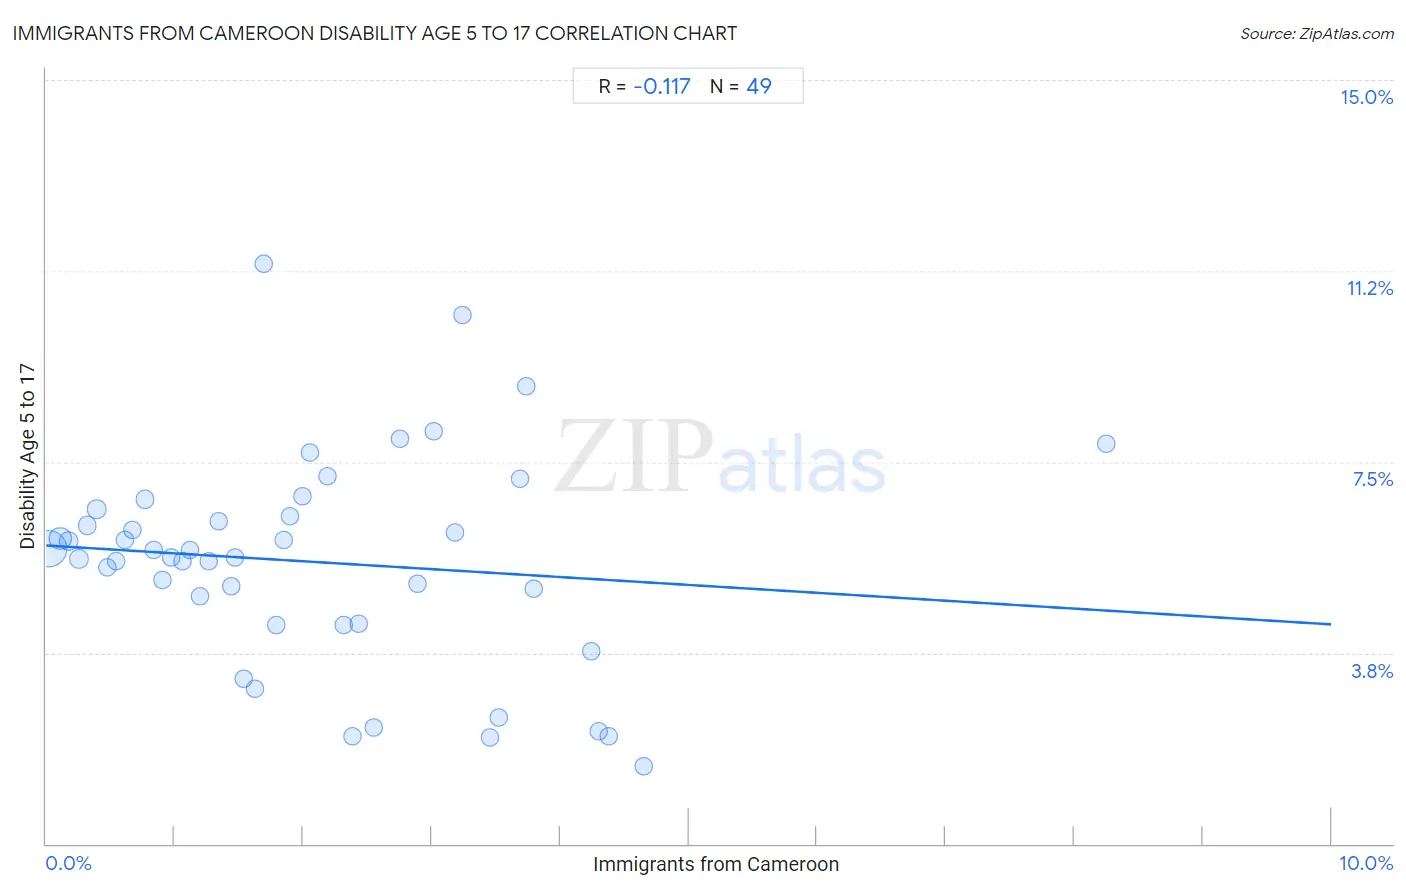
Immigrants from Cameroon Disability Age 5 to 17 Correlation Chart

The statistical analysis conducted on geographies consisting of 130,401,709 people shows a poor negative correlation between the proportion of Immigrants from Cameroon and percentage of population with a disability between the ages 5 and 17 in the United States with a correlation coefficient (R) of -0.117 and weighted average of 5.8%. On average, for every 1% (one percent) increase in Immigrants from Cameroon within a typical geography, there is a decrease of 0.15% in percentage of population with a disability between the ages 5 and 17.
Immigrants from Cameroon Disability Age 5 to 17
It is essential to understand that the correlation between the percentage of Immigrants from Cameroon and percentage of population with a disability between the ages 5 and 17 does not imply a direct cause-and-effect relationship. It remains uncertain whether the presence of Immigrants from Cameroon influences an upward or downward trend in the level of percentage of population with a disability between the ages 5 and 17 within an area, or if Immigrants from Cameroon simply ended up residing in those areas with higher or lower levels of percentage of population with a disability between the ages 5 and 17 due to other factors.

Demographics Similar to Immigrants from Cameroon by Disability Age 5 to 17

In terms of disability age 5 to 17, the demographic groups most similar to Immigrants from Cameroon are Immigrants from Morocco (5.8%, a difference of 0.0%), Swedish (5.8%, a difference of 0.040%), Immigrants from Panama (5.8%, a difference of 0.050%), Yugoslavian (5.8%, a difference of 0.12%), and Nigerian (5.8%, a difference of 0.13%).
DemographicsRating | RankDisability Age 5 to 17
Immigrants from Africa
10.8
/100
|
#206
Poor
5.7%
Moroccans
10.4
/100
|
#207
Poor
5.7%
Kenyans
10.0
/100
|
#208
Poor
5.8%
Immigrants from Uganda
9.7
/100
|
#209
Tragic
5.8%
Immigrants from Haiti
9.5
/100
|
#210
Tragic
5.8%
Yugoslavians
9.1
/100
|
#211
Tragic
5.8%
Immigrants from Panama
8.7
/100
|
#212
Tragic
5.8%
Immigrants from Cameroon
8.3
/100
|
#213
Tragic
5.8%
Immigrants from Morocco
8.3
/100
|
#214
Tragic
5.8%
Swedes
8.1
/100
|
#215
Tragic
5.8%
Nigerians
7.5
/100
|
#216
Tragic
5.8%
Czechs
7.4
/100
|
#217
Tragic
5.8%
Immigrants from Sierra Leone
7.1
/100
|
#218
Tragic
5.8%
Sierra Leoneans
7.0
/100
|
#219
Tragic
5.8%
Belgians
6.9
/100
|
#220
Tragic
5.8%

Immigrants from Cameroon Disability Age 5 to 17 Correlation Summary

MeasurementImmigrants from Cameroon DataDisability Age 5 to 17 Data
Minimum0.024%1.5%
Maximum8.2%11.4%
Range8.2%9.9%
Mean2.1%5.5%
Median1.8%5.6%
Interquartile 25% (IQ1)0.87%4.3%
Interquartile 75% (IQ3)3.1%6.5%
Interquartile Range (IQR)2.2%2.2%
Standard Deviation (Sample)1.6%2.1%
Standard Deviation (Population)1.6%2.1%

Correlation Details

Immigrants from Cameroon PercentileSample SizeDisability Age 5 to 17
[
0.0%
-
0.5%
]
0.024%
87,811,9065.8%
[
0.0%
-
0.5%
]
0.11%
20,387,4936.0%
[
0.0%
-
0.5%
]
0.18%
7,151,5965.9%
[
0.0%
-
0.5%
]
0.26%
4,075,4965.6%
[
0.0%
-
0.5%
]
0.32%
2,549,1386.3%
[
0.0%
-
0.5%
]
0.39%
1,390,8096.6%
[
0.0%
-
0.5%
]
0.48%
1,120,8785.4%
[
0.5%
-
1.0%
]
0.54%
1,370,3845.6%
[
0.5%
-
1.0%
]
0.61%
894,4376.0%
[
0.5%
-
1.0%
]
0.67%
465,0896.2%
[
0.5%
-
1.0%
]
0.77%
330,2846.8%
[
0.5%
-
1.0%
]
0.83%
380,9535.8%
[
0.5%
-
1.0%
]
0.90%
395,8955.2%
[
0.5%
-
1.0%
]
0.97%
245,3865.6%
[
1.0%
-
1.5%
]
1.06%
192,5645.5%
[
1.0%
-
1.5%
]
1.12%
112,3975.8%
[
1.0%
-
1.5%
]
1.19%
228,8304.9%
[
1.0%
-
1.5%
]
1.27%
55,5285.5%
[
1.0%
-
1.5%
]
1.34%
132,7216.3%
[
1.0%
-
1.5%
]
1.44%
73,4325.1%
[
1.0%
-
1.5%
]
1.47%
24,0495.6%
[
1.5%
-
2.0%
]
1.54%
17,3133.3%
[
1.5%
-
2.0%
]
1.63%
134,0943.0%
[
1.5%
-
2.0%
]
1.69%
58,83511.4%
[
1.5%
-
2.0%
]
1.79%
25,8234.3%
[
1.5%
-
2.0%
]
1.85%
156,1266.0%
[
1.5%
-
2.0%
]
1.90%
1,1056.4%
[
1.5%
-
2.0%
]
2.00%
59,3796.8%
[
2.0%
-
2.5%
]
2.05%
40,6077.7%
[
2.0%
-
2.5%
]
2.19%
6,3417.2%
[
2.0%
-
2.5%
]
2.31%
2,3764.3%
[
2.0%
-
2.5%
]
2.39%
33,4202.1%
[
2.0%
-
2.5%
]
2.44%
49,6584.3%
[
2.5%
-
3.0%
]
2.55%
20,8332.3%
[
2.5%
-
3.0%
]
2.75%
1,4907.9%
[
2.5%
-
3.0%
]
2.89%
38,7825.1%
[
3.0%
-
3.5%
]
3.02%
12,1038.1%
[
3.0%
-
3.5%
]
3.18%
75,9016.1%
[
3.0%
-
3.5%
]
3.23%
54,44510.4%
[
3.0%
-
3.5%
]
3.46%
11,6622.1%
[
3.5%
-
4.0%
]
3.52%
8,2902.5%
[
3.5%
-
4.0%
]
3.69%
2,3307.2%
[
3.5%
-
4.0%
]
3.73%
24,6469.0%
[
3.5%
-
4.0%
]
3.79%
12,1285.0%
[
4.0%
-
4.5%
]
4.24%
75,9883.8%
[
4.0%
-
4.5%
]
4.30%
28,4272.2%
[
4.0%
-
4.5%
]
4.38%
27,9092.1%
[
4.5%
-
5.0%
]
4.65%
16,9441.5%
[
8.0%
-
8.5%
]
8.24%
15,4897.9%