Immigrants from Taiwan Disability Age 5 to 17
COMPARE
Immigrants from Taiwan
Select to Compare
Disability Age 5 to 17
Immigrants from Taiwan Disability Age 5 to 17
4.2%
DISABILITY | AGE 5 TO 17
100.0/ 100
METRIC RATING
2nd/ 347
METRIC RANK
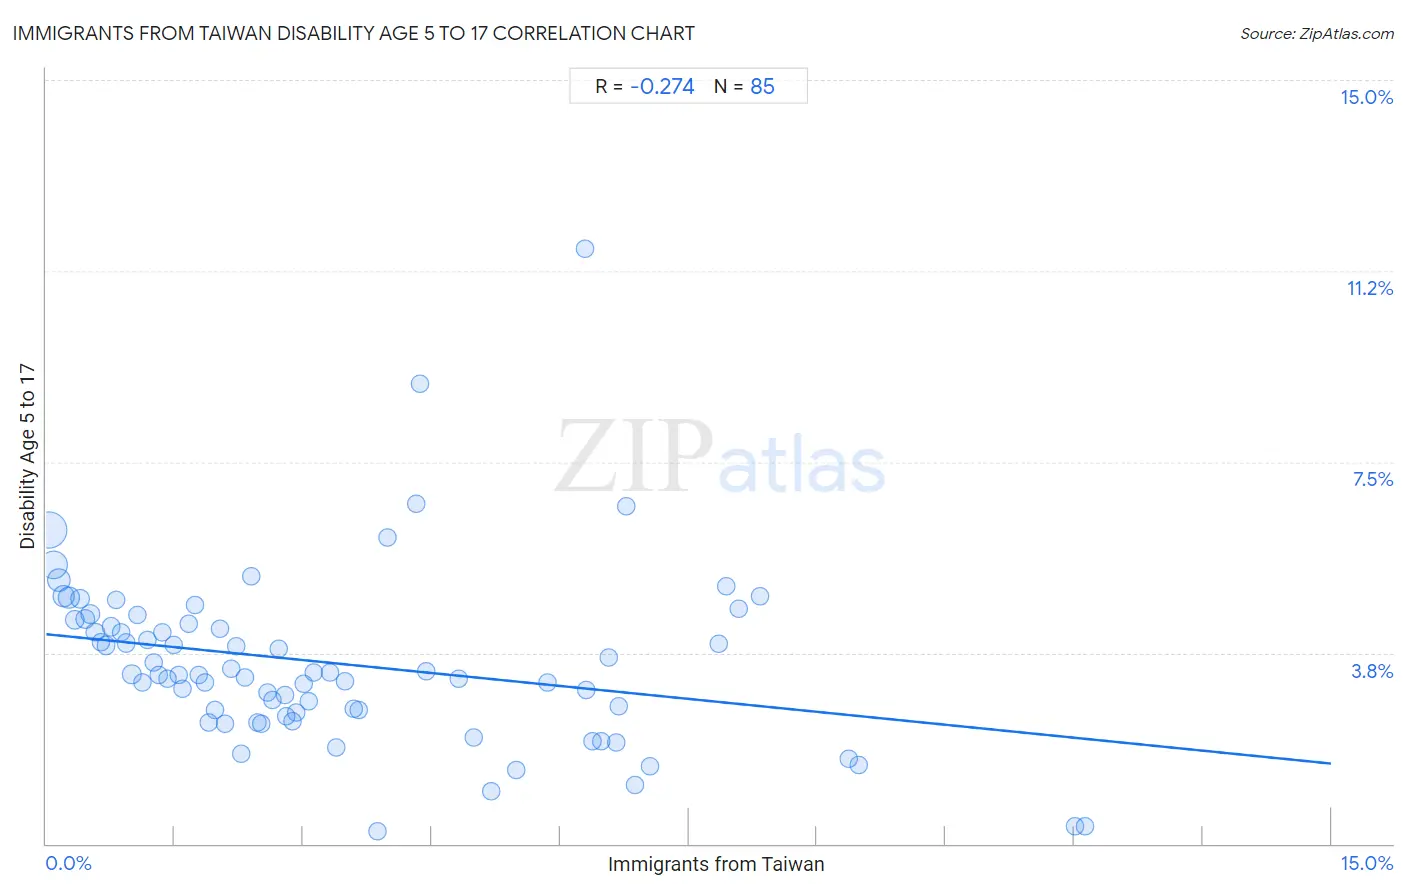
Immigrants from Taiwan Disability Age 5 to 17 Correlation Chart
The statistical analysis conducted on geographies consisting of 296,354,556 people shows a weak negative correlation between the proportion of Immigrants from Taiwan and percentage of population with a disability between the ages 5 and 17 in the United States with a correlation coefficient (R) of -0.274 and weighted average of 4.2%. On average, for every 1% (one percent) increase in Immigrants from Taiwan within a typical geography, there is a decrease of 0.17% in percentage of population with a disability between the ages 5 and 17.
It is essential to understand that the correlation between the percentage of Immigrants from Taiwan and percentage of population with a disability between the ages 5 and 17 does not imply a direct cause-and-effect relationship. It remains uncertain whether the presence of Immigrants from Taiwan influences an upward or downward trend in the level of percentage of population with a disability between the ages 5 and 17 within an area, or if Immigrants from Taiwan simply ended up residing in those areas with higher or lower levels of percentage of population with a disability between the ages 5 and 17 due to other factors.
Demographics Similar to Immigrants from Taiwan by Disability Age 5 to 17
In terms of disability age 5 to 17, the demographic groups most similar to Immigrants from Taiwan are Immigrants from Hong Kong (4.3%, a difference of 2.5%), Immigrants from Armenia (4.1%, a difference of 3.4%), Filipino (4.3%, a difference of 3.5%), Immigrants from Iran (4.4%, a difference of 4.1%), and Immigrants from Israel (4.5%, a difference of 7.6%).
| Demographics | Rating | Rank | Disability Age 5 to 17 |
| Immigrants from Armenia | 100.0 /100 | #1 | Exceptional 4.1% |
| Immigrants from Taiwan | 100.0 /100 | #2 | Exceptional 4.2% |
| Immigrants from Hong Kong | 100.0 /100 | #3 | Exceptional 4.3% |
| Filipinos | 100.0 /100 | #4 | Exceptional 4.3% |
| Immigrants from Iran | 100.0 /100 | #5 | Exceptional 4.4% |
| Immigrants from Israel | 100.0 /100 | #6 | Exceptional 4.5% |
| Immigrants from China | 100.0 /100 | #7 | Exceptional 4.5% |
| Indians (Asian) | 100.0 /100 | #8 | Exceptional 4.6% |
| Immigrants from Eastern Asia | 100.0 /100 | #9 | Exceptional 4.6% |
| Immigrants from India | 100.0 /100 | #10 | Exceptional 4.6% |
| Armenians | 100.0 /100 | #11 | Exceptional 4.6% |
| Iranians | 100.0 /100 | #12 | Exceptional 4.6% |
| Thais | 100.0 /100 | #13 | Exceptional 4.7% |
| Immigrants from Korea | 100.0 /100 | #14 | Exceptional 4.7% |
| Chinese | 100.0 /100 | #15 | Exceptional 4.7% |
Immigrants from Taiwan Disability Age 5 to 17 Correlation Summary
| Measurement | Immigrants from Taiwan Data | Disability Age 5 to 17 Data |
| Minimum | 0.032% | 0.25% |
| Maximum | 12.1% | 11.7% |
| Range | 12.1% | 11.4% |
| Mean | 3.4% | 3.5% |
| Median | 2.6% | 3.3% |
| Interquartile 25% (IQ1) | 1.3% | 2.5% |
| Interquartile 75% (IQ3) | 5.1% | 4.4% |
| Interquartile Range (IQR) | 3.8% | 1.8% |
| Standard Deviation (Sample) | 2.8% | 1.7% |
| Standard Deviation (Population) | 2.8% | 1.7% |
Correlation Details
| Immigrants from Taiwan Percentile | Sample Size | Disability Age 5 to 17 |
[ 0.0% - 0.5% ] 0.032% | 111,147,295 | 6.2% |
[ 0.0% - 0.5% ] 0.084% | 60,642,525 | 5.5% |
[ 0.0% - 0.5% ] 0.15% | 28,177,958 | 5.2% |
[ 0.0% - 0.5% ] 0.21% | 23,612,151 | 4.9% |
[ 0.0% - 0.5% ] 0.26% | 20,752,877 | 4.8% |
[ 0.0% - 0.5% ] 0.33% | 9,632,214 | 4.4% |
[ 0.0% - 0.5% ] 0.39% | 6,380,894 | 4.8% |
[ 0.0% - 0.5% ] 0.46% | 4,417,880 | 4.4% |
[ 0.5% - 1.0% ] 0.51% | 3,663,292 | 4.5% |
[ 0.5% - 1.0% ] 0.57% | 3,937,171 | 4.2% |
[ 0.5% - 1.0% ] 0.64% | 3,481,490 | 4.0% |
[ 0.5% - 1.0% ] 0.70% | 2,455,542 | 3.9% |
[ 0.5% - 1.0% ] 0.76% | 1,651,345 | 4.3% |
[ 0.5% - 1.0% ] 0.82% | 1,363,091 | 4.8% |
[ 0.5% - 1.0% ] 0.88% | 1,163,873 | 4.2% |
[ 0.5% - 1.0% ] 0.94% | 1,084,748 | 3.9% |
[ 0.5% - 1.0% ] 1.00% | 857,549 | 3.3% |
[ 1.0% - 1.5% ] 1.06% | 1,014,727 | 4.5% |
[ 1.0% - 1.5% ] 1.12% | 756,306 | 3.2% |
[ 1.0% - 1.5% ] 1.18% | 760,879 | 4.0% |
[ 1.0% - 1.5% ] 1.25% | 564,765 | 3.6% |
[ 1.0% - 1.5% ] 1.31% | 141,927 | 3.3% |
[ 1.0% - 1.5% ] 1.35% | 1,656,434 | 4.1% |
[ 1.0% - 1.5% ] 1.42% | 187,887 | 3.3% |
[ 1.0% - 1.5% ] 1.48% | 484,382 | 3.9% |
[ 1.5% - 2.0% ] 1.54% | 657,037 | 3.3% |
[ 1.5% - 2.0% ] 1.59% | 85,981 | 3.0% |
[ 1.5% - 2.0% ] 1.67% | 256,842 | 4.3% |
[ 1.5% - 2.0% ] 1.74% | 99,439 | 4.7% |
[ 1.5% - 2.0% ] 1.78% | 56,135 | 3.3% |
[ 1.5% - 2.0% ] 1.86% | 408,287 | 3.2% |
[ 1.5% - 2.0% ] 1.90% | 267,342 | 2.4% |
[ 1.5% - 2.0% ] 1.97% | 611,870 | 2.6% |
[ 2.0% - 2.5% ] 2.02% | 99,729 | 4.2% |
[ 2.0% - 2.5% ] 2.09% | 192,282 | 2.4% |
[ 2.0% - 2.5% ] 2.15% | 141,688 | 3.4% |
[ 2.0% - 2.5% ] 2.22% | 68,062 | 3.9% |
[ 2.0% - 2.5% ] 2.28% | 96,497 | 1.8% |
[ 2.0% - 2.5% ] 2.32% | 423,372 | 3.3% |
[ 2.0% - 2.5% ] 2.39% | 36,085 | 5.2% |
[ 2.0% - 2.5% ] 2.47% | 283,978 | 2.4% |
[ 2.5% - 3.0% ] 2.51% | 100,939 | 2.4% |
[ 2.5% - 3.0% ] 2.58% | 198,983 | 3.0% |
[ 2.5% - 3.0% ] 2.64% | 112,854 | 2.8% |
[ 2.5% - 3.0% ] 2.71% | 77,540 | 3.8% |
[ 2.5% - 3.0% ] 2.78% | 9,169 | 2.9% |
[ 2.5% - 3.0% ] 2.80% | 171,169 | 2.5% |
[ 2.5% - 3.0% ] 2.88% | 38,003 | 2.4% |
[ 2.5% - 3.0% ] 2.91% | 212,221 | 2.6% |
[ 3.0% - 3.5% ] 3.00% | 49,459 | 3.1% |
[ 3.0% - 3.5% ] 3.06% | 273,341 | 2.8% |
[ 3.0% - 3.5% ] 3.13% | 46,906 | 3.4% |
[ 3.0% - 3.5% ] 3.31% | 17,826 | 3.4% |
[ 3.0% - 3.5% ] 3.39% | 52,587 | 1.9% |
[ 3.0% - 3.5% ] 3.49% | 24,692 | 3.2% |
[ 3.5% - 4.0% ] 3.59% | 61,940 | 2.7% |
[ 3.5% - 4.0% ] 3.64% | 40,981 | 2.6% |
[ 3.5% - 4.0% ] 3.86% | 20,052 | 0.25% |
[ 3.5% - 4.0% ] 3.98% | 5,170 | 6.0% |
[ 4.0% - 4.5% ] 4.31% | 1,577 | 6.7% |
[ 4.0% - 4.5% ] 4.37% | 5,474 | 9.0% |
[ 4.0% - 4.5% ] 4.44% | 31,335 | 3.4% |
[ 4.5% - 5.0% ] 4.81% | 2,890 | 3.2% |
[ 4.5% - 5.0% ] 4.99% | 98,350 | 2.1% |
[ 5.0% - 5.5% ] 5.19% | 8,441 | 1.0% |
[ 5.0% - 5.5% ] 5.48% | 62,451 | 1.4% |
[ 5.5% - 6.0% ] 5.85% | 35,556 | 3.2% |
[ 6.0% - 6.5% ] 6.29% | 954 | 11.7% |
[ 6.0% - 6.5% ] 6.31% | 36,165 | 3.0% |
[ 6.0% - 6.5% ] 6.38% | 31,688 | 2.0% |
[ 6.0% - 6.5% ] 6.47% | 61,414 | 2.0% |
[ 6.5% - 7.0% ] 6.57% | 4,463 | 3.7% |
[ 6.5% - 7.0% ] 6.65% | 90,534 | 2.0% |
[ 6.5% - 7.0% ] 6.69% | 110,950 | 2.7% |
[ 6.5% - 7.0% ] 6.76% | 33,367 | 6.6% |
[ 6.5% - 7.0% ] 6.88% | 53,464 | 1.1% |
[ 7.0% - 7.5% ] 7.04% | 24,169 | 1.5% |
[ 7.5% - 8.0% ] 7.85% | 73,363 | 3.9% |
[ 7.5% - 8.0% ] 7.94% | 54,534 | 5.1% |
[ 8.0% - 8.5% ] 8.09% | 84,393 | 4.6% |
[ 8.0% - 8.5% ] 8.33% | 45,303 | 4.8% |
[ 9.0% - 9.5% ] 9.37% | 43,851 | 1.7% |
[ 9.0% - 9.5% ] 9.48% | 47,209 | 1.6% |
[ 12.0% - 12.5% ] 12.01% | 12,559 | 0.35% |
[ 12.0% - 12.5% ] 12.12% | 12,442 | 0.35% |