Immigrants from Singapore Disability Age 5 to 17

COMPARE

Immigrants from Singapore
Race
Ancestry
AfghanAfricanAlaska NativeAlaskan AthabascanAlbanianAleutAlsatianAmericanApacheArabArapahoArgentineanArmenianAssyrian/Chaldean/SyriacAustralianAustrianBahamianBangladeshiBarbadianBasqueBelgianBelizeanBermudanBhutaneseBlackfeetBolivianBrazilianBritishBritish West IndianBulgarianBurmeseCajunCambodianCanadianCape VerdeanCarpatho RusynCelticCentral AmericanCentral American IndianCherokeeCheyenneChickasawChileanChineseChippewaChoctawColombianColvilleComancheCosta RicanCreeCreekCroatianCrowCubanCypriotCzechCzechoslovakianDanishDelawareDominicanDutchDutch West IndianEastern EuropeanEcuadorianEgyptianEnglishEstonianEthiopianEuropeanFijianFilipinoFinnishFrenchFrench American IndianFrench CanadianGermanGerman RussianGhanaianGreekGuamanian/ChamorroGuatemalanGuyaneseHaitianHmongHonduranHopiHoumaHungarianIcelanderIndian (Asian)IndonesianInupiatIranianIraqiIrishIroquoisIsraeliItalianJamaicanJapaneseJordanianKenyanKiowaKoreanLaotianLatvianLebaneseLiberianLithuanianLumbeeLuxembourgerMacedonianMalaysianMalteseMarshalleseMenomineeMexicanMexican American IndianMongolianMoroccanNative HawaiianNavajoNepaleseNew ZealanderNicaraguanNigerianNorthern EuropeanNorwegianOkinawanOsageOttawaPaiutePakistaniPalestinianPanamanianParaguayanPennsylvania GermanPeruvianPimaPolishPortuguesePotawatomiPuebloPuerto RicanPuget Sound SalishRomanianRussianSalvadoranSamoanScandinavianScotch-IrishScottishSeminoleSenegaleseSerbianShoshoneSierra LeoneanSiouxSlavicSlovakSloveneSomaliSouth AfricanSouth AmericanSouth American IndianSoviet UnionSpaniardSpanishSpanish AmericanSpanish American IndianSri LankanSubsaharan AfricanSudaneseSwedishSwissSyrianTaiwaneseThaiTlingit-HaidaTohono O'OdhamTonganTrinidadian and TobagonianTsimshianTurkishU.S. Virgin IslanderUgandanUkrainianUruguayanUteVenezuelanVietnameseWelshWest IndianYakamaYaquiYugoslavianYumanYup'ikZimbabwean
Immigration
NonimmigrantsImmigrantsAfghanistanAfricaAlbaniaArgentinaArmeniaAsiaAustraliaAustriaBahamasBangladeshBarbadosBelarusBelgiumBelizeBoliviaBosnia and HerzegovinaBrazilBulgariaBurma/MyanmarCabo VerdeCambodiaCameroonCanadaCaribbeanCentral AmericaChileChinaColombiaCongoCosta RicaCroatiaCubaCzechoslovakiaDenmarkDominicaDominican RepublicEastern AfricaEastern AsiaEastern EuropeEcuadorEgyptEl SalvadorEnglandEritreaEthiopiaEuropeFijiFranceGermanyGhanaGreeceGrenadaGuatemalaGuyanaHaitiHondurasHong KongHungaryIndiaIndonesiaIranIraqIrelandIsraelItalyJamaicaJapanJordanKazakhstanKenyaKoreaKuwaitLaosLatin AmericaLatviaLebanonLiberiaLithuaniaMalaysiaMexicoMicronesiaMiddle AfricaMoldovaMoroccoNepalNetherlandsNicaraguaNigeriaNorth AmericaNorth MacedoniaNorthern AfricaNorthern EuropeNorwayOceaniaPakistanPanamaPeruPhilippinesPolandPortugalRomaniaRussiaSaudi ArabiaScotlandSenegalSerbiaSierra LeoneSingaporeSomaliaSouth AfricaSouth AmericaSouth Central AsiaSouth Eastern AsiaSouthern EuropeSpainSri LankaSt. Vincent and the GrenadinesSudanSwedenSwitzerlandSyriaTaiwanThailandTrinidad and TobagoTurkeyUgandaUkraineUruguayUzbekistanVenezuelaVietnamWest IndiesWestern AfricaWestern AsiaWestern EuropeYemenZaireZimbabweAzores
Select to Compare
Race
Ancestry
AfghanAfricanAlaska NativeAlaskan AthabascanAlbanianAleutAlsatianAmericanApacheArabArapahoArgentineanArmenianAssyrian/Chaldean/SyriacAustralianAustrianBahamianBangladeshiBarbadianBasqueBelgianBelizeanBermudanBhutaneseBlackfeetBolivianBrazilianBritishBritish West IndianBulgarianBurmeseCajunCambodianCanadianCape VerdeanCarpatho RusynCelticCentral AmericanCentral American IndianCherokeeCheyenneChickasawChileanChineseChippewaChoctawColombianColvilleComancheCosta RicanCreeCreekCroatianCrowCubanCypriotCzechCzechoslovakianDanishDelawareDominicanDutchDutch West IndianEastern EuropeanEcuadorianEgyptianEnglishEstonianEthiopianEuropeanFijianFilipinoFinnishFrenchFrench American IndianFrench CanadianGermanGerman RussianGhanaianGreekGuamanian/ChamorroGuatemalanGuyaneseHaitianHmongHonduranHopiHoumaHungarianIcelanderIndian (Asian)IndonesianInupiatIranianIraqiIrishIroquoisIsraeliItalianJamaicanJapaneseJordanianKenyanKiowaKoreanLaotianLatvianLebaneseLiberianLithuanianLumbeeLuxembourgerMacedonianMalaysianMalteseMarshalleseMenomineeMexicanMexican American IndianMongolianMoroccanNative HawaiianNavajoNepaleseNew ZealanderNicaraguanNigerianNorthern EuropeanNorwegianOkinawanOsageOttawaPaiutePakistaniPalestinianPanamanianParaguayanPennsylvania GermanPeruvianPimaPolishPortuguesePotawatomiPuebloPuerto RicanPuget Sound SalishRomanianRussianSalvadoranSamoanScandinavianScotch-IrishScottishSeminoleSenegaleseSerbianShoshoneSierra LeoneanSiouxSlavicSlovakSloveneSomaliSouth AfricanSouth AmericanSouth American IndianSoviet UnionSpaniardSpanishSpanish AmericanSpanish American IndianSri LankanSubsaharan AfricanSudaneseSwedishSwissSyrianTaiwaneseThaiTlingit-HaidaTohono O'OdhamTonganTrinidadian and TobagonianTsimshianTurkishU.S. Virgin IslanderUgandanUkrainianUruguayanUteVenezuelanVietnameseWelshWest IndianYakamaYaquiYugoslavianYumanYup'ikZimbabwean
Immigration
NonimmigrantsImmigrantsAfghanistanAfricaAlbaniaArgentinaArmeniaAsiaAustraliaAustriaBahamasBangladeshBarbadosBelarusBelgiumBelizeBoliviaBosnia and HerzegovinaBrazilBulgariaBurma/MyanmarCabo VerdeCambodiaCameroonCanadaCaribbeanCentral AmericaChileChinaColombiaCongoCosta RicaCroatiaCubaCzechoslovakiaDenmarkDominicaDominican RepublicEastern AfricaEastern AsiaEastern EuropeEcuadorEgyptEl SalvadorEnglandEritreaEthiopiaEuropeFijiFranceGermanyGhanaGreeceGrenadaGuatemalaGuyanaHaitiHondurasHong KongHungaryIndiaIndonesiaIranIraqIrelandIsraelItalyJamaicaJapanJordanKazakhstanKenyaKoreaKuwaitLaosLatin AmericaLatviaLebanonLiberiaLithuaniaMalaysiaMexicoMicronesiaMiddle AfricaMoldovaMoroccoNepalNetherlandsNicaraguaNigeriaNorth AmericaNorth MacedoniaNorthern AfricaNorthern EuropeNorwayOceaniaPakistanPanamaPeruPhilippinesPolandPortugalRomaniaRussiaSaudi ArabiaScotlandSenegalSerbiaSierra LeoneSomaliaSouth AfricaSouth AmericaSouth Central AsiaSouth Eastern AsiaSouthern EuropeSpainSri LankaSt. Vincent and the GrenadinesSudanSwedenSwitzerlandSyriaTaiwanThailandTrinidad and TobagoTurkeyUgandaUkraineUruguayUzbekistanVenezuelaVietnamWest IndiesWestern AfricaWestern AsiaWestern EuropeYemenZaireZimbabweAzores
Disability Age 5 to 17
Income
Poverty
Unemployment
Labor Participation
Family Structure
Vehicle Availability
Education Level
Disability

Immigrants from Singapore Disability Age 5 to 17
Exceptional

4.7%
DISABILITY | AGE 5 TO 17
100.0/ 100
METRIC RATING
16th/ 347
METRIC RANK

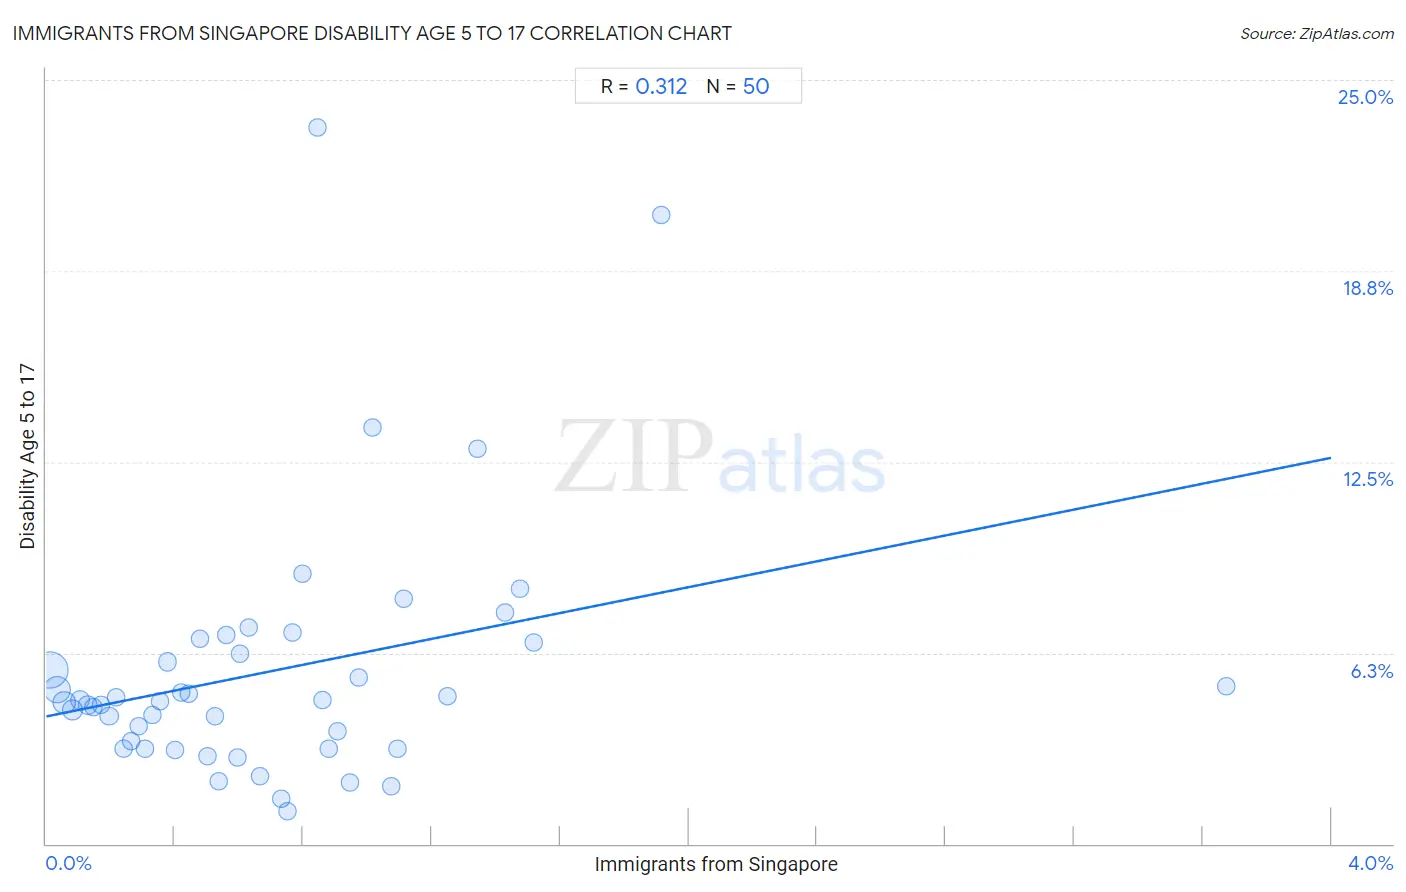
Immigrants from Singapore Disability Age 5 to 17 Correlation Chart

The statistical analysis conducted on geographies consisting of 136,920,724 people shows a mild positive correlation between the proportion of Immigrants from Singapore and percentage of population with a disability between the ages 5 and 17 in the United States with a correlation coefficient (R) of 0.312 and weighted average of 4.7%. On average, for every 1% (one percent) increase in Immigrants from Singapore within a typical geography, there is an increase of 2.1% in percentage of population with a disability between the ages 5 and 17.
Immigrants from Singapore Disability Age 5 to 17
It is essential to understand that the correlation between the percentage of Immigrants from Singapore and percentage of population with a disability between the ages 5 and 17 does not imply a direct cause-and-effect relationship. It remains uncertain whether the presence of Immigrants from Singapore influences an upward or downward trend in the level of percentage of population with a disability between the ages 5 and 17 within an area, or if Immigrants from Singapore simply ended up residing in those areas with higher or lower levels of percentage of population with a disability between the ages 5 and 17 due to other factors.

Demographics Similar to Immigrants from Singapore by Disability Age 5 to 17

In terms of disability age 5 to 17, the demographic groups most similar to Immigrants from Singapore are Chinese (4.7%, a difference of 0.42%), Arapaho (4.7%, a difference of 0.46%), Immigrants from South Central Asia (4.7%, a difference of 0.48%), Immigrants from Korea (4.7%, a difference of 0.63%), and Immigrants from Uzbekistan (4.8%, a difference of 0.97%).
DemographicsRating | RankDisability Age 5 to 17
Immigrants from Eastern Asia
100.0
/100
|
#9
Exceptional
4.6%
Immigrants from India
100.0
/100
|
#10
Exceptional
4.6%
Armenians
100.0
/100
|
#11
Exceptional
4.6%
Iranians
100.0
/100
|
#12
Exceptional
4.6%
Thais
100.0
/100
|
#13
Exceptional
4.7%
Immigrants from Korea
100.0
/100
|
#14
Exceptional
4.7%
Chinese
100.0
/100
|
#15
Exceptional
4.7%
Immigrants from Singapore
100.0
/100
|
#16
Exceptional
4.7%
Arapaho
100.0
/100
|
#17
Exceptional
4.7%
Immigrants from South Central Asia
100.0
/100
|
#18
Exceptional
4.7%
Immigrants from Uzbekistan
100.0
/100
|
#19
Exceptional
4.8%
Burmese
100.0
/100
|
#20
Exceptional
4.8%
Yup'ik
100.0
/100
|
#21
Exceptional
4.8%
Asians
100.0
/100
|
#22
Exceptional
4.8%
Immigrants from Bolivia
100.0
/100
|
#23
Exceptional
4.8%

Immigrants from Singapore Disability Age 5 to 17 Correlation Summary

MeasurementImmigrants from Singapore DataDisability Age 5 to 17 Data
Minimum0.011%1.1%
Maximum3.7%23.4%
Range3.7%22.4%
Mean0.70%5.6%
Median0.58%4.7%
Interquartile 25% (IQ1)0.29%3.1%
Interquartile 75% (IQ3)0.95%6.6%
Interquartile Range (IQR)0.66%3.5%
Standard Deviation (Sample)0.62%4.2%
Standard Deviation (Population)0.61%4.1%

Correlation Details

Immigrants from Singapore PercentileSample SizeDisability Age 5 to 17
[
0.0%
-
0.5%
]
0.011%
64,967,5645.7%
[
0.0%
-
0.5%
]
0.033%
32,455,5925.0%
[
0.0%
-
0.5%
]
0.056%
13,800,7414.6%
[
0.0%
-
0.5%
]
0.080%
8,903,5854.4%
[
0.0%
-
0.5%
]
0.10%
4,154,9494.7%
[
0.0%
-
0.5%
]
0.13%
3,144,4234.5%
[
0.0%
-
0.5%
]
0.15%
2,353,1894.5%
[
0.0%
-
0.5%
]
0.17%
1,258,2734.6%
[
0.0%
-
0.5%
]
0.20%
1,180,0754.2%
[
0.0%
-
0.5%
]
0.22%
1,160,3724.8%
[
0.0%
-
0.5%
]
0.24%
821,9713.1%
[
0.0%
-
0.5%
]
0.26%
626,9343.4%
[
0.0%
-
0.5%
]
0.29%
441,4943.9%
[
0.0%
-
0.5%
]
0.31%
257,7313.1%
[
0.0%
-
0.5%
]
0.33%
178,1374.2%
[
0.0%
-
0.5%
]
0.35%
51,8764.7%
[
0.0%
-
0.5%
]
0.38%
187,0056.0%
[
0.0%
-
0.5%
]
0.40%
77,5343.1%
[
0.0%
-
0.5%
]
0.42%
86,6415.0%
[
0.0%
-
0.5%
]
0.44%
132,3504.9%
[
0.0%
-
0.5%
]
0.48%
63,9866.7%
[
0.5%
-
1.0%
]
0.50%
62,2142.9%
[
0.5%
-
1.0%
]
0.53%
86,2724.2%
[
0.5%
-
1.0%
]
0.54%
17,7562.0%
[
0.5%
-
1.0%
]
0.56%
55,0486.8%
[
0.5%
-
1.0%
]
0.60%
59,6322.8%
[
0.5%
-
1.0%
]
0.60%
25,1936.2%
[
0.5%
-
1.0%
]
0.63%
44,9657.1%
[
0.5%
-
1.0%
]
0.66%
6,7782.2%
[
0.5%
-
1.0%
]
0.73%
6,9721.5%
[
0.5%
-
1.0%
]
0.75%
2,1361.1%
[
0.5%
-
1.0%
]
0.77%
69,3856.9%
[
0.5%
-
1.0%
]
0.80%
14,7788.8%
[
0.5%
-
1.0%
]
0.84%
1,89423.4%
[
0.5%
-
1.0%
]
0.86%
26,9274.7%
[
0.5%
-
1.0%
]
0.88%
12,0393.1%
[
0.5%
-
1.0%
]
0.90%
22,1063.7%
[
0.5%
-
1.0%
]
0.95%
31,1852.0%
[
0.5%
-
1.0%
]
0.97%
2,4645.4%
[
1.0%
-
1.5%
]
1.02%
10,51713.6%
[
1.0%
-
1.5%
]
1.07%
10,5341.9%
[
1.0%
-
1.5%
]
1.09%
11,9893.1%
[
1.0%
-
1.5%
]
1.11%
1808.0%
[
1.0%
-
1.5%
]
1.25%
17,6244.8%
[
1.0%
-
1.5%
]
1.34%
4,47412.9%
[
1.0%
-
1.5%
]
1.43%
3,5717.6%
[
1.0%
-
1.5%
]
1.48%
6,3688.4%
[
1.5%
-
2.0%
]
1.52%
3956.6%
[
1.5%
-
2.0%
]
1.91%
2,08920.6%
[
3.5%
-
4.0%
]
3.67%
8175.2%