Slovene Disability Age 5 to 17
COMPARE
Slovene
Select to Compare
Disability Age 5 to 17
Slovene Disability Age 5 to 17
6.0%
DISABILITY | AGE 5 TO 17
0.6/ 100
METRIC RATING
266th/ 347
METRIC RANK
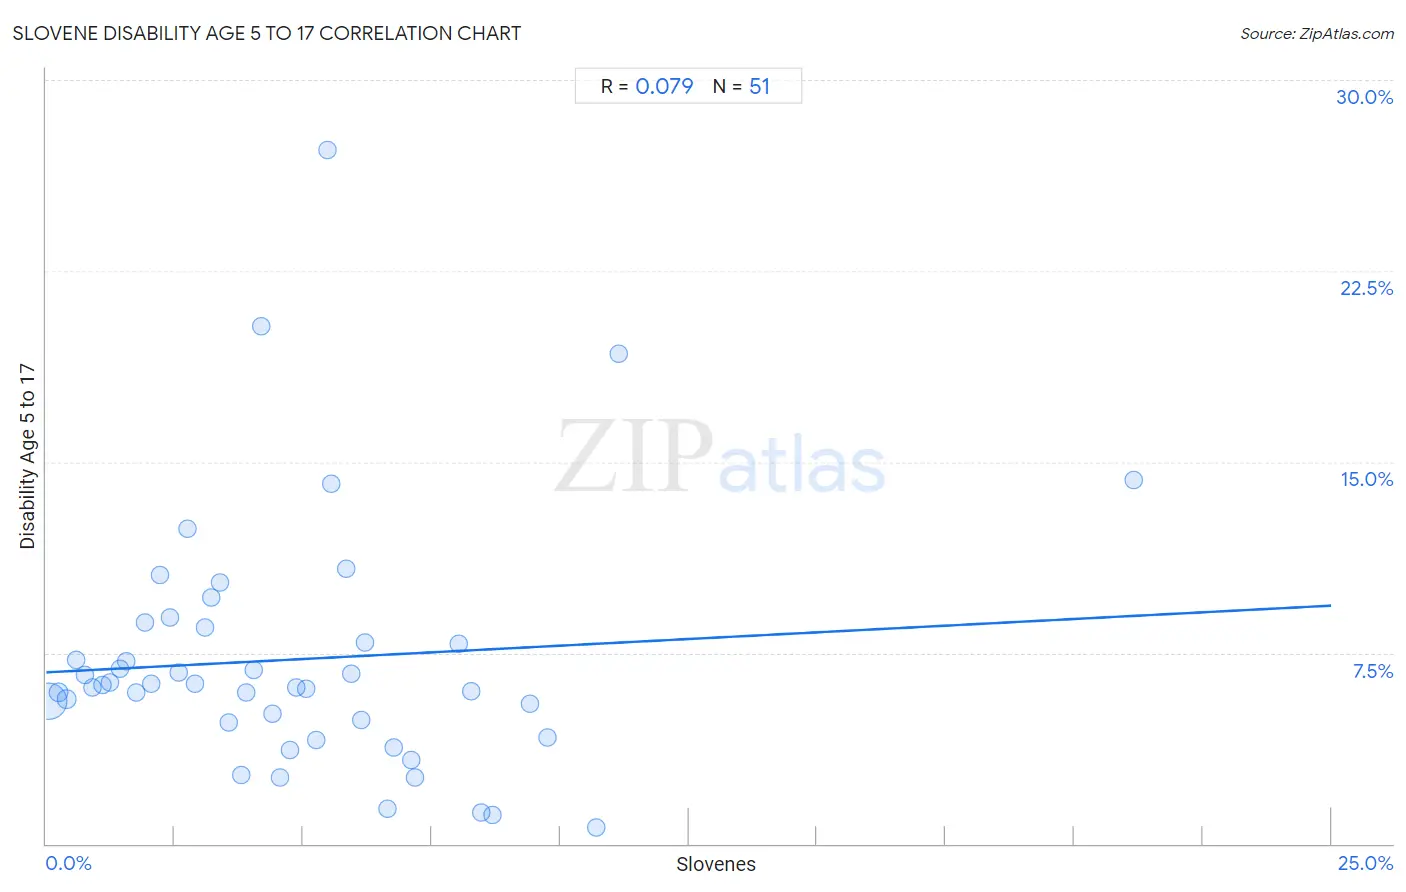
Slovene Disability Age 5 to 17 Correlation Chart
The statistical analysis conducted on geographies consisting of 259,532,016 people shows a slight positive correlation between the proportion of Slovenes and percentage of population with a disability between the ages 5 and 17 in the United States with a correlation coefficient (R) of 0.079 and weighted average of 6.0%. On average, for every 1% (one percent) increase in Slovenes within a typical geography, there is an increase of 0.10% in percentage of population with a disability between the ages 5 and 17.
It is essential to understand that the correlation between the percentage of Slovenes and percentage of population with a disability between the ages 5 and 17 does not imply a direct cause-and-effect relationship. It remains uncertain whether the presence of Slovenes influences an upward or downward trend in the level of percentage of population with a disability between the ages 5 and 17 within an area, or if Slovenes simply ended up residing in those areas with higher or lower levels of percentage of population with a disability between the ages 5 and 17 due to other factors.
Demographics Similar to Slovenes by Disability Age 5 to 17
In terms of disability age 5 to 17, the demographic groups most similar to Slovenes are Panamanian (6.0%, a difference of 0.030%), Canadian (6.0%, a difference of 0.10%), Spanish (6.0%, a difference of 0.11%), Czechoslovakian (5.9%, a difference of 0.22%), and Immigrants from Western Africa (5.9%, a difference of 0.30%).
| Demographics | Rating | Rank | Disability Age 5 to 17 |
| Slavs | 0.9 /100 | #259 | Tragic 5.9% |
| Somalis | 0.8 /100 | #260 | Tragic 5.9% |
| Immigrants from Middle Africa | 0.7 /100 | #261 | Tragic 5.9% |
| Immigrants from Western Africa | 0.7 /100 | #262 | Tragic 5.9% |
| Czechoslovakians | 0.7 /100 | #263 | Tragic 5.9% |
| Canadians | 0.6 /100 | #264 | Tragic 6.0% |
| Panamanians | 0.6 /100 | #265 | Tragic 6.0% |
| Slovenes | 0.6 /100 | #266 | Tragic 6.0% |
| Spanish | 0.5 /100 | #267 | Tragic 6.0% |
| Sioux | 0.4 /100 | #268 | Tragic 6.0% |
| Liberians | 0.4 /100 | #269 | Tragic 6.0% |
| Immigrants from Somalia | 0.4 /100 | #270 | Tragic 6.0% |
| Immigrants from Zaire | 0.2 /100 | #271 | Tragic 6.0% |
| Finns | 0.2 /100 | #272 | Tragic 6.0% |
| Alaska Natives | 0.2 /100 | #273 | Tragic 6.0% |
Slovene Disability Age 5 to 17 Correlation Summary
| Measurement | Slovene Data | Disability Age 5 to 17 Data |
| Minimum | 0.049% | 0.63% |
| Maximum | 21.2% | 27.3% |
| Range | 21.1% | 26.6% |
| Mean | 4.8% | 7.2% |
| Median | 4.2% | 6.2% |
| Interquartile 25% (IQ1) | 2.0% | 4.8% |
| Interquartile 75% (IQ3) | 6.6% | 8.5% |
| Interquartile Range (IQR) | 4.6% | 3.7% |
| Standard Deviation (Sample) | 3.7% | 4.9% |
| Standard Deviation (Population) | 3.7% | 4.9% |
Correlation Details
| Slovene Percentile | Sample Size | Disability Age 5 to 17 |
[ 0.0% - 0.5% ] 0.049% | 225,366,023 | 5.6% |
[ 0.0% - 0.5% ] 0.23% | 19,201,120 | 5.9% |
[ 0.0% - 0.5% ] 0.40% | 5,851,797 | 5.7% |
[ 0.5% - 1.0% ] 0.58% | 2,974,030 | 7.2% |
[ 0.5% - 1.0% ] 0.74% | 1,726,176 | 6.6% |
[ 0.5% - 1.0% ] 0.90% | 1,175,131 | 6.1% |
[ 1.0% - 1.5% ] 1.10% | 437,488 | 6.2% |
[ 1.0% - 1.5% ] 1.25% | 722,444 | 6.3% |
[ 1.0% - 1.5% ] 1.43% | 412,395 | 6.9% |
[ 1.5% - 2.0% ] 1.56% | 219,975 | 7.2% |
[ 1.5% - 2.0% ] 1.75% | 258,538 | 5.9% |
[ 1.5% - 2.0% ] 1.92% | 108,344 | 8.7% |
[ 2.0% - 2.5% ] 2.05% | 194,708 | 6.3% |
[ 2.0% - 2.5% ] 2.21% | 51,157 | 10.6% |
[ 2.0% - 2.5% ] 2.40% | 80,995 | 8.9% |
[ 2.5% - 3.0% ] 2.58% | 37,913 | 6.7% |
[ 2.5% - 3.0% ] 2.75% | 45,144 | 12.4% |
[ 2.5% - 3.0% ] 2.90% | 42,179 | 6.3% |
[ 3.0% - 3.5% ] 3.09% | 47,590 | 8.5% |
[ 3.0% - 3.5% ] 3.22% | 12,667 | 9.7% |
[ 3.0% - 3.5% ] 3.38% | 26,029 | 10.3% |
[ 3.5% - 4.0% ] 3.54% | 74,815 | 4.8% |
[ 3.5% - 4.0% ] 3.80% | 14,444 | 2.7% |
[ 3.5% - 4.0% ] 3.89% | 5,656 | 5.9% |
[ 4.0% - 4.5% ] 4.05% | 3,188 | 6.8% |
[ 4.0% - 4.5% ] 4.18% | 3,685 | 20.3% |
[ 4.0% - 4.5% ] 4.40% | 10,420 | 5.1% |
[ 4.5% - 5.0% ] 4.54% | 9,815 | 2.6% |
[ 4.5% - 5.0% ] 4.74% | 24,639 | 3.7% |
[ 4.5% - 5.0% ] 4.87% | 61,500 | 6.2% |
[ 5.0% - 5.5% ] 5.05% | 59,261 | 6.1% |
[ 5.0% - 5.5% ] 5.25% | 84,802 | 4.1% |
[ 5.0% - 5.5% ] 5.47% | 439 | 27.3% |
[ 5.5% - 6.0% ] 5.55% | 1,261 | 14.1% |
[ 5.5% - 6.0% ] 5.83% | 3,500 | 10.8% |
[ 5.5% - 6.0% ] 5.93% | 37,800 | 6.7% |
[ 6.0% - 6.5% ] 6.14% | 1,564 | 4.9% |
[ 6.0% - 6.5% ] 6.20% | 3,112 | 7.9% |
[ 6.5% - 7.0% ] 6.63% | 7,539 | 1.4% |
[ 6.5% - 7.0% ] 6.76% | 38,036 | 3.8% |
[ 7.0% - 7.5% ] 7.11% | 830 | 3.3% |
[ 7.0% - 7.5% ] 7.17% | 37,812 | 2.6% |
[ 8.0% - 8.5% ] 8.03% | 822 | 7.8% |
[ 8.0% - 8.5% ] 8.27% | 12,661 | 6.0% |
[ 8.0% - 8.5% ] 8.47% | 1,912 | 1.2% |
[ 8.5% - 9.0% ] 8.67% | 9,972 | 1.1% |
[ 9.0% - 9.5% ] 9.40% | 17,138 | 5.5% |
[ 9.5% - 10.0% ] 9.75% | 7,449 | 4.2% |
[ 10.5% - 11.0% ] 10.70% | 5,297 | 0.63% |
[ 11.0% - 11.5% ] 11.14% | 700 | 19.3% |
[ 21.0% - 21.5% ] 21.15% | 104 | 14.3% |