Immigrants from Liberia Disability Age 5 to 17

COMPARE

Immigrants from Liberia
Race
Ancestry
AfghanAfricanAlaska NativeAlaskan AthabascanAlbanianAleutAlsatianAmericanApacheArabArapahoArgentineanArmenianAssyrian/Chaldean/SyriacAustralianAustrianBahamianBangladeshiBarbadianBasqueBelgianBelizeanBermudanBhutaneseBlackfeetBolivianBrazilianBritishBritish West IndianBulgarianBurmeseCajunCambodianCanadianCape VerdeanCarpatho RusynCelticCentral AmericanCentral American IndianCherokeeCheyenneChickasawChileanChineseChippewaChoctawColombianColvilleComancheCosta RicanCreeCreekCroatianCrowCubanCypriotCzechCzechoslovakianDanishDelawareDominicanDutchDutch West IndianEastern EuropeanEcuadorianEgyptianEnglishEstonianEthiopianEuropeanFijianFilipinoFinnishFrenchFrench American IndianFrench CanadianGermanGerman RussianGhanaianGreekGuamanian/ChamorroGuatemalanGuyaneseHaitianHmongHonduranHopiHoumaHungarianIcelanderIndian (Asian)IndonesianInupiatIranianIraqiIrishIroquoisIsraeliItalianJamaicanJapaneseJordanianKenyanKiowaKoreanLaotianLatvianLebaneseLiberianLithuanianLumbeeLuxembourgerMacedonianMalaysianMalteseMarshalleseMenomineeMexicanMexican American IndianMongolianMoroccanNative HawaiianNavajoNepaleseNew ZealanderNicaraguanNigerianNorthern EuropeanNorwegianOkinawanOsageOttawaPaiutePakistaniPalestinianPanamanianParaguayanPennsylvania GermanPeruvianPimaPolishPortuguesePotawatomiPuebloPuerto RicanPuget Sound SalishRomanianRussianSalvadoranSamoanScandinavianScotch-IrishScottishSeminoleSenegaleseSerbianShoshoneSierra LeoneanSiouxSlavicSlovakSloveneSomaliSouth AfricanSouth AmericanSouth American IndianSoviet UnionSpaniardSpanishSpanish AmericanSpanish American IndianSri LankanSubsaharan AfricanSudaneseSwedishSwissSyrianTaiwaneseThaiTlingit-HaidaTohono O'OdhamTonganTrinidadian and TobagonianTsimshianTurkishU.S. Virgin IslanderUgandanUkrainianUruguayanUteVenezuelanVietnameseWelshWest IndianYakamaYaquiYugoslavianYumanYup'ikZimbabwean
Immigration
NonimmigrantsImmigrantsAfghanistanAfricaAlbaniaArgentinaArmeniaAsiaAustraliaAustriaBahamasBangladeshBarbadosBelarusBelgiumBelizeBoliviaBosnia and HerzegovinaBrazilBulgariaBurma/MyanmarCabo VerdeCambodiaCameroonCanadaCaribbeanCentral AmericaChileChinaColombiaCongoCosta RicaCroatiaCubaCzechoslovakiaDenmarkDominicaDominican RepublicEastern AfricaEastern AsiaEastern EuropeEcuadorEgyptEl SalvadorEnglandEritreaEthiopiaEuropeFijiFranceGermanyGhanaGreeceGrenadaGuatemalaGuyanaHaitiHondurasHong KongHungaryIndiaIndonesiaIranIraqIrelandIsraelItalyJamaicaJapanJordanKazakhstanKenyaKoreaKuwaitLaosLatin AmericaLatviaLebanonLiberiaLithuaniaMalaysiaMexicoMicronesiaMiddle AfricaMoldovaMoroccoNepalNetherlandsNicaraguaNigeriaNorth AmericaNorth MacedoniaNorthern AfricaNorthern EuropeNorwayOceaniaPakistanPanamaPeruPhilippinesPolandPortugalRomaniaRussiaSaudi ArabiaScotlandSenegalSerbiaSierra LeoneSingaporeSomaliaSouth AfricaSouth AmericaSouth Central AsiaSouth Eastern AsiaSouthern EuropeSpainSri LankaSt. Vincent and the GrenadinesSudanSwedenSwitzerlandSyriaTaiwanThailandTrinidad and TobagoTurkeyUgandaUkraineUruguayUzbekistanVenezuelaVietnamWest IndiesWestern AfricaWestern AsiaWestern EuropeYemenZaireZimbabweAzores
Select to Compare
Race
Ancestry
AfghanAfricanAlaska NativeAlaskan AthabascanAlbanianAleutAlsatianAmericanApacheArabArapahoArgentineanArmenianAssyrian/Chaldean/SyriacAustralianAustrianBahamianBangladeshiBarbadianBasqueBelgianBelizeanBermudanBhutaneseBlackfeetBolivianBrazilianBritishBritish West IndianBulgarianBurmeseCajunCambodianCanadianCape VerdeanCarpatho RusynCelticCentral AmericanCentral American IndianCherokeeCheyenneChickasawChileanChineseChippewaChoctawColombianColvilleComancheCosta RicanCreeCreekCroatianCrowCubanCypriotCzechCzechoslovakianDanishDelawareDominicanDutchDutch West IndianEastern EuropeanEcuadorianEgyptianEnglishEstonianEthiopianEuropeanFijianFilipinoFinnishFrenchFrench American IndianFrench CanadianGermanGerman RussianGhanaianGreekGuamanian/ChamorroGuatemalanGuyaneseHaitianHmongHonduranHopiHoumaHungarianIcelanderIndian (Asian)IndonesianInupiatIranianIraqiIrishIroquoisIsraeliItalianJamaicanJapaneseJordanianKenyanKiowaKoreanLaotianLatvianLebaneseLiberianLithuanianLumbeeLuxembourgerMacedonianMalaysianMalteseMarshalleseMenomineeMexicanMexican American IndianMongolianMoroccanNative HawaiianNavajoNepaleseNew ZealanderNicaraguanNigerianNorthern EuropeanNorwegianOkinawanOsageOttawaPaiutePakistaniPalestinianPanamanianParaguayanPennsylvania GermanPeruvianPimaPolishPortuguesePotawatomiPuebloPuerto RicanPuget Sound SalishRomanianRussianSalvadoranSamoanScandinavianScotch-IrishScottishSeminoleSenegaleseSerbianShoshoneSierra LeoneanSiouxSlavicSlovakSloveneSomaliSouth AfricanSouth AmericanSouth American IndianSoviet UnionSpaniardSpanishSpanish AmericanSpanish American IndianSri LankanSubsaharan AfricanSudaneseSwedishSwissSyrianTaiwaneseThaiTlingit-HaidaTohono O'OdhamTonganTrinidadian and TobagonianTsimshianTurkishU.S. Virgin IslanderUgandanUkrainianUruguayanUteVenezuelanVietnameseWelshWest IndianYakamaYaquiYugoslavianYumanYup'ikZimbabwean
Immigration
NonimmigrantsImmigrantsAfghanistanAfricaAlbaniaArgentinaArmeniaAsiaAustraliaAustriaBahamasBangladeshBarbadosBelarusBelgiumBelizeBoliviaBosnia and HerzegovinaBrazilBulgariaBurma/MyanmarCabo VerdeCambodiaCameroonCanadaCaribbeanCentral AmericaChileChinaColombiaCongoCosta RicaCroatiaCubaCzechoslovakiaDenmarkDominicaDominican RepublicEastern AfricaEastern AsiaEastern EuropeEcuadorEgyptEl SalvadorEnglandEritreaEthiopiaEuropeFijiFranceGermanyGhanaGreeceGrenadaGuatemalaGuyanaHaitiHondurasHong KongHungaryIndiaIndonesiaIranIraqIrelandIsraelItalyJamaicaJapanJordanKazakhstanKenyaKoreaKuwaitLaosLatin AmericaLatviaLebanonLithuaniaMalaysiaMexicoMicronesiaMiddle AfricaMoldovaMoroccoNepalNetherlandsNicaraguaNigeriaNorth AmericaNorth MacedoniaNorthern AfricaNorthern EuropeNorwayOceaniaPakistanPanamaPeruPhilippinesPolandPortugalRomaniaRussiaSaudi ArabiaScotlandSenegalSerbiaSierra LeoneSingaporeSomaliaSouth AfricaSouth AmericaSouth Central AsiaSouth Eastern AsiaSouthern EuropeSpainSri LankaSt. Vincent and the GrenadinesSudanSwedenSwitzerlandSyriaTaiwanThailandTrinidad and TobagoTurkeyUgandaUkraineUruguayUzbekistanVenezuelaVietnamWest IndiesWestern AfricaWestern AsiaWestern EuropeYemenZaireZimbabweAzores
Disability Age 5 to 17
Income
Poverty
Unemployment
Labor Participation
Family Structure
Vehicle Availability
Education Level
Disability

Immigrants from Liberia Disability Age 5 to 17
Tragic

6.1%
DISABILITY | AGE 5 TO 17
0.1/ 100
METRIC RATING
278th/ 347
METRIC RANK

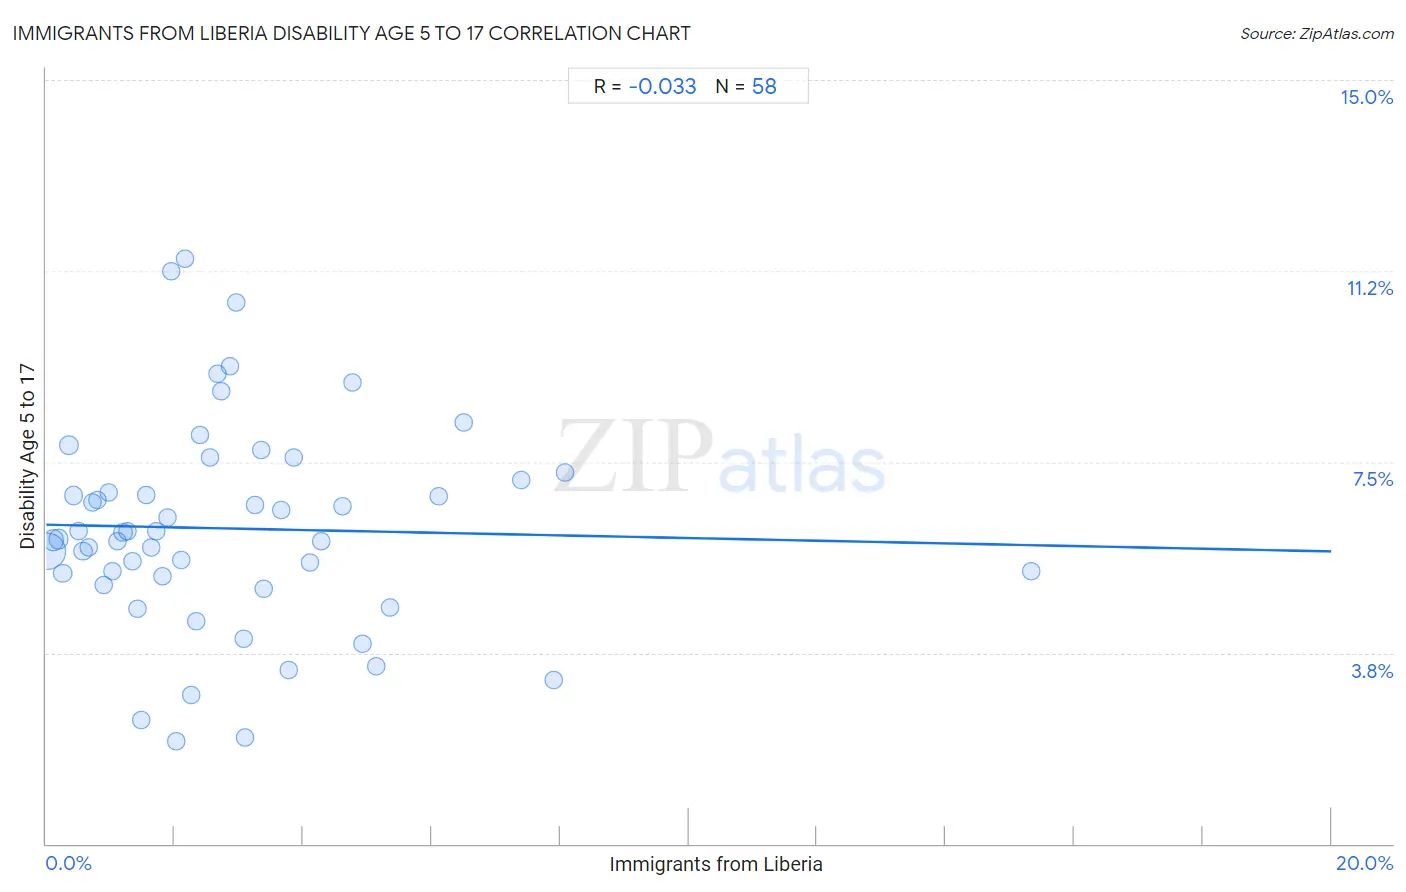
Immigrants from Liberia Disability Age 5 to 17 Correlation Chart

The statistical analysis conducted on geographies consisting of 135,071,303 people shows no correlation between the proportion of Immigrants from Liberia and percentage of population with a disability between the ages 5 and 17 in the United States with a correlation coefficient (R) of -0.033 and weighted average of 6.1%. On average, for every 1% (one percent) increase in Immigrants from Liberia within a typical geography, there is a decrease of 0.026% in percentage of population with a disability between the ages 5 and 17.
Immigrants from Liberia Disability Age 5 to 17
It is essential to understand that the correlation between the percentage of Immigrants from Liberia and percentage of population with a disability between the ages 5 and 17 does not imply a direct cause-and-effect relationship. It remains uncertain whether the presence of Immigrants from Liberia influences an upward or downward trend in the level of percentage of population with a disability between the ages 5 and 17 within an area, or if Immigrants from Liberia simply ended up residing in those areas with higher or lower levels of percentage of population with a disability between the ages 5 and 17 due to other factors.

Demographics Similar to Immigrants from Liberia by Disability Age 5 to 17

In terms of disability age 5 to 17, the demographic groups most similar to Immigrants from Liberia are Puget Sound Salish (6.1%, a difference of 0.080%), Immigrants from Jamaica (6.1%, a difference of 0.14%), Portuguese (6.1%, a difference of 0.28%), Scottish (6.1%, a difference of 0.53%), and German (6.1%, a difference of 0.78%).
DemographicsRating | RankDisability Age 5 to 17
Immigrants from Zaire
0.2
/100
|
#271
Tragic
6.0%
Finns
0.2
/100
|
#272
Tragic
6.0%
Alaska Natives
0.2
/100
|
#273
Tragic
6.0%
Cheyenne
0.2
/100
|
#274
Tragic
6.0%
Dutch
0.2
/100
|
#275
Tragic
6.0%
Japanese
0.1
/100
|
#276
Tragic
6.1%
Puget Sound Salish
0.1
/100
|
#277
Tragic
6.1%
Immigrants from Liberia
0.1
/100
|
#278
Tragic
6.1%
Immigrants from Jamaica
0.1
/100
|
#279
Tragic
6.1%
Portuguese
0.1
/100
|
#280
Tragic
6.1%
Scottish
0.0
/100
|
#281
Tragic
6.1%
Germans
0.0
/100
|
#282
Tragic
6.1%
Ugandans
0.0
/100
|
#283
Tragic
6.2%
Sub-Saharan Africans
0.0
/100
|
#284
Tragic
6.2%
English
0.0
/100
|
#285
Tragic
6.2%

Immigrants from Liberia Disability Age 5 to 17 Correlation Summary

MeasurementImmigrants from Liberia DataDisability Age 5 to 17 Data
Minimum0.028%2.0%
Maximum15.3%11.5%
Range15.3%9.5%
Mean2.8%6.2%
Median2.2%6.0%
Interquartile 25% (IQ1)1.1%5.3%
Interquartile 75% (IQ3)3.8%7.1%
Interquartile Range (IQR)2.7%1.9%
Standard Deviation (Sample)2.6%2.0%
Standard Deviation (Population)2.6%2.0%

Correlation Details

Immigrants from Liberia PercentileSample SizeDisability Age 5 to 17
[
0.0%
-
0.5%
]
0.028%
92,515,1365.8%
[
0.0%
-
0.5%
]
0.11%
16,853,8856.0%
[
0.0%
-
0.5%
]
0.19%
8,246,6086.0%
[
0.0%
-
0.5%
]
0.26%
4,324,2725.3%
[
0.0%
-
0.5%
]
0.35%
4,446,6837.8%
[
0.0%
-
0.5%
]
0.42%
1,571,8166.8%
[
0.0%
-
0.5%
]
0.50%
1,685,7526.1%
[
0.5%
-
1.0%
]
0.57%
905,0645.8%
[
0.5%
-
1.0%
]
0.66%
503,1625.8%
[
0.5%
-
1.0%
]
0.73%
374,9616.7%
[
0.5%
-
1.0%
]
0.80%
330,1766.7%
[
0.5%
-
1.0%
]
0.89%
181,9825.1%
[
0.5%
-
1.0%
]
0.96%
448,8266.9%
[
1.0%
-
1.5%
]
1.03%
347,3295.4%
[
1.0%
-
1.5%
]
1.11%
103,3065.9%
[
1.0%
-
1.5%
]
1.20%
517,5216.1%
[
1.0%
-
1.5%
]
1.26%
86,4446.1%
[
1.0%
-
1.5%
]
1.34%
107,1935.5%
[
1.0%
-
1.5%
]
1.42%
121,8844.6%
[
1.0%
-
1.5%
]
1.48%
8,7052.4%
[
1.5%
-
2.0%
]
1.56%
19,6656.8%
[
1.5%
-
2.0%
]
1.64%
113,5935.8%
[
1.5%
-
2.0%
]
1.72%
176,6686.1%
[
1.5%
-
2.0%
]
1.81%
42,2575.3%
[
1.5%
-
2.0%
]
1.89%
56,5726.4%
[
1.5%
-
2.0%
]
1.94%
23,10111.2%
[
2.0%
-
2.5%
]
2.03%
9,5072.0%
[
2.0%
-
2.5%
]
2.10%
52,6555.6%
[
2.0%
-
2.5%
]
2.17%
47,72911.5%
[
2.0%
-
2.5%
]
2.25%
33,6202.9%
[
2.0%
-
2.5%
]
2.34%
95,0094.4%
[
2.0%
-
2.5%
]
2.40%
91,6928.0%
[
2.5%
-
3.0%
]
2.55%
50,4647.6%
[
2.5%
-
3.0%
]
2.67%
12,0179.2%
[
2.5%
-
3.0%
]
2.73%
13,8118.9%
[
2.5%
-
3.0%
]
2.87%
35,2449.4%
[
2.5%
-
3.0%
]
2.95%
1,73010.6%
[
3.0%
-
3.5%
]
3.07%
17,7164.0%
[
3.0%
-
3.5%
]
3.10%
3,4862.1%
[
3.0%
-
3.5%
]
3.25%
30,5446.6%
[
3.0%
-
3.5%
]
3.34%
8,5967.7%
[
3.0%
-
3.5%
]
3.39%
48,5775.0%
[
3.5%
-
4.0%
]
3.66%
23,3636.6%
[
3.5%
-
4.0%
]
3.78%
32,9123.4%
[
3.5%
-
4.0%
]
3.86%
1,4257.6%
[
4.0%
-
4.5%
]
4.10%
11,0515.5%
[
4.0%
-
4.5%
]
4.27%
14,5505.9%
[
4.5%
-
5.0%
]
4.60%
22,3376.6%
[
4.5%
-
5.0%
]
4.76%
21,6209.1%
[
4.5%
-
5.0%
]
4.93%
23,8043.9%
[
5.0%
-
5.5%
]
5.14%
84,9513.5%
[
5.0%
-
5.5%
]
5.35%
37,1694.6%
[
6.0%
-
6.5%
]
6.12%
32,9676.8%
[
6.0%
-
6.5%
]
6.49%
22,4938.3%
[
7.0%
-
7.5%
]
7.38%
35,7807.1%
[
7.5%
-
8.0%
]
7.91%
28,3923.2%
[
8.0%
-
8.5%
]
8.07%
10,6827.3%
[
15.0%
-
15.5%
]
15.34%
2,8495.4%