Immigrants from Laos Disability Age 5 to 17
COMPARE
Immigrants from Laos
Select to Compare
Disability Age 5 to 17
Immigrants from Laos Disability Age 5 to 17
5.8%
DISABILITY | AGE 5 TO 17
3.8/ 100
METRIC RATING
232nd/ 347
METRIC RANK
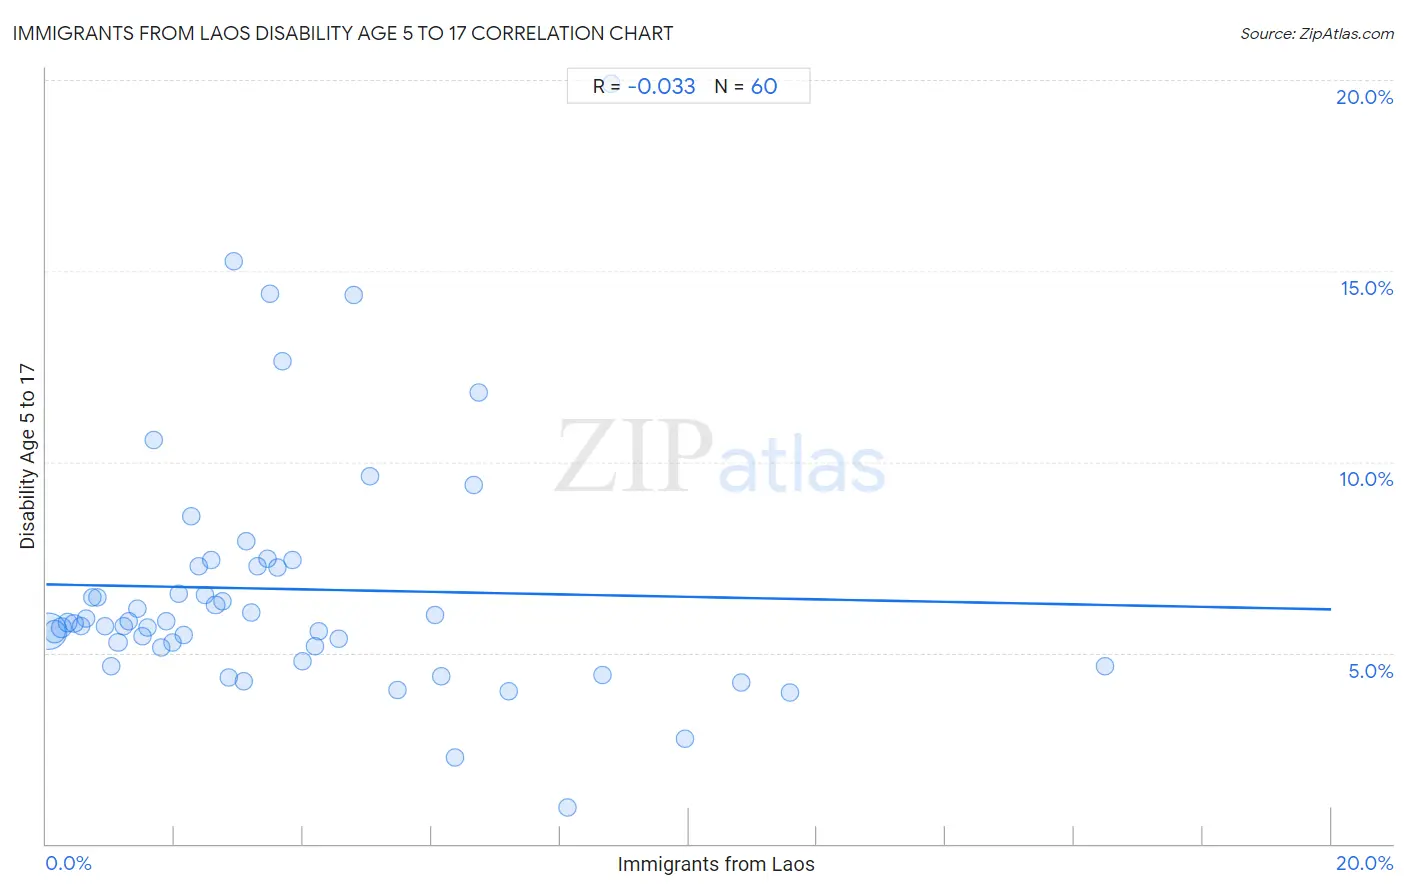
Immigrants from Laos Disability Age 5 to 17 Correlation Chart
The statistical analysis conducted on geographies consisting of 200,910,190 people shows no correlation between the proportion of Immigrants from Laos and percentage of population with a disability between the ages 5 and 17 in the United States with a correlation coefficient (R) of -0.033 and weighted average of 5.8%. On average, for every 1% (one percent) increase in Immigrants from Laos within a typical geography, there is a decrease of 0.033% in percentage of population with a disability between the ages 5 and 17.
It is essential to understand that the correlation between the percentage of Immigrants from Laos and percentage of population with a disability between the ages 5 and 17 does not imply a direct cause-and-effect relationship. It remains uncertain whether the presence of Immigrants from Laos influences an upward or downward trend in the level of percentage of population with a disability between the ages 5 and 17 within an area, or if Immigrants from Laos simply ended up residing in those areas with higher or lower levels of percentage of population with a disability between the ages 5 and 17 due to other factors.
Demographics Similar to Immigrants from Laos by Disability Age 5 to 17
In terms of disability age 5 to 17, the demographic groups most similar to Immigrants from Laos are Immigrants from West Indies (5.8%, a difference of 0.090%), Immigrants from Kenya (5.8%, a difference of 0.13%), Malaysian (5.8%, a difference of 0.14%), European (5.8%, a difference of 0.20%), and Immigrants from Brazil (5.8%, a difference of 0.20%).
| Demographics | Rating | Rank | Disability Age 5 to 17 |
| Guamanians/Chamorros | 5.6 /100 | #225 | Tragic 5.8% |
| British West Indians | 5.4 /100 | #226 | Tragic 5.8% |
| Swiss | 5.1 /100 | #227 | Tragic 5.8% |
| Haitians | 4.8 /100 | #228 | Tragic 5.8% |
| Bangladeshis | 4.8 /100 | #229 | Tragic 5.8% |
| Ghanaians | 4.7 /100 | #230 | Tragic 5.8% |
| Europeans | 4.5 /100 | #231 | Tragic 5.8% |
| Immigrants from Laos | 3.8 /100 | #232 | Tragic 5.8% |
| Immigrants from West Indies | 3.5 /100 | #233 | Tragic 5.8% |
| Immigrants from Kenya | 3.4 /100 | #234 | Tragic 5.8% |
| Malaysians | 3.4 /100 | #235 | Tragic 5.8% |
| Immigrants from Brazil | 3.2 /100 | #236 | Tragic 5.8% |
| Sudanese | 2.9 /100 | #237 | Tragic 5.8% |
| Hungarians | 2.6 /100 | #238 | Tragic 5.8% |
| German Russians | 2.4 /100 | #239 | Tragic 5.9% |
Immigrants from Laos Disability Age 5 to 17 Correlation Summary
| Measurement | Immigrants from Laos Data | Disability Age 5 to 17 Data |
| Minimum | 0.032% | 0.93% |
| Maximum | 16.5% | 19.9% |
| Range | 16.5% | 19.0% |
| Mean | 3.7% | 6.7% |
| Median | 2.9% | 5.8% |
| Interquartile 25% (IQ1) | 1.5% | 5.1% |
| Interquartile 75% (IQ3) | 4.9% | 7.3% |
| Interquartile Range (IQR) | 3.5% | 2.1% |
| Standard Deviation (Sample) | 3.2% | 3.3% |
| Standard Deviation (Population) | 3.2% | 3.2% |
Correlation Details
| Immigrants from Laos Percentile | Sample Size | Disability Age 5 to 17 |
[ 0.0% - 0.5% ] 0.032% | 130,001,557 | 5.6% |
[ 0.0% - 0.5% ] 0.13% | 30,029,426 | 5.6% |
[ 0.0% - 0.5% ] 0.23% | 14,747,500 | 5.7% |
[ 0.0% - 0.5% ] 0.33% | 7,149,688 | 5.8% |
[ 0.0% - 0.5% ] 0.43% | 4,131,191 | 5.8% |
[ 0.5% - 1.0% ] 0.54% | 2,745,101 | 5.7% |
[ 0.5% - 1.0% ] 0.62% | 2,686,336 | 5.9% |
[ 0.5% - 1.0% ] 0.72% | 1,279,193 | 6.5% |
[ 0.5% - 1.0% ] 0.80% | 1,255,896 | 6.5% |
[ 0.5% - 1.0% ] 0.91% | 814,119 | 5.7% |
[ 1.0% - 1.5% ] 1.01% | 438,498 | 4.7% |
[ 1.0% - 1.5% ] 1.12% | 1,199,152 | 5.3% |
[ 1.0% - 1.5% ] 1.20% | 542,162 | 5.7% |
[ 1.0% - 1.5% ] 1.29% | 388,284 | 5.8% |
[ 1.0% - 1.5% ] 1.41% | 1,108,295 | 6.2% |
[ 1.5% - 2.0% ] 1.51% | 102,603 | 5.4% |
[ 1.5% - 2.0% ] 1.58% | 100,924 | 5.7% |
[ 1.5% - 2.0% ] 1.68% | 175,754 | 10.6% |
[ 1.5% - 2.0% ] 1.78% | 172,250 | 5.1% |
[ 1.5% - 2.0% ] 1.87% | 140,535 | 5.8% |
[ 1.5% - 2.0% ] 1.97% | 262,666 | 5.3% |
[ 2.0% - 2.5% ] 2.07% | 63,158 | 6.5% |
[ 2.0% - 2.5% ] 2.15% | 66,887 | 5.5% |
[ 2.0% - 2.5% ] 2.26% | 75,379 | 8.6% |
[ 2.0% - 2.5% ] 2.37% | 74,457 | 7.3% |
[ 2.0% - 2.5% ] 2.48% | 69,767 | 6.5% |
[ 2.5% - 3.0% ] 2.57% | 56,868 | 7.4% |
[ 2.5% - 3.0% ] 2.64% | 336,095 | 6.3% |
[ 2.5% - 3.0% ] 2.74% | 56,927 | 6.4% |
[ 2.5% - 3.0% ] 2.83% | 74,172 | 4.4% |
[ 2.5% - 3.0% ] 2.93% | 5,295 | 15.2% |
[ 3.0% - 3.5% ] 3.07% | 32,651 | 4.2% |
[ 3.0% - 3.5% ] 3.10% | 290 | 7.9% |
[ 3.0% - 3.5% ] 3.20% | 92,651 | 6.1% |
[ 3.0% - 3.5% ] 3.28% | 3,902 | 7.3% |
[ 3.0% - 3.5% ] 3.45% | 8,580 | 7.5% |
[ 3.0% - 3.5% ] 3.48% | 1,178 | 14.4% |
[ 3.5% - 4.0% ] 3.60% | 70,364 | 7.2% |
[ 3.5% - 4.0% ] 3.68% | 598 | 12.6% |
[ 3.5% - 4.0% ] 3.84% | 41,405 | 7.4% |
[ 3.5% - 4.0% ] 3.99% | 146,187 | 4.8% |
[ 4.0% - 4.5% ] 4.18% | 34,220 | 5.2% |
[ 4.0% - 4.5% ] 4.24% | 802 | 5.6% |
[ 4.5% - 5.0% ] 4.55% | 14,391 | 5.4% |
[ 4.5% - 5.0% ] 4.79% | 1,003 | 14.4% |
[ 5.0% - 5.5% ] 5.05% | 2,595 | 9.6% |
[ 5.0% - 5.5% ] 5.47% | 17,716 | 4.0% |
[ 6.0% - 6.5% ] 6.06% | 57,662 | 6.0% |
[ 6.0% - 6.5% ] 6.16% | 991 | 4.4% |
[ 6.0% - 6.5% ] 6.36% | 3,208 | 2.3% |
[ 6.5% - 7.0% ] 6.65% | 19,613 | 9.4% |
[ 6.5% - 7.0% ] 6.74% | 1,900 | 11.8% |
[ 7.0% - 7.5% ] 7.19% | 153 | 4.0% |
[ 8.0% - 8.5% ] 8.11% | 2,207 | 0.93% |
[ 8.5% - 9.0% ] 8.65% | 1,052 | 4.4% |
[ 8.5% - 9.0% ] 8.80% | 1,693 | 19.9% |
[ 9.5% - 10.0% ] 9.93% | 1,218 | 2.7% |
[ 10.5% - 11.0% ] 10.82% | 564 | 4.2% |
[ 11.5% - 12.0% ] 11.57% | 527 | 3.9% |
[ 16.0% - 16.5% ] 16.49% | 734 | 4.6% |