Zimbabwean Disability Age 5 to 17

COMPARE

Zimbabwean
Race
Ancestry
AfghanAfricanAlaska NativeAlaskan AthabascanAlbanianAleutAlsatianAmericanApacheArabArapahoArgentineanArmenianAssyrian/Chaldean/SyriacAustralianAustrianBahamianBangladeshiBarbadianBasqueBelgianBelizeanBermudanBhutaneseBlackfeetBolivianBrazilianBritishBritish West IndianBulgarianBurmeseCajunCambodianCanadianCape VerdeanCarpatho RusynCelticCentral AmericanCentral American IndianCherokeeCheyenneChickasawChileanChineseChippewaChoctawColombianColvilleComancheCosta RicanCreeCreekCroatianCrowCubanCypriotCzechCzechoslovakianDanishDelawareDominicanDutchDutch West IndianEastern EuropeanEcuadorianEgyptianEnglishEstonianEthiopianEuropeanFijianFilipinoFinnishFrenchFrench American IndianFrench CanadianGermanGerman RussianGhanaianGreekGuamanian/ChamorroGuatemalanGuyaneseHaitianHmongHonduranHopiHoumaHungarianIcelanderIndian (Asian)IndonesianInupiatIranianIraqiIrishIroquoisIsraeliItalianJamaicanJapaneseJordanianKenyanKiowaKoreanLaotianLatvianLebaneseLiberianLithuanianLumbeeLuxembourgerMacedonianMalaysianMalteseMarshalleseMenomineeMexicanMexican American IndianMongolianMoroccanNative HawaiianNavajoNepaleseNew ZealanderNicaraguanNigerianNorthern EuropeanNorwegianOkinawanOsageOttawaPaiutePakistaniPalestinianPanamanianParaguayanPennsylvania GermanPeruvianPimaPolishPortuguesePotawatomiPuebloPuerto RicanPuget Sound SalishRomanianRussianSalvadoranSamoanScandinavianScotch-IrishScottishSeminoleSenegaleseSerbianShoshoneSierra LeoneanSiouxSlavicSlovakSloveneSomaliSouth AfricanSouth AmericanSouth American IndianSoviet UnionSpaniardSpanishSpanish AmericanSpanish American IndianSri LankanSubsaharan AfricanSudaneseSwedishSwissSyrianTaiwaneseThaiTlingit-HaidaTohono O'OdhamTonganTrinidadian and TobagonianTsimshianTurkishU.S. Virgin IslanderUgandanUkrainianUruguayanUteVenezuelanVietnameseWelshWest IndianYakamaYaquiYugoslavianYumanYup'ikZimbabwean
Immigration
NonimmigrantsImmigrantsAfghanistanAfricaAlbaniaArgentinaArmeniaAsiaAustraliaAustriaBahamasBangladeshBarbadosBelarusBelgiumBelizeBoliviaBosnia and HerzegovinaBrazilBulgariaBurma/MyanmarCabo VerdeCambodiaCameroonCanadaCaribbeanCentral AmericaChileChinaColombiaCongoCosta RicaCroatiaCubaCzechoslovakiaDenmarkDominicaDominican RepublicEastern AfricaEastern AsiaEastern EuropeEcuadorEgyptEl SalvadorEnglandEritreaEthiopiaEuropeFijiFranceGermanyGhanaGreeceGrenadaGuatemalaGuyanaHaitiHondurasHong KongHungaryIndiaIndonesiaIranIraqIrelandIsraelItalyJamaicaJapanJordanKazakhstanKenyaKoreaKuwaitLaosLatin AmericaLatviaLebanonLiberiaLithuaniaMalaysiaMexicoMicronesiaMiddle AfricaMoldovaMoroccoNepalNetherlandsNicaraguaNigeriaNorth AmericaNorth MacedoniaNorthern AfricaNorthern EuropeNorwayOceaniaPakistanPanamaPeruPhilippinesPolandPortugalRomaniaRussiaSaudi ArabiaScotlandSenegalSerbiaSierra LeoneSingaporeSomaliaSouth AfricaSouth AmericaSouth Central AsiaSouth Eastern AsiaSouthern EuropeSpainSri LankaSt. Vincent and the GrenadinesSudanSwedenSwitzerlandSyriaTaiwanThailandTrinidad and TobagoTurkeyUgandaUkraineUruguayUzbekistanVenezuelaVietnamWest IndiesWestern AfricaWestern AsiaWestern EuropeYemenZaireZimbabweAzores
Select to Compare
Race
Ancestry
AfghanAfricanAlaska NativeAlaskan AthabascanAlbanianAleutAlsatianAmericanApacheArabArapahoArgentineanArmenianAssyrian/Chaldean/SyriacAustralianAustrianBahamianBangladeshiBarbadianBasqueBelgianBelizeanBermudanBhutaneseBlackfeetBolivianBrazilianBritishBritish West IndianBulgarianBurmeseCajunCambodianCanadianCape VerdeanCarpatho RusynCelticCentral AmericanCentral American IndianCherokeeCheyenneChickasawChileanChineseChippewaChoctawColombianColvilleComancheCosta RicanCreeCreekCroatianCrowCubanCypriotCzechCzechoslovakianDanishDelawareDominicanDutchDutch West IndianEastern EuropeanEcuadorianEgyptianEnglishEstonianEthiopianEuropeanFijianFilipinoFinnishFrenchFrench American IndianFrench CanadianGermanGerman RussianGhanaianGreekGuamanian/ChamorroGuatemalanGuyaneseHaitianHmongHonduranHopiHoumaHungarianIcelanderIndian (Asian)IndonesianInupiatIranianIraqiIrishIroquoisIsraeliItalianJamaicanJapaneseJordanianKenyanKiowaKoreanLaotianLatvianLebaneseLiberianLithuanianLumbeeLuxembourgerMacedonianMalaysianMalteseMarshalleseMenomineeMexicanMexican American IndianMongolianMoroccanNative HawaiianNavajoNepaleseNew ZealanderNicaraguanNigerianNorthern EuropeanNorwegianOkinawanOsageOttawaPaiutePakistaniPalestinianPanamanianParaguayanPennsylvania GermanPeruvianPimaPolishPortuguesePotawatomiPuebloPuerto RicanPuget Sound SalishRomanianRussianSalvadoranSamoanScandinavianScotch-IrishScottishSeminoleSenegaleseSerbianShoshoneSierra LeoneanSiouxSlavicSlovakSloveneSomaliSouth AfricanSouth AmericanSouth American IndianSoviet UnionSpaniardSpanishSpanish AmericanSpanish American IndianSri LankanSubsaharan AfricanSudaneseSwedishSwissSyrianTaiwaneseThaiTlingit-HaidaTohono O'OdhamTonganTrinidadian and TobagonianTsimshianTurkishU.S. Virgin IslanderUgandanUkrainianUruguayanUteVenezuelanVietnameseWelshWest IndianYakamaYaquiYugoslavianYumanYup'ik
Immigration
NonimmigrantsImmigrantsAfghanistanAfricaAlbaniaArgentinaArmeniaAsiaAustraliaAustriaBahamasBangladeshBarbadosBelarusBelgiumBelizeBoliviaBosnia and HerzegovinaBrazilBulgariaBurma/MyanmarCabo VerdeCambodiaCameroonCanadaCaribbeanCentral AmericaChileChinaColombiaCongoCosta RicaCroatiaCubaCzechoslovakiaDenmarkDominicaDominican RepublicEastern AfricaEastern AsiaEastern EuropeEcuadorEgyptEl SalvadorEnglandEritreaEthiopiaEuropeFijiFranceGermanyGhanaGreeceGrenadaGuatemalaGuyanaHaitiHondurasHong KongHungaryIndiaIndonesiaIranIraqIrelandIsraelItalyJamaicaJapanJordanKazakhstanKenyaKoreaKuwaitLaosLatin AmericaLatviaLebanonLiberiaLithuaniaMalaysiaMexicoMicronesiaMiddle AfricaMoldovaMoroccoNepalNetherlandsNicaraguaNigeriaNorth AmericaNorth MacedoniaNorthern AfricaNorthern EuropeNorwayOceaniaPakistanPanamaPeruPhilippinesPolandPortugalRomaniaRussiaSaudi ArabiaScotlandSenegalSerbiaSierra LeoneSingaporeSomaliaSouth AfricaSouth AmericaSouth Central AsiaSouth Eastern AsiaSouthern EuropeSpainSri LankaSt. Vincent and the GrenadinesSudanSwedenSwitzerlandSyriaTaiwanThailandTrinidad and TobagoTurkeyUgandaUkraineUruguayUzbekistanVenezuelaVietnamWest IndiesWestern AfricaWestern AsiaWestern EuropeYemenZaireZimbabweAzores
Disability Age 5 to 17
Income
Poverty
Unemployment
Labor Participation
Family Structure
Vehicle Availability
Education Level
Disability

Zimbabwean Disability Age 5 to 17
Good

5.5%
DISABILITY | AGE 5 TO 17
67.2/ 100
METRIC RATING
162nd/ 347
METRIC RANK

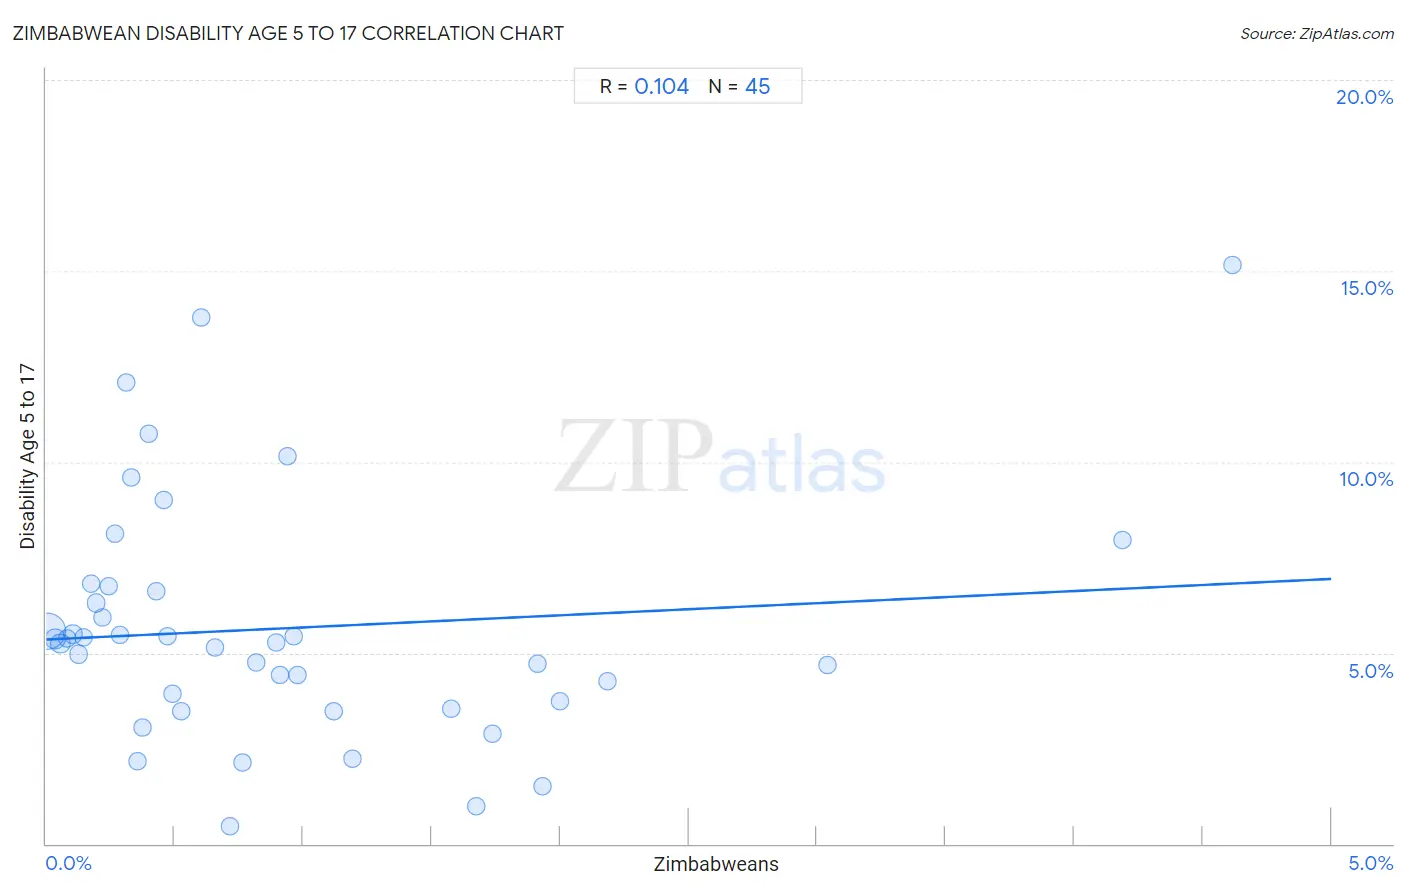
Zimbabwean Disability Age 5 to 17 Correlation Chart

The statistical analysis conducted on geographies consisting of 69,117,127 people shows a poor positive correlation between the proportion of Zimbabweans and percentage of population with a disability between the ages 5 and 17 in the United States with a correlation coefficient (R) of 0.104 and weighted average of 5.5%. On average, for every 1% (one percent) increase in Zimbabweans within a typical geography, there is an increase of 0.32% in percentage of population with a disability between the ages 5 and 17.
Zimbabwean Disability Age 5 to 17
It is essential to understand that the correlation between the percentage of Zimbabweans and percentage of population with a disability between the ages 5 and 17 does not imply a direct cause-and-effect relationship. It remains uncertain whether the presence of Zimbabweans influences an upward or downward trend in the level of percentage of population with a disability between the ages 5 and 17 within an area, or if Zimbabweans simply ended up residing in those areas with higher or lower levels of percentage of population with a disability between the ages 5 and 17 due to other factors.

Demographics Similar to Zimbabweans by Disability Age 5 to 17

In terms of disability age 5 to 17, the demographic groups most similar to Zimbabweans are Immigrants from Saudi Arabia (5.5%, a difference of 0.11%), Immigrants from Southern Europe (5.6%, a difference of 0.18%), Immigrants from Scotland (5.6%, a difference of 0.29%), Lebanese (5.6%, a difference of 0.31%), and Greek (5.6%, a difference of 0.36%).
DemographicsRating | RankDisability Age 5 to 17
Immigrants from Ecuador
78.3
/100
|
#155
Good
5.5%
Hawaiians
78.0
/100
|
#156
Good
5.5%
Immigrants from Costa Rica
77.9
/100
|
#157
Good
5.5%
Immigrants from Nepal
77.1
/100
|
#158
Good
5.5%
Immigrants from Zimbabwe
75.3
/100
|
#159
Good
5.5%
South Africans
73.3
/100
|
#160
Good
5.5%
Immigrants from Saudi Arabia
69.1
/100
|
#161
Good
5.5%
Zimbabweans
67.2
/100
|
#162
Good
5.5%
Immigrants from Southern Europe
64.0
/100
|
#163
Good
5.6%
Immigrants from Scotland
61.9
/100
|
#164
Good
5.6%
Lebanese
61.4
/100
|
#165
Good
5.6%
Greeks
60.6
/100
|
#166
Good
5.6%
Immigrants from Burma/Myanmar
59.3
/100
|
#167
Average
5.6%
Iraqis
56.0
/100
|
#168
Average
5.6%
Immigrants from Norway
55.7
/100
|
#169
Average
5.6%

Zimbabwean Disability Age 5 to 17 Correlation Summary

MeasurementZimbabwean DataDisability Age 5 to 17 Data
Minimum0.0070%0.47%
Maximum4.6%15.2%
Range4.6%14.7%
Mean0.92%5.6%
Median0.53%5.3%
Interquartile 25% (IQ1)0.26%3.6%
Interquartile 75% (IQ3)1.2%6.7%
Interquartile Range (IQR)0.90%3.1%
Standard Deviation (Sample)1.0%3.1%
Standard Deviation (Population)1.0%3.1%

Correlation Details

Zimbabwean PercentileSample SizeDisability Age 5 to 17
[
0.0%
-
0.5%
]
0.0070%
51,358,0985.6%
[
0.0%
-
0.5%
]
0.033%
5,822,3325.4%
[
0.0%
-
0.5%
]
0.055%
4,711,2325.2%
[
0.0%
-
0.5%
]
0.080%
1,644,9195.4%
[
0.0%
-
0.5%
]
0.10%
1,231,6505.5%
[
0.0%
-
0.5%
]
0.13%
800,6975.0%
[
0.0%
-
0.5%
]
0.15%
727,1155.4%
[
0.0%
-
0.5%
]
0.17%
464,1676.8%
[
0.0%
-
0.5%
]
0.19%
540,2916.3%
[
0.0%
-
0.5%
]
0.22%
314,4605.9%
[
0.0%
-
0.5%
]
0.24%
301,8676.7%
[
0.0%
-
0.5%
]
0.27%
189,3138.1%
[
0.0%
-
0.5%
]
0.29%
211,6945.5%
[
0.0%
-
0.5%
]
0.31%
73,52512.1%
[
0.0%
-
0.5%
]
0.33%
40,5269.6%
[
0.0%
-
0.5%
]
0.35%
5,6592.2%
[
0.0%
-
0.5%
]
0.38%
49,5113.0%
[
0.0%
-
0.5%
]
0.40%
28,45810.7%
[
0.0%
-
0.5%
]
0.43%
30,3966.6%
[
0.0%
-
0.5%
]
0.46%
24,6469.0%
[
0.0%
-
0.5%
]
0.47%
145,0125.4%
[
0.0%
-
0.5%
]
0.49%
31,7943.9%
[
0.5%
-
1.0%
]
0.53%
4,7483.5%
[
0.5%
-
1.0%
]
0.60%
15,20713.8%
[
0.5%
-
1.0%
]
0.65%
43,7065.1%
[
0.5%
-
1.0%
]
0.72%
10,2090.47%
[
0.5%
-
1.0%
]
0.76%
2,0952.1%
[
0.5%
-
1.0%
]
0.82%
23,8054.7%
[
0.5%
-
1.0%
]
0.90%
36,0895.3%
[
0.5%
-
1.0%
]
0.91%
27,8294.4%
[
0.5%
-
1.0%
]
0.94%
7,88810.1%
[
0.5%
-
1.0%
]
0.96%
29,5455.4%
[
0.5%
-
1.0%
]
0.98%
17,9144.4%
[
1.0%
-
1.5%
]
1.12%
36,7493.5%
[
1.0%
-
1.5%
]
1.19%
15,9342.2%
[
1.5%
-
2.0%
]
1.58%
12,0453.5%
[
1.5%
-
2.0%
]
1.67%
9570.98%
[
1.5%
-
2.0%
]
1.74%
8,2422.9%
[
1.5%
-
2.0%
]
1.91%
19,8424.7%
[
1.5%
-
2.0%
]
1.93%
15,2441.5%
[
2.0%
-
2.5%
]
2.00%
13,2473.7%
[
2.0%
-
2.5%
]
2.18%
17,2614.3%
[
3.0%
-
3.5%
]
3.04%
6,7754.7%
[
4.0%
-
4.5%
]
4.19%
2,9618.0%
[
4.5%
-
5.0%
]
4.62%
1,47315.2%