Immigrants from Somalia Disability Age 5 to 17
COMPARE
Immigrants from Somalia
Select to Compare
Disability Age 5 to 17
Immigrants from Somalia Disability Age 5 to 17
6.0%
DISABILITY | AGE 5 TO 17
0.4/ 100
METRIC RATING
270th/ 347
METRIC RANK
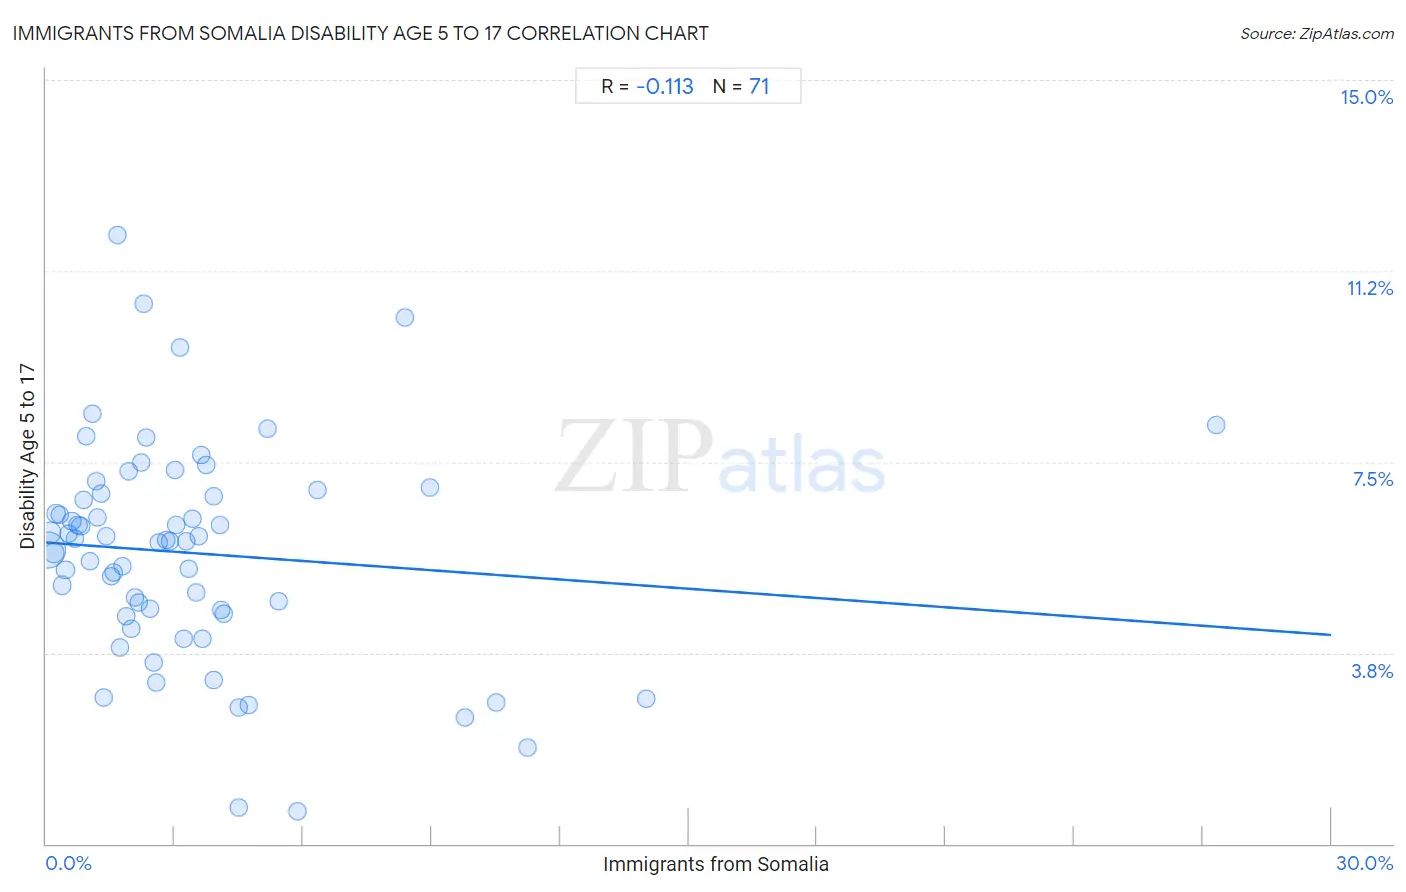
Immigrants from Somalia Disability Age 5 to 17 Correlation Chart
The statistical analysis conducted on geographies consisting of 92,029,922 people shows a poor negative correlation between the proportion of Immigrants from Somalia and percentage of population with a disability between the ages 5 and 17 in the United States with a correlation coefficient (R) of -0.113 and weighted average of 6.0%. On average, for every 1% (one percent) increase in Immigrants from Somalia within a typical geography, there is a decrease of 0.061% in percentage of population with a disability between the ages 5 and 17.
It is essential to understand that the correlation between the percentage of Immigrants from Somalia and percentage of population with a disability between the ages 5 and 17 does not imply a direct cause-and-effect relationship. It remains uncertain whether the presence of Immigrants from Somalia influences an upward or downward trend in the level of percentage of population with a disability between the ages 5 and 17 within an area, or if Immigrants from Somalia simply ended up residing in those areas with higher or lower levels of percentage of population with a disability between the ages 5 and 17 due to other factors.
Demographics Similar to Immigrants from Somalia by Disability Age 5 to 17
In terms of disability age 5 to 17, the demographic groups most similar to Immigrants from Somalia are Liberian (6.0%, a difference of 0.19%), Sioux (6.0%, a difference of 0.22%), Spanish (6.0%, a difference of 0.41%), Slovene (6.0%, a difference of 0.52%), and Panamanian (6.0%, a difference of 0.55%).
| Demographics | Rating | Rank | Disability Age 5 to 17 |
| Czechoslovakians | 0.7 /100 | #263 | Tragic 5.9% |
| Canadians | 0.6 /100 | #264 | Tragic 6.0% |
| Panamanians | 0.6 /100 | #265 | Tragic 6.0% |
| Slovenes | 0.6 /100 | #266 | Tragic 6.0% |
| Spanish | 0.5 /100 | #267 | Tragic 6.0% |
| Sioux | 0.4 /100 | #268 | Tragic 6.0% |
| Liberians | 0.4 /100 | #269 | Tragic 6.0% |
| Immigrants from Somalia | 0.4 /100 | #270 | Tragic 6.0% |
| Immigrants from Zaire | 0.2 /100 | #271 | Tragic 6.0% |
| Finns | 0.2 /100 | #272 | Tragic 6.0% |
| Alaska Natives | 0.2 /100 | #273 | Tragic 6.0% |
| Cheyenne | 0.2 /100 | #274 | Tragic 6.0% |
| Dutch | 0.2 /100 | #275 | Tragic 6.0% |
| Japanese | 0.1 /100 | #276 | Tragic 6.1% |
| Puget Sound Salish | 0.1 /100 | #277 | Tragic 6.1% |
Immigrants from Somalia Disability Age 5 to 17 Correlation Summary
| Measurement | Immigrants from Somalia Data | Disability Age 5 to 17 Data |
| Minimum | 0.018% | 0.64% |
| Maximum | 27.3% | 12.0% |
| Range | 27.3% | 11.3% |
| Mean | 3.4% | 5.7% |
| Median | 2.5% | 6.0% |
| Interquartile 25% (IQ1) | 1.2% | 4.5% |
| Interquartile 75% (IQ3) | 3.9% | 6.9% |
| Interquartile Range (IQR) | 2.7% | 2.4% |
| Standard Deviation (Sample) | 4.0% | 2.1% |
| Standard Deviation (Population) | 3.9% | 2.1% |
Correlation Details
| Immigrants from Somalia Percentile | Sample Size | Disability Age 5 to 17 |
[ 0.0% - 0.5% ] 0.018% | 57,933,864 | 5.8% |
[ 0.0% - 0.5% ] 0.10% | 10,768,448 | 6.1% |
[ 0.0% - 0.5% ] 0.18% | 5,850,707 | 5.7% |
[ 0.0% - 0.5% ] 0.24% | 4,523,480 | 6.5% |
[ 0.0% - 0.5% ] 0.31% | 1,492,284 | 6.5% |
[ 0.0% - 0.5% ] 0.37% | 1,967,646 | 5.1% |
[ 0.0% - 0.5% ] 0.45% | 832,727 | 5.4% |
[ 0.5% - 1.0% ] 0.52% | 606,304 | 6.1% |
[ 0.5% - 1.0% ] 0.60% | 631,800 | 6.3% |
[ 0.5% - 1.0% ] 0.67% | 500,964 | 6.0% |
[ 0.5% - 1.0% ] 0.74% | 639,440 | 6.3% |
[ 0.5% - 1.0% ] 0.80% | 471,196 | 6.2% |
[ 0.5% - 1.0% ] 0.86% | 537,236 | 6.8% |
[ 0.5% - 1.0% ] 0.94% | 233,534 | 8.0% |
[ 1.0% - 1.5% ] 1.03% | 209,423 | 5.6% |
[ 1.0% - 1.5% ] 1.07% | 138,884 | 8.4% |
[ 1.0% - 1.5% ] 1.16% | 119,914 | 7.1% |
[ 1.0% - 1.5% ] 1.21% | 457,370 | 6.4% |
[ 1.0% - 1.5% ] 1.28% | 965,145 | 6.9% |
[ 1.0% - 1.5% ] 1.35% | 51,488 | 2.9% |
[ 1.0% - 1.5% ] 1.41% | 238,741 | 6.0% |
[ 1.5% - 2.0% ] 1.50% | 203,501 | 5.3% |
[ 1.5% - 2.0% ] 1.57% | 242,134 | 5.3% |
[ 1.5% - 2.0% ] 1.65% | 37,120 | 12.0% |
[ 1.5% - 2.0% ] 1.72% | 128,441 | 3.9% |
[ 1.5% - 2.0% ] 1.79% | 207,559 | 5.4% |
[ 1.5% - 2.0% ] 1.86% | 86,966 | 4.5% |
[ 1.5% - 2.0% ] 1.94% | 74,976 | 7.3% |
[ 1.5% - 2.0% ] 1.99% | 95,131 | 4.2% |
[ 2.0% - 2.5% ] 2.06% | 170,632 | 4.8% |
[ 2.0% - 2.5% ] 2.16% | 56,020 | 4.7% |
[ 2.0% - 2.5% ] 2.21% | 25,299 | 7.5% |
[ 2.0% - 2.5% ] 2.27% | 29,001 | 10.6% |
[ 2.0% - 2.5% ] 2.32% | 24,790 | 8.0% |
[ 2.0% - 2.5% ] 2.41% | 85,038 | 4.6% |
[ 2.5% - 3.0% ] 2.51% | 40,813 | 3.6% |
[ 2.5% - 3.0% ] 2.56% | 7,066 | 3.2% |
[ 2.5% - 3.0% ] 2.64% | 45,105 | 5.9% |
[ 2.5% - 3.0% ] 2.79% | 24,685 | 6.0% |
[ 2.5% - 3.0% ] 2.89% | 8,923 | 6.0% |
[ 2.5% - 3.0% ] 3.00% | 36,473 | 7.3% |
[ 3.0% - 3.5% ] 3.04% | 439,052 | 6.3% |
[ 3.0% - 3.5% ] 3.12% | 14,212 | 9.8% |
[ 3.0% - 3.5% ] 3.22% | 21,569 | 4.0% |
[ 3.0% - 3.5% ] 3.28% | 21,006 | 5.9% |
[ 3.0% - 3.5% ] 3.34% | 32,266 | 5.4% |
[ 3.0% - 3.5% ] 3.40% | 23,433 | 6.4% |
[ 3.0% - 3.5% ] 3.49% | 10,662 | 4.9% |
[ 3.5% - 4.0% ] 3.56% | 68,910 | 6.0% |
[ 3.5% - 4.0% ] 3.62% | 49,196 | 7.6% |
[ 3.5% - 4.0% ] 3.65% | 48,985 | 4.0% |
[ 3.5% - 4.0% ] 3.75% | 100,849 | 7.4% |
[ 3.5% - 4.0% ] 3.91% | 30,927 | 6.8% |
[ 3.5% - 4.0% ] 3.92% | 30,787 | 3.2% |
[ 4.0% - 4.5% ] 4.06% | 43,391 | 6.3% |
[ 4.0% - 4.5% ] 4.08% | 81,929 | 4.6% |
[ 4.0% - 4.5% ] 4.13% | 27,523 | 4.5% |
[ 4.0% - 4.5% ] 4.48% | 2,589 | 0.71% |
[ 4.0% - 4.5% ] 4.48% | 4,842 | 2.7% |
[ 4.5% - 5.0% ] 4.73% | 39,177 | 2.7% |
[ 5.0% - 5.5% ] 5.16% | 5,984 | 8.1% |
[ 5.0% - 5.5% ] 5.43% | 40,898 | 4.8% |
[ 5.5% - 6.0% ] 5.87% | 1,005 | 0.64% |
[ 6.0% - 6.5% ] 6.33% | 30,625 | 6.9% |
[ 8.0% - 8.5% ] 8.37% | 3,693 | 10.3% |
[ 8.5% - 9.0% ] 8.96% | 28,172 | 7.0% |
[ 9.5% - 10.0% ] 9.77% | 8,290 | 2.5% |
[ 10.5% - 11.0% ] 10.52% | 7,703 | 2.8% |
[ 11.0% - 11.5% ] 11.24% | 1,930 | 1.9% |
[ 14.0% - 14.5% ] 14.00% | 1,157 | 2.8% |
[ 27.0% - 27.5% ] 27.31% | 8,892 | 8.2% |