Haitian Disability Age 5 to 17
COMPARE
Haitian
Select to Compare
Disability Age 5 to 17
Haitian Disability Age 5 to 17
5.8%
DISABILITY | AGE 5 TO 17
4.8/ 100
METRIC RATING
228th/ 347
METRIC RANK
Haitian Disability Age 5 to 17 Correlation Chart
The statistical analysis conducted on geographies consisting of 286,241,081 people shows a weak negative correlation between the proportion of Haitians and percentage of population with a disability between the ages 5 and 17 in the United States with a correlation coefficient (R) of -0.277 and weighted average of 5.8%. On average, for every 1% (one percent) increase in Haitians within a typical geography, there is a decrease of 0.051% in percentage of population with a disability between the ages 5 and 17.
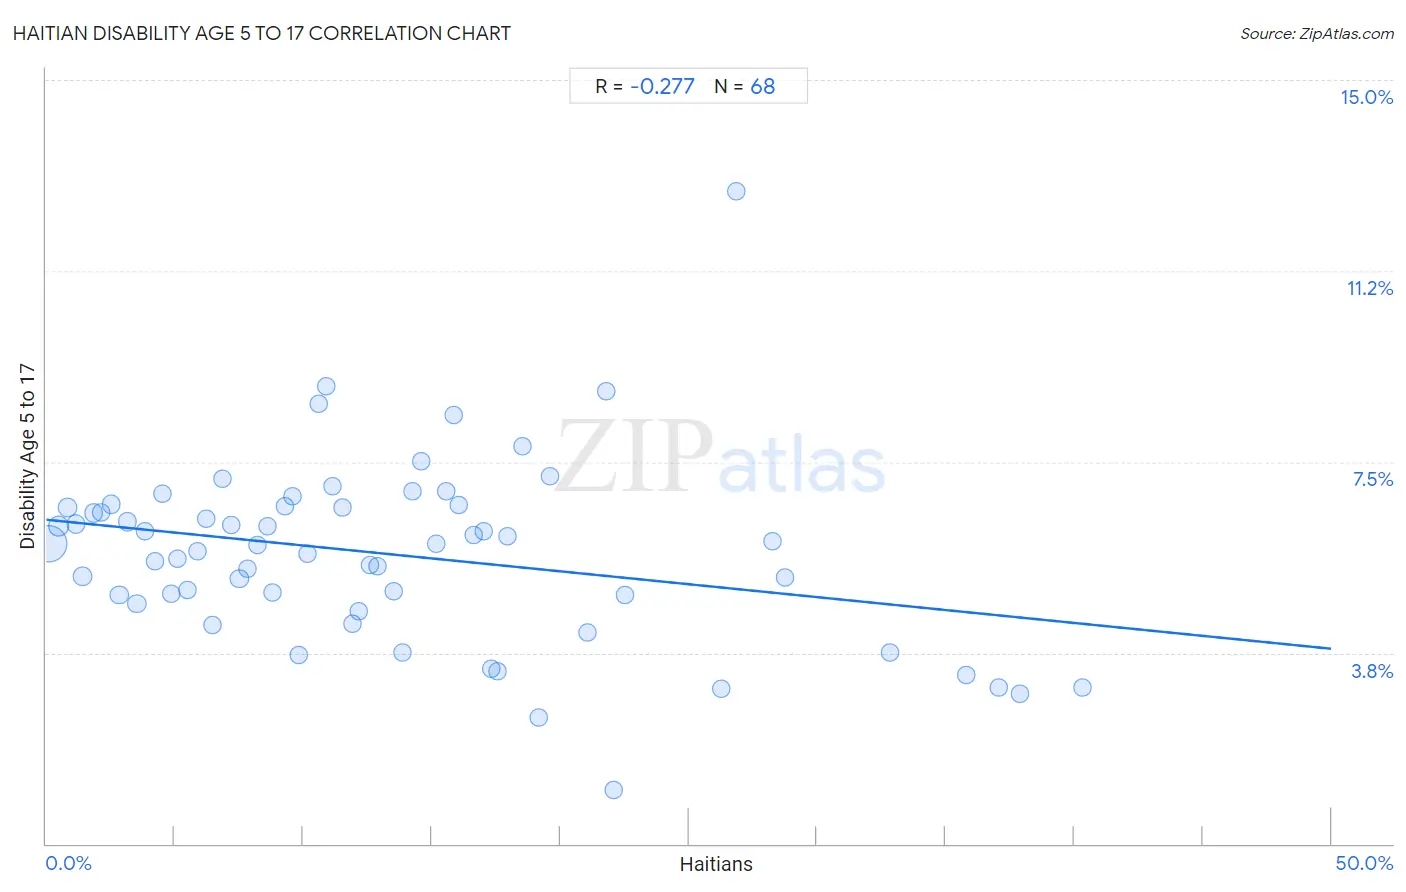
It is essential to understand that the correlation between the percentage of Haitians and percentage of population with a disability between the ages 5 and 17 does not imply a direct cause-and-effect relationship. It remains uncertain whether the presence of Haitians influences an upward or downward trend in the level of percentage of population with a disability between the ages 5 and 17 within an area, or if Haitians simply ended up residing in those areas with higher or lower levels of percentage of population with a disability between the ages 5 and 17 due to other factors.
Demographics Similar to Haitians by Disability Age 5 to 17
In terms of disability age 5 to 17, the demographic groups most similar to Haitians are Bangladeshi (5.8%, a difference of 0.010%), Ghanaian (5.8%, a difference of 0.020%), Swiss (5.8%, a difference of 0.080%), European (5.8%, a difference of 0.090%), and British West Indian (5.8%, a difference of 0.16%).
| Demographics | Rating | Rank | Disability Age 5 to 17 |
| Lithuanians | 6.7 /100 | #221 | Tragic 5.8% |
| Immigrants from Sudan | 6.7 /100 | #222 | Tragic 5.8% |
| Alsatians | 6.0 /100 | #223 | Tragic 5.8% |
| Mexicans | 5.7 /100 | #224 | Tragic 5.8% |
| Guamanians/Chamorros | 5.6 /100 | #225 | Tragic 5.8% |
| British West Indians | 5.4 /100 | #226 | Tragic 5.8% |
| Swiss | 5.1 /100 | #227 | Tragic 5.8% |
| Haitians | 4.8 /100 | #228 | Tragic 5.8% |
| Bangladeshis | 4.8 /100 | #229 | Tragic 5.8% |
| Ghanaians | 4.7 /100 | #230 | Tragic 5.8% |
| Europeans | 4.5 /100 | #231 | Tragic 5.8% |
| Immigrants from Laos | 3.8 /100 | #232 | Tragic 5.8% |
| Immigrants from West Indies | 3.5 /100 | #233 | Tragic 5.8% |
| Immigrants from Kenya | 3.4 /100 | #234 | Tragic 5.8% |
| Malaysians | 3.4 /100 | #235 | Tragic 5.8% |
Haitian Disability Age 5 to 17 Correlation Summary
| Measurement | Haitian Data | Disability Age 5 to 17 Data |
| Minimum | 0.095% | 1.1% |
| Maximum | 40.3% | 12.8% |
| Range | 40.2% | 11.7% |
| Mean | 13.2% | 5.7% |
| Median | 11.3% | 5.9% |
| Interquartile 25% (IQ1) | 5.7% | 4.8% |
| Interquartile 75% (IQ3) | 17.8% | 6.6% |
| Interquartile Range (IQR) | 12.1% | 1.8% |
| Standard Deviation (Sample) | 9.8% | 1.8% |
| Standard Deviation (Population) | 9.7% | 1.8% |
Correlation Details
| Haitian Percentile | Sample Size | Disability Age 5 to 17 |
[ 0.0% - 0.5% ] 0.095% | 202,952,820 | 5.9% |
[ 0.0% - 0.5% ] 0.48% | 29,745,274 | 6.2% |
[ 0.5% - 1.0% ] 0.81% | 12,833,622 | 6.6% |
[ 1.0% - 1.5% ] 1.15% | 6,660,873 | 6.3% |
[ 1.0% - 1.5% ] 1.41% | 12,270,453 | 5.3% |
[ 1.5% - 2.0% ] 1.83% | 3,019,150 | 6.5% |
[ 2.0% - 2.5% ] 2.15% | 2,330,248 | 6.5% |
[ 2.5% - 3.0% ] 2.53% | 1,375,587 | 6.7% |
[ 2.5% - 3.0% ] 2.84% | 1,290,683 | 4.9% |
[ 3.0% - 3.5% ] 3.16% | 2,324,800 | 6.3% |
[ 3.5% - 4.0% ] 3.52% | 899,386 | 4.7% |
[ 3.5% - 4.0% ] 3.82% | 957,370 | 6.1% |
[ 4.0% - 4.5% ] 4.21% | 332,301 | 5.6% |
[ 4.5% - 5.0% ] 4.53% | 762,223 | 6.9% |
[ 4.5% - 5.0% ] 4.85% | 305,891 | 4.9% |
[ 5.0% - 5.5% ] 5.12% | 742,245 | 5.6% |
[ 5.5% - 6.0% ] 5.50% | 414,815 | 5.0% |
[ 5.5% - 6.0% ] 5.88% | 489,327 | 5.7% |
[ 6.0% - 6.5% ] 6.22% | 704,398 | 6.4% |
[ 6.0% - 6.5% ] 6.47% | 160,947 | 4.3% |
[ 6.5% - 7.0% ] 6.84% | 393,998 | 7.2% |
[ 7.0% - 7.5% ] 7.20% | 215,788 | 6.3% |
[ 7.5% - 8.0% ] 7.51% | 450,380 | 5.2% |
[ 7.5% - 8.0% ] 7.85% | 174,274 | 5.4% |
[ 8.0% - 8.5% ] 8.21% | 575,811 | 5.9% |
[ 8.5% - 9.0% ] 8.60% | 207,256 | 6.2% |
[ 8.5% - 9.0% ] 8.81% | 117,278 | 4.9% |
[ 9.0% - 9.5% ] 9.29% | 188,944 | 6.6% |
[ 9.5% - 10.0% ] 9.57% | 70,045 | 6.8% |
[ 9.5% - 10.0% ] 9.81% | 52,166 | 3.7% |
[ 10.0% - 10.5% ] 10.18% | 375,633 | 5.7% |
[ 10.5% - 11.0% ] 10.62% | 34,860 | 8.6% |
[ 10.5% - 11.0% ] 10.88% | 45,801 | 9.0% |
[ 11.0% - 11.5% ] 11.13% | 72,397 | 7.0% |
[ 11.5% - 12.0% ] 11.55% | 32,311 | 6.6% |
[ 11.5% - 12.0% ] 11.93% | 197,741 | 4.3% |
[ 12.0% - 12.5% ] 12.16% | 153,991 | 4.6% |
[ 12.5% - 13.0% ] 12.62% | 98,037 | 5.5% |
[ 12.5% - 13.0% ] 12.90% | 179,860 | 5.5% |
[ 13.5% - 14.0% ] 13.50% | 231,368 | 5.0% |
[ 13.5% - 14.0% ] 13.85% | 180,853 | 3.8% |
[ 14.0% - 14.5% ] 14.26% | 94,219 | 6.9% |
[ 14.5% - 15.0% ] 14.61% | 103,341 | 7.5% |
[ 15.0% - 15.5% ] 15.20% | 139,753 | 5.9% |
[ 15.5% - 16.0% ] 15.58% | 204,145 | 6.9% |
[ 15.5% - 16.0% ] 15.86% | 33,709 | 8.4% |
[ 16.0% - 16.5% ] 16.07% | 26,814 | 6.7% |
[ 16.5% - 17.0% ] 16.65% | 14,585 | 6.1% |
[ 17.0% - 17.5% ] 17.04% | 117,897 | 6.1% |
[ 17.0% - 17.5% ] 17.33% | 62,604 | 3.4% |
[ 17.5% - 18.0% ] 17.57% | 86,232 | 3.4% |
[ 17.5% - 18.0% ] 17.94% | 32,963 | 6.0% |
[ 18.5% - 19.0% ] 18.53% | 62,827 | 7.8% |
[ 19.0% - 19.5% ] 19.19% | 10,946 | 2.5% |
[ 19.5% - 20.0% ] 19.62% | 70,810 | 7.2% |
[ 21.0% - 21.5% ] 21.04% | 62,232 | 4.2% |
[ 21.5% - 22.0% ] 21.79% | 83,221 | 8.9% |
[ 22.0% - 22.5% ] 22.08% | 37,533 | 1.1% |
[ 22.5% - 23.0% ] 22.54% | 43,269 | 4.9% |
[ 26.0% - 26.5% ] 26.25% | 5,882 | 3.0% |
[ 26.5% - 27.0% ] 26.83% | 35,914 | 12.8% |
[ 28.0% - 28.5% ] 28.25% | 31,807 | 6.0% |
[ 28.5% - 29.0% ] 28.76% | 22,823 | 5.2% |
[ 32.5% - 33.0% ] 32.84% | 48,326 | 3.8% |
[ 35.5% - 36.0% ] 35.77% | 17,163 | 3.3% |
[ 37.0% - 37.5% ] 37.04% | 52,824 | 3.1% |
[ 37.5% - 38.0% ] 37.88% | 59,854 | 2.9% |
[ 40.0% - 40.5% ] 40.35% | 58,183 | 3.1% |