Spanish American Indian Disability Age 5 to 17

COMPARE

Spanish American Indian
Race
Ancestry
AfghanAfricanAlaska NativeAlaskan AthabascanAlbanianAleutAlsatianAmericanApacheArabArapahoArgentineanArmenianAssyrian/Chaldean/SyriacAustralianAustrianBahamianBangladeshiBarbadianBasqueBelgianBelizeanBermudanBhutaneseBlackfeetBolivianBrazilianBritishBritish West IndianBulgarianBurmeseCajunCambodianCanadianCape VerdeanCarpatho RusynCelticCentral AmericanCentral American IndianCherokeeCheyenneChickasawChileanChineseChippewaChoctawColombianColvilleComancheCosta RicanCreeCreekCroatianCrowCubanCypriotCzechCzechoslovakianDanishDelawareDominicanDutchDutch West IndianEastern EuropeanEcuadorianEgyptianEnglishEstonianEthiopianEuropeanFijianFilipinoFinnishFrenchFrench American IndianFrench CanadianGermanGerman RussianGhanaianGreekGuamanian/ChamorroGuatemalanGuyaneseHaitianHmongHonduranHopiHoumaHungarianIcelanderIndian (Asian)IndonesianInupiatIranianIraqiIrishIroquoisIsraeliItalianJamaicanJapaneseJordanianKenyanKiowaKoreanLaotianLatvianLebaneseLiberianLithuanianLumbeeLuxembourgerMacedonianMalaysianMalteseMarshalleseMenomineeMexicanMexican American IndianMongolianMoroccanNative HawaiianNavajoNepaleseNew ZealanderNicaraguanNigerianNorthern EuropeanNorwegianOkinawanOsageOttawaPaiutePakistaniPalestinianPanamanianParaguayanPennsylvania GermanPeruvianPimaPolishPortuguesePotawatomiPuebloPuerto RicanPuget Sound SalishRomanianRussianSalvadoranSamoanScandinavianScotch-IrishScottishSeminoleSenegaleseSerbianShoshoneSierra LeoneanSiouxSlavicSlovakSloveneSomaliSouth AfricanSouth AmericanSouth American IndianSoviet UnionSpaniardSpanishSpanish AmericanSpanish American IndianSri LankanSubsaharan AfricanSudaneseSwedishSwissSyrianTaiwaneseThaiTlingit-HaidaTohono O'OdhamTonganTrinidadian and TobagonianTsimshianTurkishU.S. Virgin IslanderUgandanUkrainianUruguayanUteVenezuelanVietnameseWelshWest IndianYakamaYaquiYugoslavianYumanYup'ikZimbabwean
Immigration
NonimmigrantsImmigrantsAfghanistanAfricaAlbaniaArgentinaArmeniaAsiaAustraliaAustriaBahamasBangladeshBarbadosBelarusBelgiumBelizeBoliviaBosnia and HerzegovinaBrazilBulgariaBurma/MyanmarCabo VerdeCambodiaCameroonCanadaCaribbeanCentral AmericaChileChinaColombiaCongoCosta RicaCroatiaCubaCzechoslovakiaDenmarkDominicaDominican RepublicEastern AfricaEastern AsiaEastern EuropeEcuadorEgyptEl SalvadorEnglandEritreaEthiopiaEuropeFijiFranceGermanyGhanaGreeceGrenadaGuatemalaGuyanaHaitiHondurasHong KongHungaryIndiaIndonesiaIranIraqIrelandIsraelItalyJamaicaJapanJordanKazakhstanKenyaKoreaKuwaitLaosLatin AmericaLatviaLebanonLiberiaLithuaniaMalaysiaMexicoMicronesiaMiddle AfricaMoldovaMoroccoNepalNetherlandsNicaraguaNigeriaNorth AmericaNorth MacedoniaNorthern AfricaNorthern EuropeNorwayOceaniaPakistanPanamaPeruPhilippinesPolandPortugalRomaniaRussiaSaudi ArabiaScotlandSenegalSerbiaSierra LeoneSingaporeSomaliaSouth AfricaSouth AmericaSouth Central AsiaSouth Eastern AsiaSouthern EuropeSpainSri LankaSt. Vincent and the GrenadinesSudanSwedenSwitzerlandSyriaTaiwanThailandTrinidad and TobagoTurkeyUgandaUkraineUruguayUzbekistanVenezuelaVietnamWest IndiesWestern AfricaWestern AsiaWestern EuropeYemenZaireZimbabweAzores
Select to Compare
Race
Ancestry
AfghanAfricanAlaska NativeAlaskan AthabascanAlbanianAleutAlsatianAmericanApacheArabArapahoArgentineanArmenianAssyrian/Chaldean/SyriacAustralianAustrianBahamianBangladeshiBarbadianBasqueBelgianBelizeanBermudanBhutaneseBlackfeetBolivianBrazilianBritishBritish West IndianBulgarianBurmeseCajunCambodianCanadianCape VerdeanCarpatho RusynCelticCentral AmericanCentral American IndianCherokeeCheyenneChickasawChileanChineseChippewaChoctawColombianColvilleComancheCosta RicanCreeCreekCroatianCrowCubanCypriotCzechCzechoslovakianDanishDelawareDominicanDutchDutch West IndianEastern EuropeanEcuadorianEgyptianEnglishEstonianEthiopianEuropeanFijianFilipinoFinnishFrenchFrench American IndianFrench CanadianGermanGerman RussianGhanaianGreekGuamanian/ChamorroGuatemalanGuyaneseHaitianHmongHonduranHopiHoumaHungarianIcelanderIndian (Asian)IndonesianInupiatIranianIraqiIrishIroquoisIsraeliItalianJamaicanJapaneseJordanianKenyanKiowaKoreanLaotianLatvianLebaneseLiberianLithuanianLumbeeLuxembourgerMacedonianMalaysianMalteseMarshalleseMenomineeMexicanMexican American IndianMongolianMoroccanNative HawaiianNavajoNepaleseNew ZealanderNicaraguanNigerianNorthern EuropeanNorwegianOkinawanOsageOttawaPaiutePakistaniPalestinianPanamanianParaguayanPennsylvania GermanPeruvianPimaPolishPortuguesePotawatomiPuebloPuerto RicanPuget Sound SalishRomanianRussianSalvadoranSamoanScandinavianScotch-IrishScottishSeminoleSenegaleseSerbianShoshoneSierra LeoneanSiouxSlavicSlovakSloveneSomaliSouth AfricanSouth AmericanSouth American IndianSoviet UnionSpaniardSpanishSpanish AmericanSri LankanSubsaharan AfricanSudaneseSwedishSwissSyrianTaiwaneseThaiTlingit-HaidaTohono O'OdhamTonganTrinidadian and TobagonianTsimshianTurkishU.S. Virgin IslanderUgandanUkrainianUruguayanUteVenezuelanVietnameseWelshWest IndianYakamaYaquiYugoslavianYumanYup'ikZimbabwean
Immigration
NonimmigrantsImmigrantsAfghanistanAfricaAlbaniaArgentinaArmeniaAsiaAustraliaAustriaBahamasBangladeshBarbadosBelarusBelgiumBelizeBoliviaBosnia and HerzegovinaBrazilBulgariaBurma/MyanmarCabo VerdeCambodiaCameroonCanadaCaribbeanCentral AmericaChileChinaColombiaCongoCosta RicaCroatiaCubaCzechoslovakiaDenmarkDominicaDominican RepublicEastern AfricaEastern AsiaEastern EuropeEcuadorEgyptEl SalvadorEnglandEritreaEthiopiaEuropeFijiFranceGermanyGhanaGreeceGrenadaGuatemalaGuyanaHaitiHondurasHong KongHungaryIndiaIndonesiaIranIraqIrelandIsraelItalyJamaicaJapanJordanKazakhstanKenyaKoreaKuwaitLaosLatin AmericaLatviaLebanonLiberiaLithuaniaMalaysiaMexicoMicronesiaMiddle AfricaMoldovaMoroccoNepalNetherlandsNicaraguaNigeriaNorth AmericaNorth MacedoniaNorthern AfricaNorthern EuropeNorwayOceaniaPakistanPanamaPeruPhilippinesPolandPortugalRomaniaRussiaSaudi ArabiaScotlandSenegalSerbiaSierra LeoneSingaporeSomaliaSouth AfricaSouth AmericaSouth Central AsiaSouth Eastern AsiaSouthern EuropeSpainSri LankaSt. Vincent and the GrenadinesSudanSwedenSwitzerlandSyriaTaiwanThailandTrinidad and TobagoTurkeyUgandaUkraineUruguayUzbekistanVenezuelaVietnamWest IndiesWestern AfricaWestern AsiaWestern EuropeYemenZaireZimbabweAzores
Disability Age 5 to 17
Income
Poverty
Unemployment
Labor Participation
Family Structure
Vehicle Availability
Education Level
Disability

Spanish American Indian Disability Age 5 to 17
Poor

5.7%
DISABILITY | AGE 5 TO 17
12.8/ 100
METRIC RATING
203rd/ 347
METRIC RANK

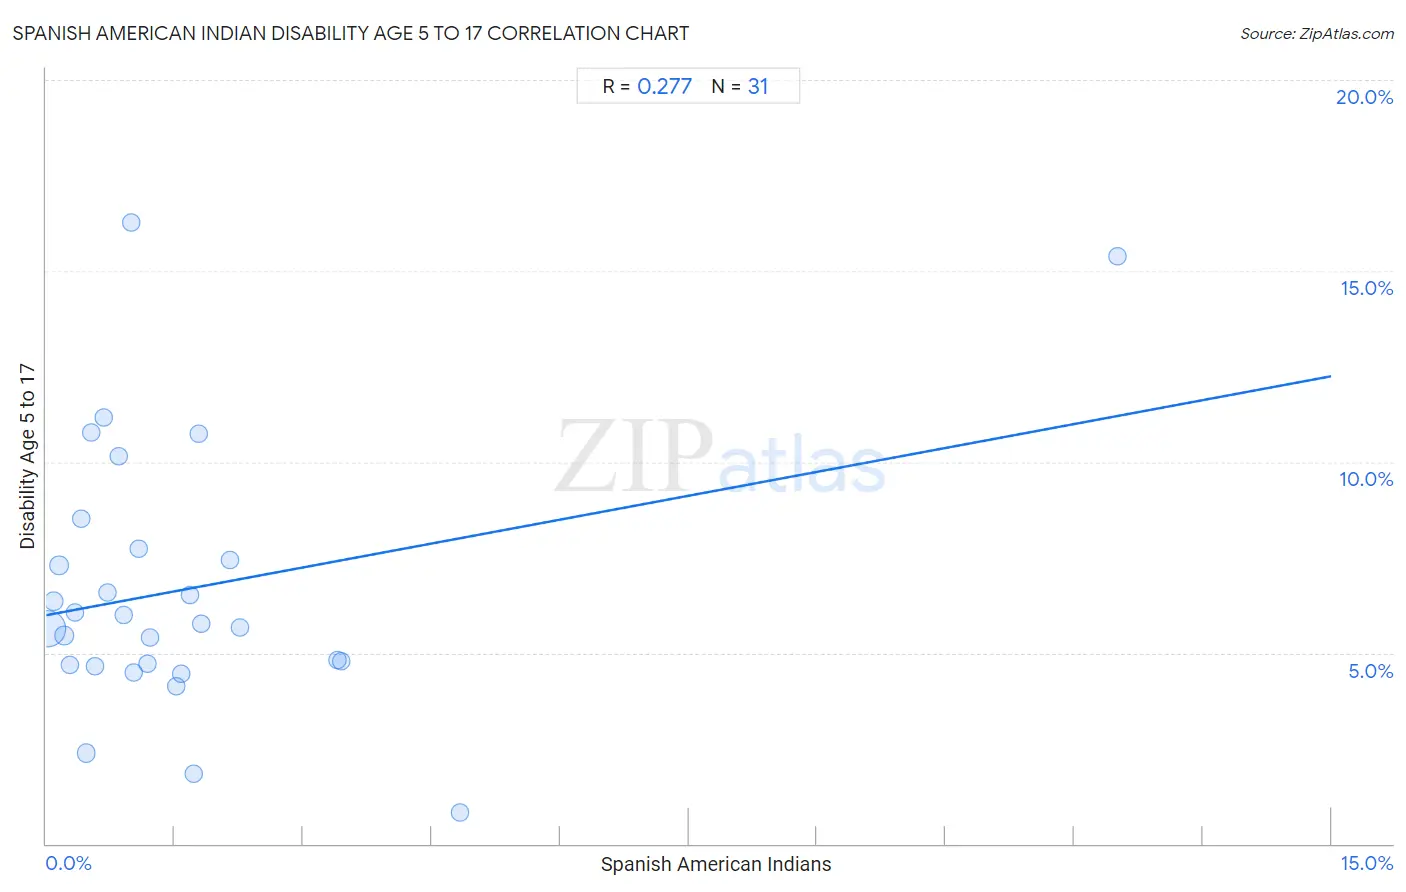
Spanish American Indian Disability Age 5 to 17 Correlation Chart

The statistical analysis conducted on geographies consisting of 73,116,155 people shows a weak positive correlation between the proportion of Spanish American Indians and percentage of population with a disability between the ages 5 and 17 in the United States with a correlation coefficient (R) of 0.277 and weighted average of 5.7%. On average, for every 1% (one percent) increase in Spanish American Indians within a typical geography, there is an increase of 0.42% in percentage of population with a disability between the ages 5 and 17.
Spanish American Indian Disability Age 5 to 17
It is essential to understand that the correlation between the percentage of Spanish American Indians and percentage of population with a disability between the ages 5 and 17 does not imply a direct cause-and-effect relationship. It remains uncertain whether the presence of Spanish American Indians influences an upward or downward trend in the level of percentage of population with a disability between the ages 5 and 17 within an area, or if Spanish American Indians simply ended up residing in those areas with higher or lower levels of percentage of population with a disability between the ages 5 and 17 due to other factors.

Demographics Similar to Spanish American Indians by Disability Age 5 to 17

In terms of disability age 5 to 17, the demographic groups most similar to Spanish American Indians are Austrian (5.7%, a difference of 0.040%), Basque (5.7%, a difference of 0.090%), Icelander (5.7%, a difference of 0.18%), Paiute (5.7%, a difference of 0.18%), and Trinidadian and Tobagonian (5.7%, a difference of 0.23%).
DemographicsRating | RankDisability Age 5 to 17
Inupiat
23.3
/100
|
#196
Fair
5.7%
Immigrants from North America
23.1
/100
|
#197
Fair
5.7%
Norwegians
20.9
/100
|
#198
Fair
5.7%
Northern Europeans
15.2
/100
|
#199
Poor
5.7%
Icelanders
14.6
/100
|
#200
Poor
5.7%
Basques
13.7
/100
|
#201
Poor
5.7%
Austrians
13.2
/100
|
#202
Poor
5.7%
Spanish American Indians
12.8
/100
|
#203
Poor
5.7%
Paiute
11.2
/100
|
#204
Poor
5.7%
Trinidadians and Tobagonians
10.8
/100
|
#205
Poor
5.7%
Immigrants from Africa
10.8
/100
|
#206
Poor
5.7%
Moroccans
10.4
/100
|
#207
Poor
5.7%
Kenyans
10.0
/100
|
#208
Poor
5.8%
Immigrants from Uganda
9.7
/100
|
#209
Tragic
5.8%
Immigrants from Haiti
9.5
/100
|
#210
Tragic
5.8%

Spanish American Indian Disability Age 5 to 17 Correlation Summary

MeasurementSpanish American Indian DataDisability Age 5 to 17 Data
Minimum0.014%0.82%
Maximum12.5%16.3%
Range12.5%15.4%
Mean1.6%6.7%
Median1.0%5.8%
Interquartile 25% (IQ1)0.47%4.7%
Interquartile 75% (IQ3)1.8%7.7%
Interquartile Range (IQR)1.3%3.0%
Standard Deviation (Sample)2.3%3.5%
Standard Deviation (Population)2.3%3.4%

Correlation Details

Spanish American Indian PercentileSample SizeDisability Age 5 to 17
[
0.0%
-
0.5%
]
0.014%
63,761,3305.6%
[
0.0%
-
0.5%
]
0.089%
4,589,4426.4%
[
0.0%
-
0.5%
]
0.15%
1,733,5817.3%
[
0.0%
-
0.5%
]
0.21%
1,089,4035.5%
[
0.0%
-
0.5%
]
0.28%
699,3444.7%
[
0.0%
-
0.5%
]
0.33%
151,3076.0%
[
0.0%
-
0.5%
]
0.41%
105,0358.5%
[
0.0%
-
0.5%
]
0.47%
144,8372.4%
[
0.5%
-
1.0%
]
0.52%
28,89210.8%
[
0.5%
-
1.0%
]
0.57%
40,0244.7%
[
0.5%
-
1.0%
]
0.66%
10,99111.2%
[
0.5%
-
1.0%
]
0.72%
33,7176.6%
[
0.5%
-
1.0%
]
0.84%
49,73110.1%
[
0.5%
-
1.0%
]
0.91%
42,9516.0%
[
0.5%
-
1.0%
]
0.99%
9,26816.3%
[
1.0%
-
1.5%
]
1.02%
21,2504.5%
[
1.0%
-
1.5%
]
1.08%
23,1737.7%
[
1.0%
-
1.5%
]
1.18%
25,5944.7%
[
1.0%
-
1.5%
]
1.22%
2,5465.4%
[
1.5%
-
2.0%
]
1.52%
56,1034.1%
[
1.5%
-
2.0%
]
1.57%
89,0214.5%
[
1.5%
-
2.0%
]
1.68%
7,5546.5%
[
1.5%
-
2.0%
]
1.72%
5,6971.8%
[
1.5%
-
2.0%
]
1.79%
32,86910.7%
[
1.5%
-
2.0%
]
1.81%
108,6825.8%
[
2.0%
-
2.5%
]
2.15%
15,5527.4%
[
2.0%
-
2.5%
]
2.26%
87,0895.6%
[
3.0%
-
3.5%
]
3.40%
72,4954.8%
[
3.0%
-
3.5%
]
3.44%
71,6924.8%
[
4.5%
-
5.0%
]
4.83%
6,8330.82%
[
12.0%
-
12.5%
]
12.50%
15215.4%