Immigrants from Sweden Disability Age 5 to 17

COMPARE

Immigrants from Sweden
Race
Ancestry
AfghanAfricanAlaska NativeAlaskan AthabascanAlbanianAleutAlsatianAmericanApacheArabArapahoArgentineanArmenianAssyrian/Chaldean/SyriacAustralianAustrianBahamianBangladeshiBarbadianBasqueBelgianBelizeanBermudanBhutaneseBlackfeetBolivianBrazilianBritishBritish West IndianBulgarianBurmeseCajunCambodianCanadianCape VerdeanCarpatho RusynCelticCentral AmericanCentral American IndianCherokeeCheyenneChickasawChileanChineseChippewaChoctawColombianColvilleComancheCosta RicanCreeCreekCroatianCrowCubanCypriotCzechCzechoslovakianDanishDelawareDominicanDutchDutch West IndianEastern EuropeanEcuadorianEgyptianEnglishEstonianEthiopianEuropeanFijianFilipinoFinnishFrenchFrench American IndianFrench CanadianGermanGerman RussianGhanaianGreekGuamanian/ChamorroGuatemalanGuyaneseHaitianHmongHonduranHopiHoumaHungarianIcelanderIndian (Asian)IndonesianInupiatIranianIraqiIrishIroquoisIsraeliItalianJamaicanJapaneseJordanianKenyanKiowaKoreanLaotianLatvianLebaneseLiberianLithuanianLumbeeLuxembourgerMacedonianMalaysianMalteseMarshalleseMenomineeMexicanMexican American IndianMongolianMoroccanNative HawaiianNavajoNepaleseNew ZealanderNicaraguanNigerianNorthern EuropeanNorwegianOkinawanOsageOttawaPaiutePakistaniPalestinianPanamanianParaguayanPennsylvania GermanPeruvianPimaPolishPortuguesePotawatomiPuebloPuerto RicanPuget Sound SalishRomanianRussianSalvadoranSamoanScandinavianScotch-IrishScottishSeminoleSenegaleseSerbianShoshoneSierra LeoneanSiouxSlavicSlovakSloveneSomaliSouth AfricanSouth AmericanSouth American IndianSoviet UnionSpaniardSpanishSpanish AmericanSpanish American IndianSri LankanSubsaharan AfricanSudaneseSwedishSwissSyrianTaiwaneseThaiTlingit-HaidaTohono O'OdhamTonganTrinidadian and TobagonianTsimshianTurkishU.S. Virgin IslanderUgandanUkrainianUruguayanUteVenezuelanVietnameseWelshWest IndianYakamaYaquiYugoslavianYumanYup'ikZimbabwean
Immigration
NonimmigrantsImmigrantsAfghanistanAfricaAlbaniaArgentinaArmeniaAsiaAustraliaAustriaBahamasBangladeshBarbadosBelarusBelgiumBelizeBoliviaBosnia and HerzegovinaBrazilBulgariaBurma/MyanmarCabo VerdeCambodiaCameroonCanadaCaribbeanCentral AmericaChileChinaColombiaCongoCosta RicaCroatiaCubaCzechoslovakiaDenmarkDominicaDominican RepublicEastern AfricaEastern AsiaEastern EuropeEcuadorEgyptEl SalvadorEnglandEritreaEthiopiaEuropeFijiFranceGermanyGhanaGreeceGrenadaGuatemalaGuyanaHaitiHondurasHong KongHungaryIndiaIndonesiaIranIraqIrelandIsraelItalyJamaicaJapanJordanKazakhstanKenyaKoreaKuwaitLaosLatin AmericaLatviaLebanonLiberiaLithuaniaMalaysiaMexicoMicronesiaMiddle AfricaMoldovaMoroccoNepalNetherlandsNicaraguaNigeriaNorth AmericaNorth MacedoniaNorthern AfricaNorthern EuropeNorwayOceaniaPakistanPanamaPeruPhilippinesPolandPortugalRomaniaRussiaSaudi ArabiaScotlandSenegalSerbiaSierra LeoneSingaporeSomaliaSouth AfricaSouth AmericaSouth Central AsiaSouth Eastern AsiaSouthern EuropeSpainSri LankaSt. Vincent and the GrenadinesSudanSwedenSwitzerlandSyriaTaiwanThailandTrinidad and TobagoTurkeyUgandaUkraineUruguayUzbekistanVenezuelaVietnamWest IndiesWestern AfricaWestern AsiaWestern EuropeYemenZaireZimbabweAzores
Select to Compare
Race
Ancestry
AfghanAfricanAlaska NativeAlaskan AthabascanAlbanianAleutAlsatianAmericanApacheArabArapahoArgentineanArmenianAssyrian/Chaldean/SyriacAustralianAustrianBahamianBangladeshiBarbadianBasqueBelgianBelizeanBermudanBhutaneseBlackfeetBolivianBrazilianBritishBritish West IndianBulgarianBurmeseCajunCambodianCanadianCape VerdeanCarpatho RusynCelticCentral AmericanCentral American IndianCherokeeCheyenneChickasawChileanChineseChippewaChoctawColombianColvilleComancheCosta RicanCreeCreekCroatianCrowCubanCypriotCzechCzechoslovakianDanishDelawareDominicanDutchDutch West IndianEastern EuropeanEcuadorianEgyptianEnglishEstonianEthiopianEuropeanFijianFilipinoFinnishFrenchFrench American IndianFrench CanadianGermanGerman RussianGhanaianGreekGuamanian/ChamorroGuatemalanGuyaneseHaitianHmongHonduranHopiHoumaHungarianIcelanderIndian (Asian)IndonesianInupiatIranianIraqiIrishIroquoisIsraeliItalianJamaicanJapaneseJordanianKenyanKiowaKoreanLaotianLatvianLebaneseLiberianLithuanianLumbeeLuxembourgerMacedonianMalaysianMalteseMarshalleseMenomineeMexicanMexican American IndianMongolianMoroccanNative HawaiianNavajoNepaleseNew ZealanderNicaraguanNigerianNorthern EuropeanNorwegianOkinawanOsageOttawaPaiutePakistaniPalestinianPanamanianParaguayanPennsylvania GermanPeruvianPimaPolishPortuguesePotawatomiPuebloPuerto RicanPuget Sound SalishRomanianRussianSalvadoranSamoanScandinavianScotch-IrishScottishSeminoleSenegaleseSerbianShoshoneSierra LeoneanSiouxSlavicSlovakSloveneSomaliSouth AfricanSouth AmericanSouth American IndianSoviet UnionSpaniardSpanishSpanish AmericanSpanish American IndianSri LankanSubsaharan AfricanSudaneseSwedishSwissSyrianTaiwaneseThaiTlingit-HaidaTohono O'OdhamTonganTrinidadian and TobagonianTsimshianTurkishU.S. Virgin IslanderUgandanUkrainianUruguayanUteVenezuelanVietnameseWelshWest IndianYakamaYaquiYugoslavianYumanYup'ikZimbabwean
Immigration
NonimmigrantsImmigrantsAfghanistanAfricaAlbaniaArgentinaArmeniaAsiaAustraliaAustriaBahamasBangladeshBarbadosBelarusBelgiumBelizeBoliviaBosnia and HerzegovinaBrazilBulgariaBurma/MyanmarCabo VerdeCambodiaCameroonCanadaCaribbeanCentral AmericaChileChinaColombiaCongoCosta RicaCroatiaCubaCzechoslovakiaDenmarkDominicaDominican RepublicEastern AfricaEastern AsiaEastern EuropeEcuadorEgyptEl SalvadorEnglandEritreaEthiopiaEuropeFijiFranceGermanyGhanaGreeceGrenadaGuatemalaGuyanaHaitiHondurasHong KongHungaryIndiaIndonesiaIranIraqIrelandIsraelItalyJamaicaJapanJordanKazakhstanKenyaKoreaKuwaitLaosLatin AmericaLatviaLebanonLiberiaLithuaniaMalaysiaMexicoMicronesiaMiddle AfricaMoldovaMoroccoNepalNetherlandsNicaraguaNigeriaNorth AmericaNorth MacedoniaNorthern AfricaNorthern EuropeNorwayOceaniaPakistanPanamaPeruPhilippinesPolandPortugalRomaniaRussiaSaudi ArabiaScotlandSenegalSerbiaSierra LeoneSingaporeSomaliaSouth AfricaSouth AmericaSouth Central AsiaSouth Eastern AsiaSouthern EuropeSpainSri LankaSt. Vincent and the GrenadinesSudanSwitzerlandSyriaTaiwanThailandTrinidad and TobagoTurkeyUgandaUkraineUruguayUzbekistanVenezuelaVietnamWest IndiesWestern AfricaWestern AsiaWestern EuropeYemenZaireZimbabweAzores
Disability Age 5 to 17
Income
Poverty
Unemployment
Labor Participation
Family Structure
Vehicle Availability
Education Level
Disability

Immigrants from Sweden Disability Age 5 to 17
Exceptional

5.2%
DISABILITY | AGE 5 TO 17
99.5/ 100
METRIC RATING
82nd/ 347
METRIC RANK

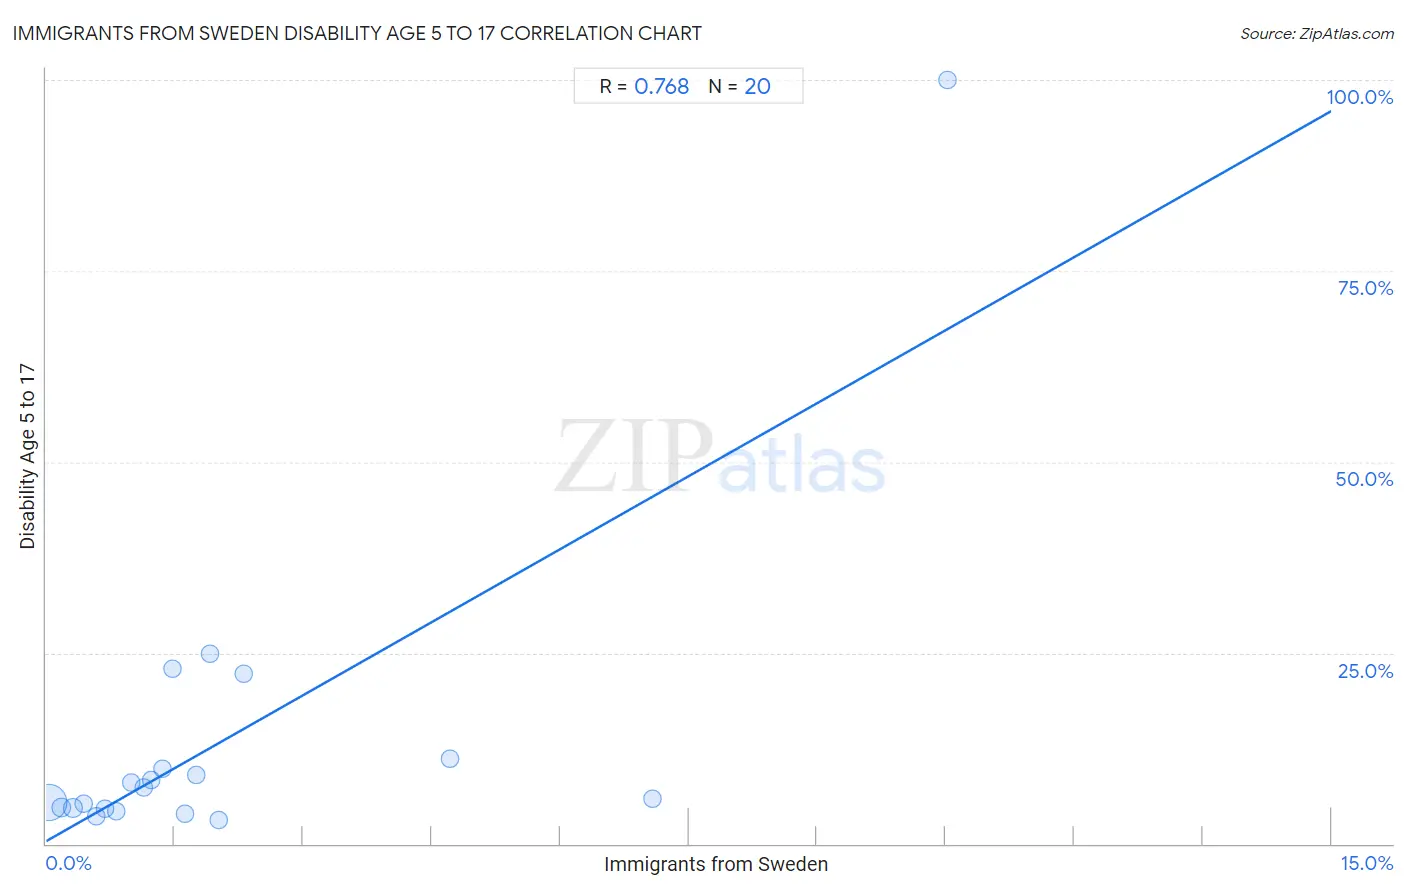
Immigrants from Sweden Disability Age 5 to 17 Correlation Chart

The statistical analysis conducted on geographies consisting of 163,789,898 people shows a strong positive correlation between the proportion of Immigrants from Sweden and percentage of population with a disability between the ages 5 and 17 in the United States with a correlation coefficient (R) of 0.768 and weighted average of 5.2%. On average, for every 1% (one percent) increase in Immigrants from Sweden within a typical geography, there is an increase of 6.4% in percentage of population with a disability between the ages 5 and 17.
Immigrants from Sweden Disability Age 5 to 17
It is essential to understand that the correlation between the percentage of Immigrants from Sweden and percentage of population with a disability between the ages 5 and 17 does not imply a direct cause-and-effect relationship. It remains uncertain whether the presence of Immigrants from Sweden influences an upward or downward trend in the level of percentage of population with a disability between the ages 5 and 17 within an area, or if Immigrants from Sweden simply ended up residing in those areas with higher or lower levels of percentage of population with a disability between the ages 5 and 17 due to other factors.

Demographics Similar to Immigrants from Sweden by Disability Age 5 to 17

In terms of disability age 5 to 17, the demographic groups most similar to Immigrants from Sweden are Immigrants from France (5.2%, a difference of 0.090%), Native Hawaiian (5.2%, a difference of 0.11%), Sri Lankan (5.2%, a difference of 0.15%), Immigrants from Nicaragua (5.2%, a difference of 0.16%), and Afghan (5.2%, a difference of 0.17%).
DemographicsRating | RankDisability Age 5 to 17
Immigrants from Moldova
99.6
/100
|
#75
Exceptional
5.2%
Immigrants from Guyana
99.6
/100
|
#76
Exceptional
5.2%
Immigrants from Kazakhstan
99.6
/100
|
#77
Exceptional
5.2%
Immigrants from Cuba
99.6
/100
|
#78
Exceptional
5.2%
Afghans
99.6
/100
|
#79
Exceptional
5.2%
Sri Lankans
99.6
/100
|
#80
Exceptional
5.2%
Native Hawaiians
99.6
/100
|
#81
Exceptional
5.2%
Immigrants from Sweden
99.5
/100
|
#82
Exceptional
5.2%
Immigrants from France
99.5
/100
|
#83
Exceptional
5.2%
Immigrants from Nicaragua
99.5
/100
|
#84
Exceptional
5.2%
Bulgarians
99.4
/100
|
#85
Exceptional
5.2%
Immigrants from St. Vincent and the Grenadines
99.4
/100
|
#86
Exceptional
5.2%
Eastern Europeans
99.4
/100
|
#87
Exceptional
5.2%
Immigrants from Croatia
99.4
/100
|
#88
Exceptional
5.2%
Immigrants from Spain
99.4
/100
|
#89
Exceptional
5.2%

Immigrants from Sweden Disability Age 5 to 17 Correlation Summary

MeasurementImmigrants from Sweden DataDisability Age 5 to 17 Data
Minimum0.032%3.1%
Maximum10.5%100.0%
Range10.5%96.9%
Mean2.1%13.5%
Median1.3%6.6%
Interquartile 25% (IQ1)0.64%4.7%
Interquartile 75% (IQ3)2.0%10.4%
Interquartile Range (IQR)1.3%5.8%
Standard Deviation (Sample)2.6%21.4%
Standard Deviation (Population)2.5%20.9%

Correlation Details

Immigrants from Sweden PercentileSample SizeDisability Age 5 to 17
[
0.0%
-
0.5%
]
0.032%
150,542,3925.4%
[
0.0%
-
0.5%
]
0.18%
9,321,3104.7%
[
0.0%
-
0.5%
]
0.31%
2,530,1024.7%
[
0.0%
-
0.5%
]
0.43%
760,8345.3%
[
0.5%
-
1.0%
]
0.59%
230,8713.6%
[
0.5%
-
1.0%
]
0.68%
182,8804.6%
[
0.5%
-
1.0%
]
0.82%
71,4284.3%
[
0.5%
-
1.0%
]
0.99%
38,9418.0%
[
1.0%
-
1.5%
]
1.14%
33,1837.4%
[
1.0%
-
1.5%
]
1.23%
27,6168.4%
[
1.0%
-
1.5%
]
1.35%
20,4469.8%
[
1.0%
-
1.5%
]
1.48%
2,71122.9%
[
1.5%
-
2.0%
]
1.62%
8,5764.0%
[
1.5%
-
2.0%
]
1.75%
12,5418.9%
[
1.5%
-
2.0%
]
1.91%
73324.9%
[
2.0%
-
2.5%
]
2.01%
3,6753.1%
[
2.0%
-
2.5%
]
2.31%
17322.2%
[
4.5%
-
5.0%
]
4.71%
1,23111.1%
[
7.0%
-
7.5%
]
7.07%
1985.9%
[
10.5%
-
11.0%
]
10.53%
57100.0%