Immigrants from Asia Disability Age 5 to 17
COMPARE
Immigrants from Asia
Select to Compare
Disability Age 5 to 17
Immigrants from Asia Disability Age 5 to 17
4.8%
DISABILITY | AGE 5 TO 17
100.0/ 100
METRIC RATING
25th/ 347
METRIC RANK
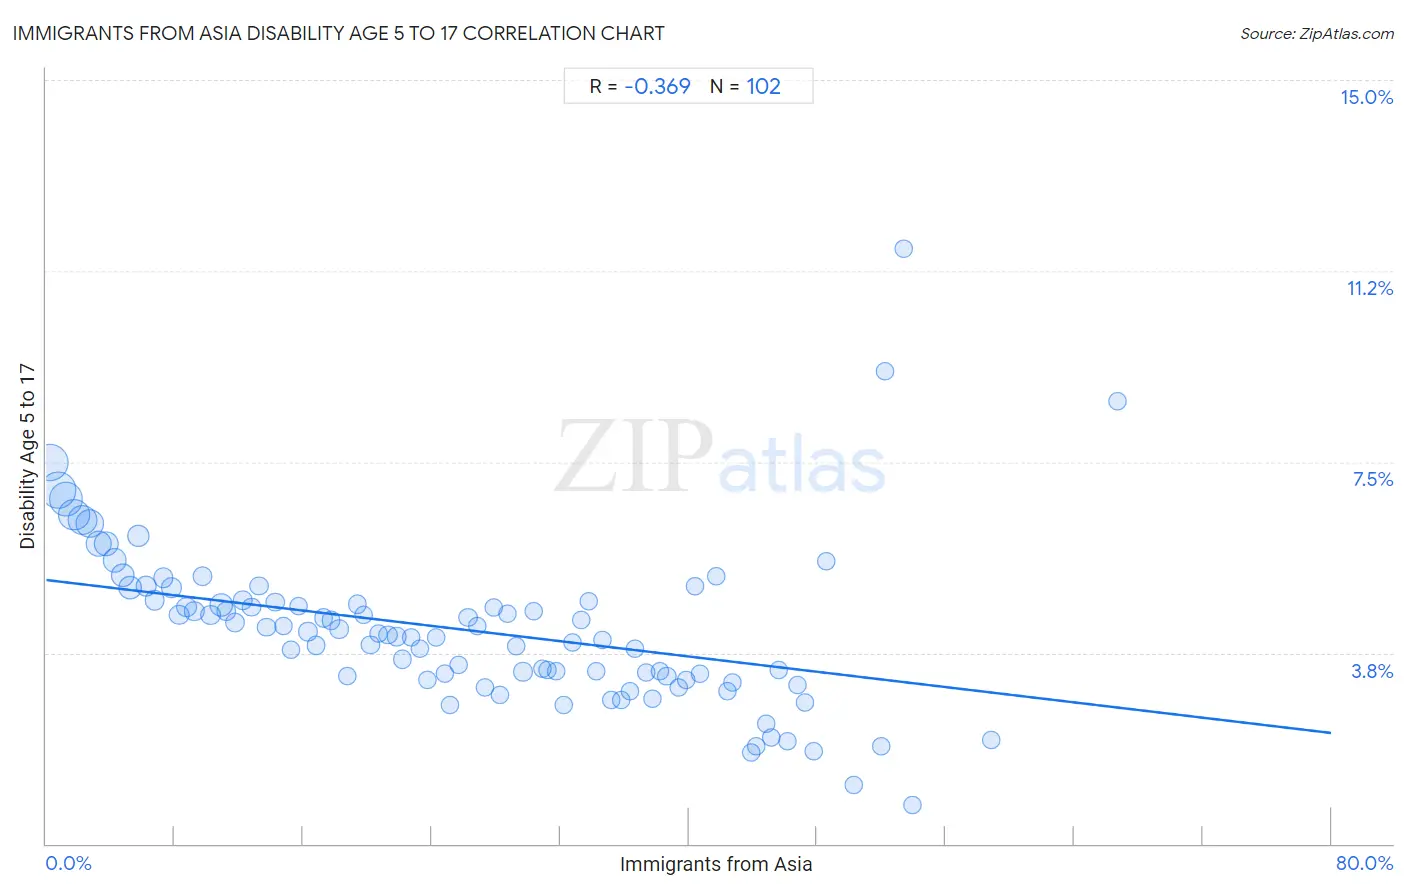
Immigrants from Asia Disability Age 5 to 17 Correlation Chart
The statistical analysis conducted on geographies consisting of 539,214,409 people shows a mild negative correlation between the proportion of Immigrants from Asia and percentage of population with a disability between the ages 5 and 17 in the United States with a correlation coefficient (R) of -0.369 and weighted average of 4.8%. On average, for every 1% (one percent) increase in Immigrants from Asia within a typical geography, there is a decrease of 0.038% in percentage of population with a disability between the ages 5 and 17.
It is essential to understand that the correlation between the percentage of Immigrants from Asia and percentage of population with a disability between the ages 5 and 17 does not imply a direct cause-and-effect relationship. It remains uncertain whether the presence of Immigrants from Asia influences an upward or downward trend in the level of percentage of population with a disability between the ages 5 and 17 within an area, or if Immigrants from Asia simply ended up residing in those areas with higher or lower levels of percentage of population with a disability between the ages 5 and 17 due to other factors.
Demographics Similar to Immigrants from Asia by Disability Age 5 to 17
In terms of disability age 5 to 17, the demographic groups most similar to Immigrants from Asia are Immigrants from Lebanon (4.8%, a difference of 0.11%), Immigrants from Bolivia (4.8%, a difference of 0.26%), Bhutanese (4.9%, a difference of 0.87%), Asian (4.8%, a difference of 0.92%), and Yup'ik (4.8%, a difference of 1.3%).
| Demographics | Rating | Rank | Disability Age 5 to 17 |
| Immigrants from South Central Asia | 100.0 /100 | #18 | Exceptional 4.7% |
| Immigrants from Uzbekistan | 100.0 /100 | #19 | Exceptional 4.8% |
| Burmese | 100.0 /100 | #20 | Exceptional 4.8% |
| Yup'ik | 100.0 /100 | #21 | Exceptional 4.8% |
| Asians | 100.0 /100 | #22 | Exceptional 4.8% |
| Immigrants from Bolivia | 100.0 /100 | #23 | Exceptional 4.8% |
| Immigrants from Lebanon | 100.0 /100 | #24 | Exceptional 4.8% |
| Immigrants from Asia | 100.0 /100 | #25 | Exceptional 4.8% |
| Bhutanese | 100.0 /100 | #26 | Exceptional 4.9% |
| Taiwanese | 100.0 /100 | #27 | Exceptional 4.9% |
| Immigrants from Japan | 100.0 /100 | #28 | Exceptional 4.9% |
| Immigrants from Serbia | 100.0 /100 | #29 | Exceptional 4.9% |
| Immigrants from Malaysia | 100.0 /100 | #30 | Exceptional 5.0% |
| Immigrants from Pakistan | 100.0 /100 | #31 | Exceptional 5.0% |
| Soviet Union | 100.0 /100 | #32 | Exceptional 5.0% |
Immigrants from Asia Disability Age 5 to 17 Correlation Summary
| Measurement | Immigrants from Asia Data | Disability Age 5 to 17 Data |
| Minimum | 0.26% | 0.75% |
| Maximum | 66.7% | 11.7% |
| Range | 66.4% | 10.9% |
| Mean | 26.0% | 4.2% |
| Median | 25.4% | 4.1% |
| Interquartile 25% (IQ1) | 12.8% | 3.3% |
| Interquartile 75% (IQ3) | 38.2% | 4.8% |
| Interquartile Range (IQR) | 25.4% | 1.5% |
| Standard Deviation (Sample) | 15.7% | 1.6% |
| Standard Deviation (Population) | 15.7% | 1.6% |
Correlation Details
| Immigrants from Asia Percentile | Sample Size | Disability Age 5 to 17 |
[ 0.0% - 0.5% ] 0.26% | 63,760,456 | 7.5% |
[ 0.5% - 1.0% ] 0.74% | 62,937,450 | 7.0% |
[ 1.0% - 1.5% ] 1.24% | 52,878,844 | 6.8% |
[ 1.5% - 2.0% ] 1.74% | 44,386,339 | 6.5% |
[ 2.0% - 2.5% ] 2.24% | 38,251,215 | 6.3% |
[ 2.5% - 3.0% ] 2.73% | 35,658,374 | 6.3% |
[ 3.0% - 3.5% ] 3.23% | 25,821,779 | 5.9% |
[ 3.5% - 4.0% ] 3.75% | 20,926,730 | 5.9% |
[ 4.0% - 4.5% ] 4.25% | 18,860,911 | 5.6% |
[ 4.5% - 5.0% ] 4.75% | 15,472,484 | 5.3% |
[ 5.0% - 5.5% ] 5.24% | 16,064,784 | 5.0% |
[ 5.5% - 6.0% ] 5.74% | 15,378,845 | 6.0% |
[ 6.0% - 6.5% ] 6.25% | 9,405,324 | 5.1% |
[ 6.5% - 7.0% ] 6.75% | 6,775,726 | 4.8% |
[ 7.0% - 7.5% ] 7.29% | 6,865,710 | 5.2% |
[ 7.5% - 8.0% ] 7.77% | 7,286,048 | 5.0% |
[ 8.0% - 8.5% ] 8.27% | 5,814,020 | 4.5% |
[ 8.5% - 9.0% ] 8.73% | 6,527,971 | 4.6% |
[ 9.0% - 9.5% ] 9.22% | 4,760,042 | 4.6% |
[ 9.5% - 10.0% ] 9.74% | 4,344,693 | 5.3% |
[ 10.0% - 10.5% ] 10.23% | 4,436,623 | 4.5% |
[ 10.5% - 11.0% ] 10.88% | 16,866,058 | 4.7% |
[ 11.0% - 11.5% ] 11.23% | 4,140,665 | 4.6% |
[ 11.5% - 12.0% ] 11.76% | 4,057,997 | 4.3% |
[ 12.0% - 12.5% ] 12.22% | 2,388,948 | 4.8% |
[ 12.5% - 13.0% ] 12.78% | 2,590,257 | 4.6% |
[ 13.0% - 13.5% ] 13.23% | 2,246,221 | 5.1% |
[ 13.5% - 14.0% ] 13.73% | 1,970,501 | 4.3% |
[ 14.0% - 14.5% ] 14.24% | 2,609,028 | 4.7% |
[ 14.5% - 15.0% ] 14.77% | 1,782,693 | 4.3% |
[ 15.0% - 15.5% ] 15.26% | 1,755,982 | 3.8% |
[ 15.5% - 16.0% ] 15.71% | 1,127,436 | 4.7% |
[ 16.0% - 16.5% ] 16.29% | 1,287,193 | 4.2% |
[ 16.5% - 17.0% ] 16.81% | 1,409,607 | 3.9% |
[ 17.0% - 17.5% ] 17.27% | 1,329,558 | 4.4% |
[ 17.5% - 18.0% ] 17.74% | 1,566,069 | 4.4% |
[ 18.0% - 18.5% ] 18.24% | 1,622,340 | 4.2% |
[ 18.5% - 19.0% ] 18.74% | 1,363,602 | 3.3% |
[ 19.0% - 19.5% ] 19.35% | 929,519 | 4.7% |
[ 19.5% - 20.0% ] 19.73% | 853,137 | 4.5% |
[ 20.0% - 20.5% ] 20.19% | 1,263,807 | 3.9% |
[ 20.5% - 21.0% ] 20.71% | 1,269,256 | 4.1% |
[ 21.0% - 21.5% ] 21.27% | 600,760 | 4.1% |
[ 21.5% - 22.0% ] 21.80% | 1,603,396 | 4.1% |
[ 22.0% - 22.5% ] 22.20% | 557,917 | 3.6% |
[ 22.5% - 23.0% ] 22.74% | 696,426 | 4.0% |
[ 23.0% - 23.5% ] 23.23% | 626,629 | 3.8% |
[ 23.5% - 24.0% ] 23.75% | 684,713 | 3.2% |
[ 24.0% - 24.5% ] 24.26% | 713,357 | 4.1% |
[ 24.5% - 25.0% ] 24.79% | 917,612 | 3.3% |
[ 25.0% - 25.5% ] 25.17% | 149,652 | 2.7% |
[ 25.5% - 26.0% ] 25.70% | 675,061 | 3.5% |
[ 26.0% - 26.5% ] 26.26% | 433,277 | 4.4% |
[ 26.5% - 27.0% ] 26.83% | 1,263,190 | 4.3% |
[ 27.0% - 27.5% ] 27.30% | 476,680 | 3.1% |
[ 27.5% - 28.0% ] 27.84% | 82,684 | 4.6% |
[ 28.0% - 28.5% ] 28.21% | 516,157 | 2.9% |
[ 28.5% - 29.0% ] 28.72% | 260,459 | 4.5% |
[ 29.0% - 29.5% ] 29.28% | 368,007 | 3.9% |
[ 29.5% - 30.0% ] 29.68% | 690,698 | 3.4% |
[ 30.0% - 30.5% ] 30.35% | 281,169 | 4.6% |
[ 30.5% - 31.0% ] 30.88% | 308,289 | 3.4% |
[ 31.0% - 31.5% ] 31.22% | 171,675 | 3.4% |
[ 31.5% - 32.0% ] 31.71% | 488,412 | 3.4% |
[ 32.0% - 32.5% ] 32.24% | 125,570 | 2.7% |
[ 32.5% - 33.0% ] 32.72% | 236,523 | 4.0% |
[ 33.0% - 33.5% ] 33.34% | 224,710 | 4.4% |
[ 33.5% - 34.0% ] 33.77% | 110,209 | 4.8% |
[ 34.0% - 34.5% ] 34.20% | 170,644 | 3.4% |
[ 34.5% - 35.0% ] 34.66% | 356,115 | 4.0% |
[ 35.0% - 35.5% ] 35.17% | 171,322 | 2.8% |
[ 35.5% - 36.0% ] 35.77% | 189,920 | 2.8% |
[ 36.0% - 36.5% ] 36.31% | 286,480 | 3.0% |
[ 36.5% - 37.0% ] 36.62% | 231,065 | 3.8% |
[ 37.0% - 37.5% ] 37.34% | 70,484 | 3.4% |
[ 37.5% - 38.0% ] 37.78% | 99,529 | 2.9% |
[ 38.0% - 38.5% ] 38.20% | 318,040 | 3.4% |
[ 38.5% - 39.0% ] 38.64% | 492,001 | 3.3% |
[ 39.0% - 39.5% ] 39.36% | 225,798 | 3.1% |
[ 39.5% - 40.0% ] 39.87% | 276,472 | 3.2% |
[ 40.0% - 40.5% ] 40.39% | 57,094 | 5.1% |
[ 40.5% - 41.0% ] 40.69% | 107,338 | 3.3% |
[ 41.5% - 42.0% ] 41.74% | 63,360 | 5.3% |
[ 42.0% - 42.5% ] 42.38% | 338,476 | 3.0% |
[ 42.5% - 43.0% ] 42.74% | 173,120 | 3.2% |
[ 43.5% - 44.0% ] 43.89% | 139,016 | 1.8% |
[ 44.0% - 44.5% ] 44.23% | 139,629 | 1.9% |
[ 44.5% - 45.0% ] 44.79% | 127,809 | 2.3% |
[ 45.0% - 45.5% ] 45.10% | 20,693 | 2.1% |
[ 45.5% - 46.0% ] 45.62% | 66,361 | 3.4% |
[ 46.0% - 46.5% ] 46.17% | 40,462 | 2.0% |
[ 46.5% - 47.0% ] 46.76% | 53,256 | 3.1% |
[ 47.0% - 47.5% ] 47.26% | 108,240 | 2.8% |
[ 47.5% - 48.0% ] 47.75% | 321,759 | 1.8% |
[ 48.5% - 49.0% ] 48.54% | 14,371 | 5.5% |
[ 50.0% - 50.5% ] 50.31% | 53,464 | 1.1% |
[ 51.5% - 52.0% ] 51.97% | 26,418 | 1.9% |
[ 52.0% - 52.5% ] 52.22% | 31,383 | 9.3% |
[ 53.0% - 53.5% ] 53.35% | 954 | 11.7% |
[ 53.5% - 54.0% ] 53.91% | 53,371 | 0.75% |
[ 58.5% - 59.0% ] 58.82% | 79,495 | 2.0% |
[ 66.5% - 67.0% ] 66.69% | 2,996 | 8.7% |