Immigrants from Barbados Disability Age 5 to 17
COMPARE
Immigrants from Barbados
Select to Compare
Disability Age 5 to 17
Immigrants from Barbados Disability Age 5 to 17
5.6%
DISABILITY | AGE 5 TO 17
40.5/ 100
METRIC RATING
179th/ 347
METRIC RANK
Immigrants from Barbados Disability Age 5 to 17 Correlation Chart
The statistical analysis conducted on geographies consisting of 112,576,995 people shows a weak positive correlation between the proportion of Immigrants from Barbados and percentage of population with a disability between the ages 5 and 17 in the United States with a correlation coefficient (R) of 0.255 and weighted average of 5.6%. On average, for every 1% (one percent) increase in Immigrants from Barbados within a typical geography, there is an increase of 1.3% in percentage of population with a disability between the ages 5 and 17.
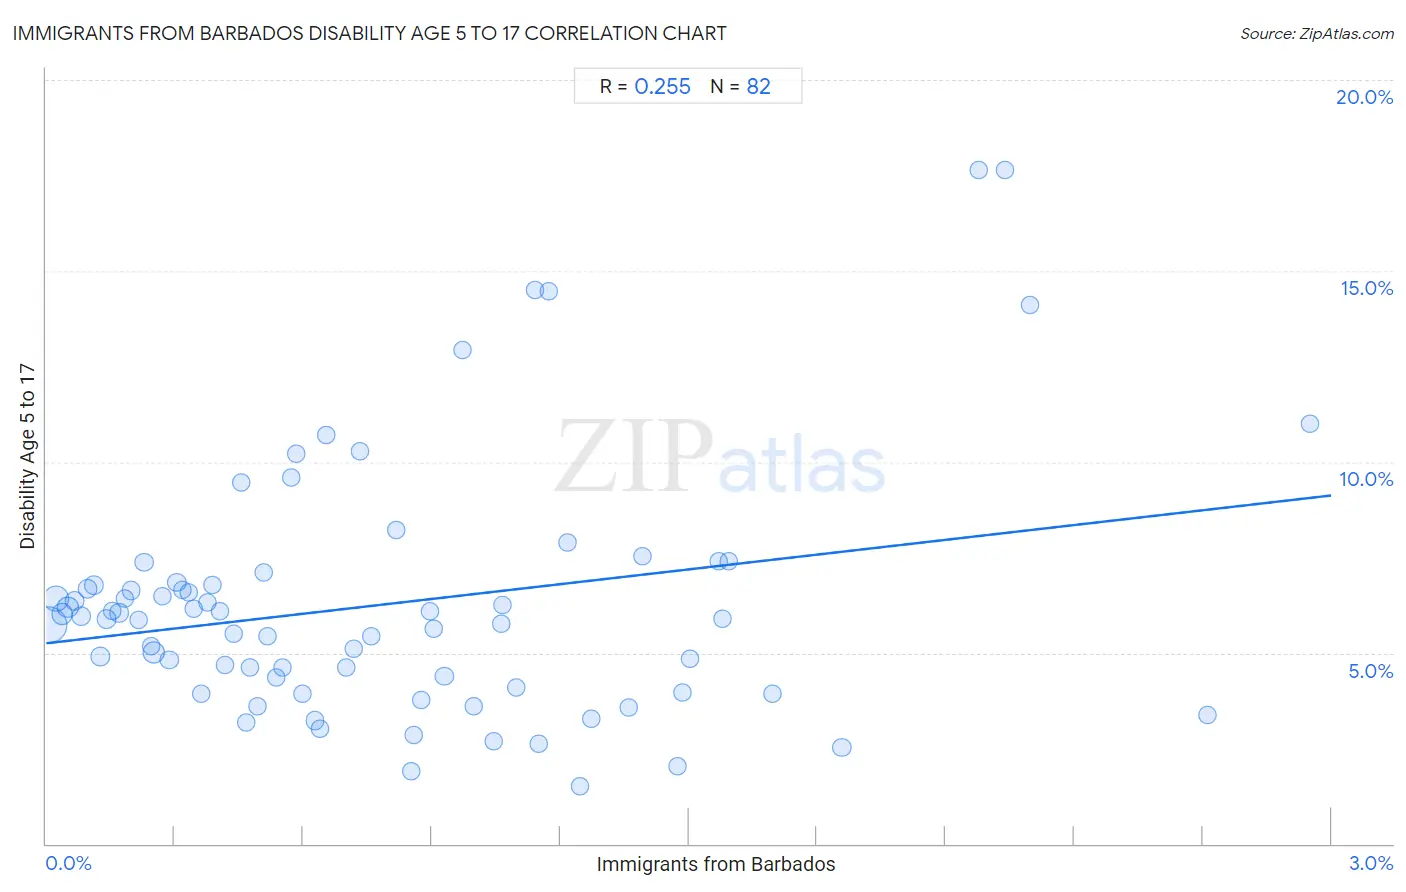
It is essential to understand that the correlation between the percentage of Immigrants from Barbados and percentage of population with a disability between the ages 5 and 17 does not imply a direct cause-and-effect relationship. It remains uncertain whether the presence of Immigrants from Barbados influences an upward or downward trend in the level of percentage of population with a disability between the ages 5 and 17 within an area, or if Immigrants from Barbados simply ended up residing in those areas with higher or lower levels of percentage of population with a disability between the ages 5 and 17 due to other factors.
Demographics Similar to Immigrants from Barbados by Disability Age 5 to 17
In terms of disability age 5 to 17, the demographic groups most similar to Immigrants from Barbados are Immigrants from Uruguay (5.6%, a difference of 0.14%), Immigrants from England (5.6%, a difference of 0.21%), Mexican American Indian (5.6%, a difference of 0.27%), Immigrants from Latin America (5.6%, a difference of 0.32%), and Syrian (5.6%, a difference of 0.35%).
| Demographics | Rating | Rank | Disability Age 5 to 17 |
| Ukrainians | 51.5 /100 | #172 | Average 5.6% |
| Uruguayans | 51.0 /100 | #173 | Average 5.6% |
| Costa Ricans | 50.0 /100 | #174 | Average 5.6% |
| Shoshone | 49.4 /100 | #175 | Average 5.6% |
| Immigrants from Central America | 49.4 /100 | #176 | Average 5.6% |
| Immigrants from Western Europe | 47.8 /100 | #177 | Average 5.6% |
| Immigrants from Trinidad and Tobago | 47.6 /100 | #178 | Average 5.6% |
| Immigrants from Barbados | 40.5 /100 | #179 | Average 5.6% |
| Immigrants from Uruguay | 37.7 /100 | #180 | Fair 5.6% |
| Immigrants from England | 36.4 /100 | #181 | Fair 5.6% |
| Mexican American Indians | 35.2 /100 | #182 | Fair 5.6% |
| Immigrants from Latin America | 34.3 /100 | #183 | Fair 5.6% |
| Syrians | 33.8 /100 | #184 | Fair 5.6% |
| Immigrants from Mexico | 33.7 /100 | #185 | Fair 5.6% |
| Fijians | 31.7 /100 | #186 | Fair 5.7% |
Immigrants from Barbados Disability Age 5 to 17 Correlation Summary
| Measurement | Immigrants from Barbados Data | Disability Age 5 to 17 Data |
| Minimum | 0.0056% | 1.5% |
| Maximum | 3.0% | 17.6% |
| Range | 2.9% | 16.1% |
| Mean | 0.79% | 6.3% |
| Median | 0.61% | 5.9% |
| Interquartile 25% (IQ1) | 0.30% | 4.1% |
| Interquartile 75% (IQ3) | 1.1% | 6.8% |
| Interquartile Range (IQR) | 0.84% | 2.7% |
| Standard Deviation (Sample) | 0.64% | 3.2% |
| Standard Deviation (Population) | 0.64% | 3.2% |
Correlation Details
| Immigrants from Barbados Percentile | Sample Size | Disability Age 5 to 17 |
[ 0.0% - 0.5% ] 0.0056% | 43,535,033 | 5.7% |
[ 0.0% - 0.5% ] 0.022% | 18,078,134 | 6.4% |
[ 0.0% - 0.5% ] 0.037% | 7,684,445 | 6.0% |
[ 0.0% - 0.5% ] 0.050% | 7,108,900 | 6.2% |
[ 0.0% - 0.5% ] 0.066% | 4,657,943 | 6.4% |
[ 0.0% - 0.5% ] 0.082% | 3,369,724 | 6.0% |
[ 0.0% - 0.5% ] 0.096% | 2,799,422 | 6.7% |
[ 0.0% - 0.5% ] 0.11% | 2,125,090 | 6.8% |
[ 0.0% - 0.5% ] 0.13% | 1,487,627 | 4.9% |
[ 0.0% - 0.5% ] 0.14% | 1,343,424 | 5.9% |
[ 0.0% - 0.5% ] 0.15% | 1,326,748 | 6.1% |
[ 0.0% - 0.5% ] 0.17% | 1,167,954 | 6.0% |
[ 0.0% - 0.5% ] 0.18% | 820,447 | 6.4% |
[ 0.0% - 0.5% ] 0.20% | 611,104 | 6.6% |
[ 0.0% - 0.5% ] 0.21% | 572,977 | 5.9% |
[ 0.0% - 0.5% ] 0.23% | 1,154,226 | 7.4% |
[ 0.0% - 0.5% ] 0.25% | 389,382 | 5.2% |
[ 0.0% - 0.5% ] 0.25% | 8,921,722 | 5.0% |
[ 0.0% - 0.5% ] 0.27% | 204,369 | 6.5% |
[ 0.0% - 0.5% ] 0.29% | 401,607 | 4.8% |
[ 0.0% - 0.5% ] 0.30% | 345,884 | 6.8% |
[ 0.0% - 0.5% ] 0.32% | 585,060 | 6.7% |
[ 0.0% - 0.5% ] 0.33% | 189,363 | 6.6% |
[ 0.0% - 0.5% ] 0.35% | 248,369 | 6.1% |
[ 0.0% - 0.5% ] 0.36% | 88,972 | 3.9% |
[ 0.0% - 0.5% ] 0.38% | 150,471 | 6.3% |
[ 0.0% - 0.5% ] 0.39% | 151,915 | 6.8% |
[ 0.0% - 0.5% ] 0.41% | 193,965 | 6.1% |
[ 0.0% - 0.5% ] 0.42% | 116,411 | 4.7% |
[ 0.0% - 0.5% ] 0.44% | 198,768 | 5.5% |
[ 0.0% - 0.5% ] 0.46% | 67,467 | 9.5% |
[ 0.0% - 0.5% ] 0.47% | 71,125 | 3.2% |
[ 0.0% - 0.5% ] 0.48% | 182,309 | 4.6% |
[ 0.0% - 0.5% ] 0.49% | 46,028 | 3.6% |
[ 0.5% - 1.0% ] 0.51% | 137,363 | 7.1% |
[ 0.5% - 1.0% ] 0.52% | 5,035 | 5.4% |
[ 0.5% - 1.0% ] 0.54% | 45,161 | 4.4% |
[ 0.5% - 1.0% ] 0.55% | 4,703 | 4.6% |
[ 0.5% - 1.0% ] 0.57% | 21,329 | 9.6% |
[ 0.5% - 1.0% ] 0.58% | 156,769 | 10.2% |
[ 0.5% - 1.0% ] 0.60% | 70,359 | 3.9% |
[ 0.5% - 1.0% ] 0.63% | 122,569 | 3.2% |
[ 0.5% - 1.0% ] 0.64% | 2,811 | 3.0% |
[ 0.5% - 1.0% ] 0.65% | 2,144 | 10.7% |
[ 0.5% - 1.0% ] 0.70% | 3,719 | 4.6% |
[ 0.5% - 1.0% ] 0.72% | 104,504 | 5.1% |
[ 0.5% - 1.0% ] 0.73% | 97,858 | 10.3% |
[ 0.5% - 1.0% ] 0.76% | 2,373 | 5.4% |
[ 0.5% - 1.0% ] 0.82% | 856 | 8.2% |
[ 0.5% - 1.0% ] 0.85% | 9,389 | 1.9% |
[ 0.5% - 1.0% ] 0.86% | 38,865 | 2.8% |
[ 0.5% - 1.0% ] 0.88% | 101,053 | 3.8% |
[ 0.5% - 1.0% ] 0.89% | 65,177 | 6.1% |
[ 0.5% - 1.0% ] 0.90% | 32,296 | 5.6% |
[ 0.5% - 1.0% ] 0.93% | 91,236 | 4.4% |
[ 0.5% - 1.0% ] 0.97% | 24,994 | 12.9% |
[ 0.5% - 1.0% ] 1.00% | 67,357 | 3.6% |
[ 1.0% - 1.5% ] 1.04% | 95,914 | 2.7% |
[ 1.0% - 1.5% ] 1.06% | 4,240 | 5.8% |
[ 1.0% - 1.5% ] 1.06% | 122,545 | 6.3% |
[ 1.0% - 1.5% ] 1.10% | 26,687 | 4.1% |
[ 1.0% - 1.5% ] 1.14% | 1,138 | 14.5% |
[ 1.0% - 1.5% ] 1.15% | 14,253 | 2.6% |
[ 1.0% - 1.5% ] 1.17% | 1,194 | 14.5% |
[ 1.0% - 1.5% ] 1.22% | 85,891 | 7.9% |
[ 1.0% - 1.5% ] 1.25% | 44,832 | 1.5% |
[ 1.0% - 1.5% ] 1.27% | 24,044 | 3.3% |
[ 1.0% - 1.5% ] 1.36% | 882 | 3.6% |
[ 1.0% - 1.5% ] 1.39% | 46,955 | 7.5% |
[ 1.0% - 1.5% ] 1.47% | 83,125 | 2.0% |
[ 1.0% - 1.5% ] 1.49% | 62,373 | 4.0% |
[ 1.5% - 2.0% ] 1.50% | 9,124 | 4.9% |
[ 1.5% - 2.0% ] 1.57% | 10,631 | 7.4% |
[ 1.5% - 2.0% ] 1.58% | 69,131 | 5.9% |
[ 1.5% - 2.0% ] 1.59% | 10,482 | 7.4% |
[ 1.5% - 2.0% ] 1.69% | 58,476 | 3.9% |
[ 1.5% - 2.0% ] 1.86% | 100,082 | 2.5% |
[ 2.0% - 2.5% ] 2.18% | 5,373 | 17.6% |
[ 2.0% - 2.5% ] 2.24% | 5,226 | 17.6% |
[ 2.0% - 2.5% ] 2.30% | 9,010 | 14.1% |
[ 2.5% - 3.0% ] 2.71% | 78,506 | 3.4% |
[ 2.5% - 3.0% ] 2.95% | 2,576 | 11.0% |