Bhutanese Disability Age 5 to 17
COMPARE
Bhutanese
Select to Compare
Disability Age 5 to 17
Bhutanese Disability Age 5 to 17
4.9%
DISABILITY | AGE 5 TO 17
100.0/ 100
METRIC RATING
26th/ 347
METRIC RANK
Bhutanese Disability Age 5 to 17 Correlation Chart
The statistical analysis conducted on geographies consisting of 450,824,521 people shows no correlation between the proportion of Bhutanese and percentage of population with a disability between the ages 5 and 17 in the United States with a correlation coefficient (R) of 0.048 and weighted average of 4.9%. On average, for every 1% (one percent) increase in Bhutanese within a typical geography, there is an increase of 0.0097% in percentage of population with a disability between the ages 5 and 17.
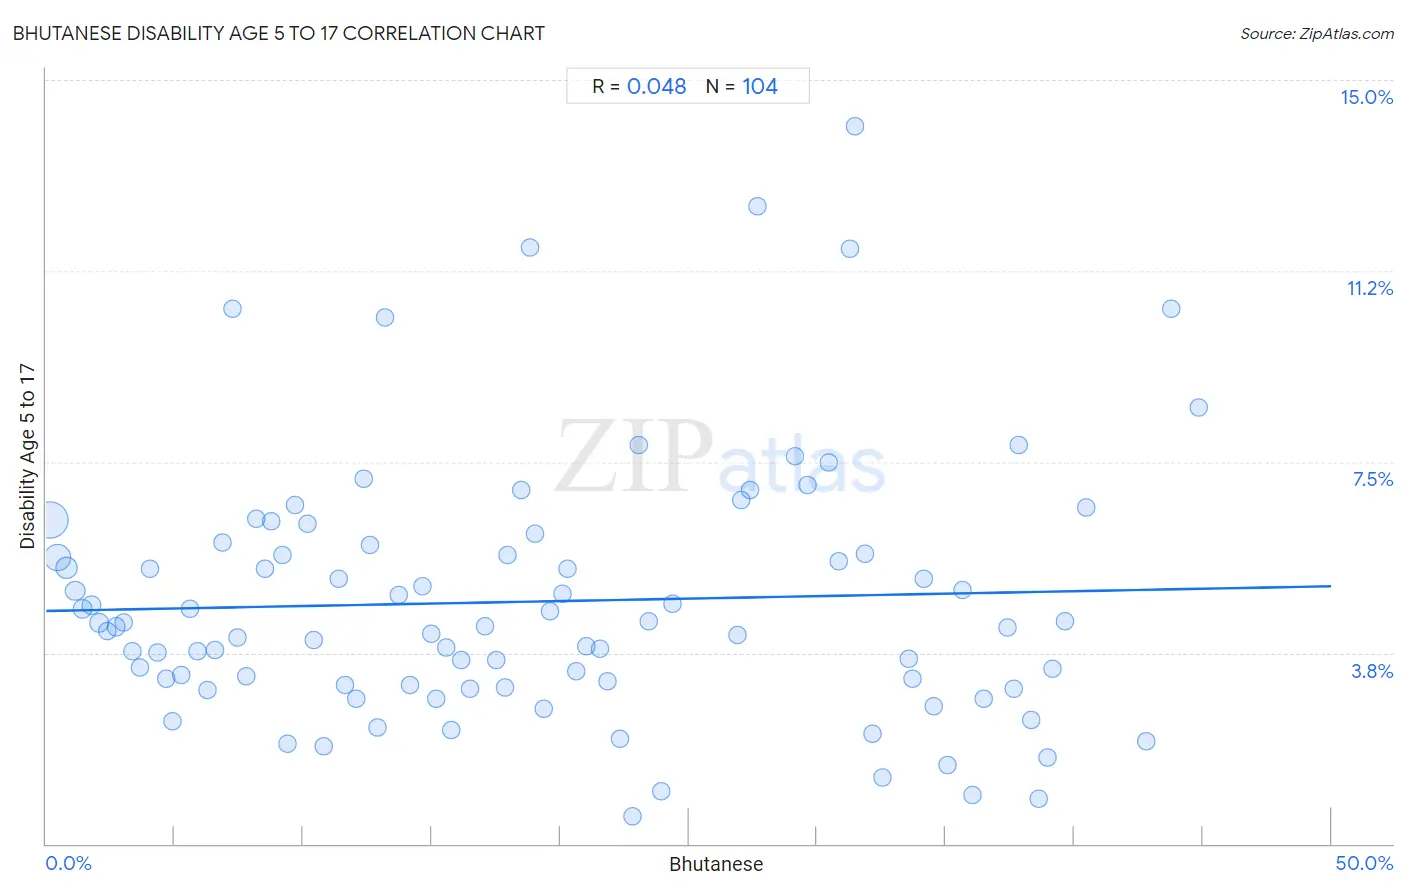
It is essential to understand that the correlation between the percentage of Bhutanese and percentage of population with a disability between the ages 5 and 17 does not imply a direct cause-and-effect relationship. It remains uncertain whether the presence of Bhutanese influences an upward or downward trend in the level of percentage of population with a disability between the ages 5 and 17 within an area, or if Bhutanese simply ended up residing in those areas with higher or lower levels of percentage of population with a disability between the ages 5 and 17 due to other factors.
Demographics Similar to Bhutanese by Disability Age 5 to 17
In terms of disability age 5 to 17, the demographic groups most similar to Bhutanese are Taiwanese (4.9%, a difference of 0.56%), Immigrants from Japan (4.9%, a difference of 0.64%), Immigrants from Asia (4.8%, a difference of 0.87%), Immigrants from Lebanon (4.8%, a difference of 0.98%), and Immigrants from Serbia (4.9%, a difference of 1.1%).
| Demographics | Rating | Rank | Disability Age 5 to 17 |
| Immigrants from Uzbekistan | 100.0 /100 | #19 | Exceptional 4.8% |
| Burmese | 100.0 /100 | #20 | Exceptional 4.8% |
| Yup'ik | 100.0 /100 | #21 | Exceptional 4.8% |
| Asians | 100.0 /100 | #22 | Exceptional 4.8% |
| Immigrants from Bolivia | 100.0 /100 | #23 | Exceptional 4.8% |
| Immigrants from Lebanon | 100.0 /100 | #24 | Exceptional 4.8% |
| Immigrants from Asia | 100.0 /100 | #25 | Exceptional 4.8% |
| Bhutanese | 100.0 /100 | #26 | Exceptional 4.9% |
| Taiwanese | 100.0 /100 | #27 | Exceptional 4.9% |
| Immigrants from Japan | 100.0 /100 | #28 | Exceptional 4.9% |
| Immigrants from Serbia | 100.0 /100 | #29 | Exceptional 4.9% |
| Immigrants from Malaysia | 100.0 /100 | #30 | Exceptional 5.0% |
| Immigrants from Pakistan | 100.0 /100 | #31 | Exceptional 5.0% |
| Soviet Union | 100.0 /100 | #32 | Exceptional 5.0% |
| Immigrants from Indonesia | 100.0 /100 | #33 | Exceptional 5.0% |
Bhutanese Disability Age 5 to 17 Correlation Summary
| Measurement | Bhutanese Data | Disability Age 5 to 17 Data |
| Minimum | 0.15% | 0.55% |
| Maximum | 44.8% | 14.1% |
| Range | 44.7% | 13.6% |
| Mean | 19.1% | 4.8% |
| Median | 17.7% | 4.3% |
| Interquartile 25% (IQ1) | 8.4% | 3.1% |
| Interquartile 75% (IQ3) | 30.7% | 5.8% |
| Interquartile Range (IQR) | 22.3% | 2.7% |
| Standard Deviation (Sample) | 12.5% | 2.5% |
| Standard Deviation (Population) | 12.5% | 2.5% |
Correlation Details
| Bhutanese Percentile | Sample Size | Disability Age 5 to 17 |
[ 0.0% - 0.5% ] 0.15% | 232,657,123 | 6.4% |
[ 0.0% - 0.5% ] 0.45% | 106,664,441 | 5.6% |
[ 0.5% - 1.0% ] 0.79% | 39,448,646 | 5.4% |
[ 1.0% - 1.5% ] 1.11% | 26,192,720 | 5.0% |
[ 1.0% - 1.5% ] 1.42% | 13,232,688 | 4.6% |
[ 1.5% - 2.0% ] 1.75% | 10,746,506 | 4.7% |
[ 2.0% - 2.5% ] 2.06% | 6,083,486 | 4.3% |
[ 2.0% - 2.5% ] 2.36% | 4,593,879 | 4.2% |
[ 2.5% - 3.0% ] 2.73% | 2,584,705 | 4.3% |
[ 3.0% - 3.5% ] 3.03% | 1,473,446 | 4.3% |
[ 3.0% - 3.5% ] 3.35% | 1,215,471 | 3.8% |
[ 3.5% - 4.0% ] 3.64% | 885,057 | 3.5% |
[ 4.0% - 4.5% ] 4.02% | 97,389 | 5.4% |
[ 4.0% - 4.5% ] 4.31% | 595,971 | 3.7% |
[ 4.5% - 5.0% ] 4.68% | 157,495 | 3.2% |
[ 4.5% - 5.0% ] 4.93% | 275,426 | 2.4% |
[ 5.0% - 5.5% ] 5.24% | 134,878 | 3.3% |
[ 5.5% - 6.0% ] 5.59% | 159,149 | 4.6% |
[ 5.5% - 6.0% ] 5.86% | 32,790 | 3.8% |
[ 6.0% - 6.5% ] 6.27% | 79,007 | 3.0% |
[ 6.5% - 7.0% ] 6.54% | 103,875 | 3.8% |
[ 6.5% - 7.0% ] 6.86% | 33,560 | 5.9% |
[ 7.0% - 7.5% ] 7.27% | 54,929 | 10.5% |
[ 7.0% - 7.5% ] 7.42% | 36,128 | 4.0% |
[ 7.5% - 8.0% ] 7.78% | 35,543 | 3.3% |
[ 8.0% - 8.5% ] 8.19% | 35,765 | 6.4% |
[ 8.5% - 9.0% ] 8.51% | 78,189 | 5.4% |
[ 8.5% - 9.0% ] 8.77% | 21,423 | 6.3% |
[ 9.0% - 9.5% ] 9.21% | 148,782 | 5.7% |
[ 9.0% - 9.5% ] 9.40% | 57,833 | 2.0% |
[ 9.5% - 10.0% ] 9.69% | 48,183 | 6.6% |
[ 10.0% - 10.5% ] 10.16% | 33,631 | 6.3% |
[ 10.0% - 10.5% ] 10.41% | 100,286 | 4.0% |
[ 10.5% - 11.0% ] 10.80% | 109,080 | 1.9% |
[ 11.0% - 11.5% ] 11.40% | 51,425 | 5.2% |
[ 11.5% - 12.0% ] 11.64% | 28,295 | 3.1% |
[ 12.0% - 12.5% ] 12.08% | 44,828 | 2.8% |
[ 12.0% - 12.5% ] 12.36% | 67,679 | 7.2% |
[ 12.5% - 13.0% ] 12.62% | 62,709 | 5.9% |
[ 12.5% - 13.0% ] 12.89% | 20,588 | 2.3% |
[ 13.0% - 13.5% ] 13.16% | 7,704 | 10.3% |
[ 13.5% - 14.0% ] 13.72% | 171,635 | 4.9% |
[ 14.0% - 14.5% ] 14.13% | 73,272 | 3.1% |
[ 14.5% - 15.0% ] 14.64% | 16,589 | 5.1% |
[ 14.5% - 15.0% ] 14.98% | 14,139 | 4.1% |
[ 15.0% - 15.5% ] 15.18% | 560 | 2.9% |
[ 15.5% - 16.0% ] 15.55% | 30,266 | 3.9% |
[ 15.5% - 16.0% ] 15.78% | 12,785 | 2.2% |
[ 16.0% - 16.5% ] 16.13% | 70,414 | 3.6% |
[ 16.0% - 16.5% ] 16.47% | 16,263 | 3.0% |
[ 17.0% - 17.5% ] 17.05% | 49,187 | 4.3% |
[ 17.0% - 17.5% ] 17.49% | 142,903 | 3.6% |
[ 17.5% - 18.0% ] 17.86% | 52,772 | 3.1% |
[ 17.5% - 18.0% ] 17.96% | 3,553 | 5.7% |
[ 18.5% - 19.0% ] 18.50% | 10,458 | 7.0% |
[ 18.5% - 19.0% ] 18.82% | 5,256 | 11.7% |
[ 19.0% - 19.5% ] 19.02% | 105,792 | 6.1% |
[ 19.0% - 19.5% ] 19.37% | 27,233 | 2.6% |
[ 19.5% - 20.0% ] 19.62% | 29,453 | 4.6% |
[ 20.0% - 20.5% ] 20.07% | 58,985 | 4.9% |
[ 20.0% - 20.5% ] 20.29% | 10,139 | 5.4% |
[ 20.5% - 21.0% ] 20.64% | 29,516 | 3.4% |
[ 20.5% - 21.0% ] 21.00% | 25,000 | 3.9% |
[ 21.5% - 22.0% ] 21.53% | 17,604 | 3.8% |
[ 21.5% - 22.0% ] 21.84% | 38,065 | 3.2% |
[ 22.0% - 22.5% ] 22.30% | 20,473 | 2.1% |
[ 22.5% - 23.0% ] 22.83% | 10,846 | 0.55% |
[ 23.0% - 23.5% ] 23.08% | 130 | 7.8% |
[ 23.0% - 23.5% ] 23.44% | 61,785 | 4.4% |
[ 23.5% - 24.0% ] 23.94% | 32,036 | 1.0% |
[ 24.0% - 24.5% ] 24.39% | 21,592 | 4.7% |
[ 26.5% - 27.0% ] 26.89% | 348,547 | 4.1% |
[ 27.0% - 27.5% ] 27.06% | 6,246 | 6.7% |
[ 27.0% - 27.5% ] 27.40% | 24,520 | 6.9% |
[ 27.5% - 28.0% ] 27.69% | 2,438 | 12.5% |
[ 29.0% - 29.5% ] 29.12% | 30,068 | 7.6% |
[ 29.5% - 30.0% ] 29.60% | 8,649 | 7.1% |
[ 30.0% - 30.5% ] 30.46% | 2,896 | 7.5% |
[ 30.5% - 31.0% ] 30.85% | 50,453 | 5.6% |
[ 31.0% - 31.5% ] 31.28% | 227 | 11.7% |
[ 31.0% - 31.5% ] 31.45% | 1,313 | 14.1% |
[ 31.5% - 32.0% ] 31.87% | 47,627 | 5.7% |
[ 32.0% - 32.5% ] 32.13% | 22,723 | 2.1% |
[ 32.5% - 33.0% ] 32.52% | 3,887 | 1.3% |
[ 33.5% - 34.0% ] 33.55% | 25,957 | 3.6% |
[ 33.5% - 34.0% ] 33.73% | 2,188 | 3.2% |
[ 34.0% - 34.5% ] 34.12% | 25,771 | 5.2% |
[ 34.5% - 35.0% ] 34.53% | 55,402 | 2.7% |
[ 35.0% - 35.5% ] 35.08% | 13,932 | 1.5% |
[ 35.5% - 36.0% ] 35.67% | 45,038 | 5.0% |
[ 36.0% - 36.5% ] 36.04% | 55,888 | 0.96% |
[ 36.0% - 36.5% ] 36.47% | 34,001 | 2.8% |
[ 37.0% - 37.5% ] 37.43% | 9,571 | 4.2% |
[ 37.5% - 38.0% ] 37.65% | 50,793 | 3.0% |
[ 37.5% - 38.0% ] 37.83% | 3,902 | 7.8% |
[ 38.0% - 38.5% ] 38.32% | 51,598 | 2.4% |
[ 38.5% - 39.0% ] 38.62% | 35,493 | 0.88% |
[ 38.5% - 39.0% ] 38.98% | 49,491 | 1.7% |
[ 39.0% - 39.5% ] 39.14% | 41,560 | 3.4% |
[ 39.5% - 40.0% ] 39.65% | 29,490 | 4.4% |
[ 40.0% - 40.5% ] 40.46% | 54,362 | 6.6% |
[ 42.5% - 43.0% ] 42.78% | 18,802 | 2.0% |
[ 43.5% - 44.0% ] 43.79% | 733 | 10.5% |
[ 44.5% - 45.0% ] 44.83% | 21,546 | 8.6% |