Australian Disability Age 5 to 17
COMPARE
Australian
Select to Compare
Disability Age 5 to 17
Australian Disability Age 5 to 17
5.5%
DISABILITY | AGE 5 TO 17
78.8/ 100
METRIC RATING
154th/ 347
METRIC RANK
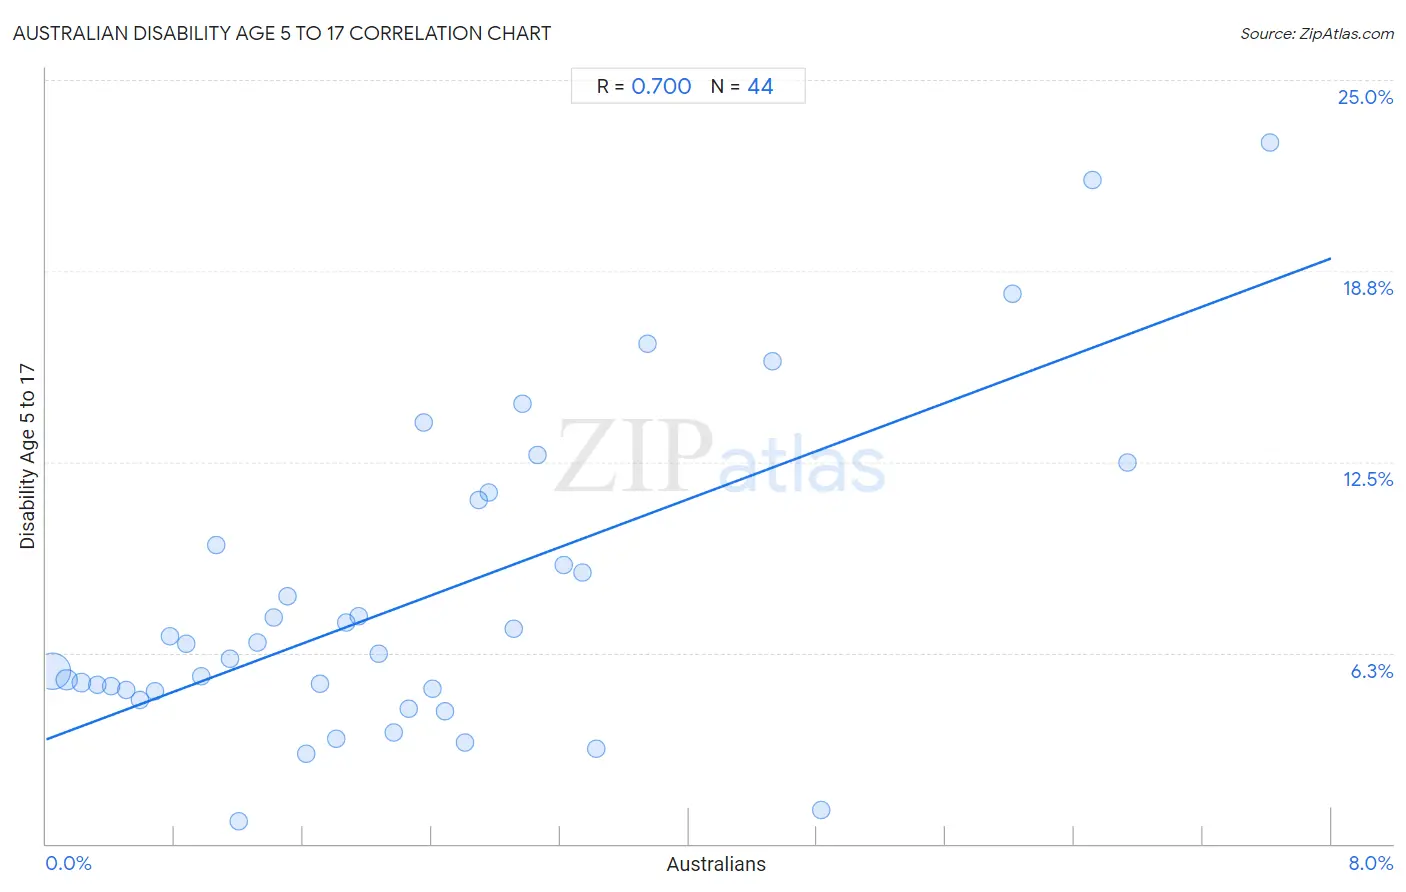
Australian Disability Age 5 to 17 Correlation Chart
The statistical analysis conducted on geographies consisting of 222,865,567 people shows a strong positive correlation between the proportion of Australians and percentage of population with a disability between the ages 5 and 17 in the United States with a correlation coefficient (R) of 0.700 and weighted average of 5.5%. On average, for every 1% (one percent) increase in Australians within a typical geography, there is an increase of 2.0% in percentage of population with a disability between the ages 5 and 17.
It is essential to understand that the correlation between the percentage of Australians and percentage of population with a disability between the ages 5 and 17 does not imply a direct cause-and-effect relationship. It remains uncertain whether the presence of Australians influences an upward or downward trend in the level of percentage of population with a disability between the ages 5 and 17 within an area, or if Australians simply ended up residing in those areas with higher or lower levels of percentage of population with a disability between the ages 5 and 17 due to other factors.
Demographics Similar to Australians by Disability Age 5 to 17
In terms of disability age 5 to 17, the demographic groups most similar to Australians are Immigrants from Ecuador (5.5%, a difference of 0.040%), Hawaiian (5.5%, a difference of 0.060%), Ecuadorian (5.5%, a difference of 0.070%), Immigrants from Costa Rica (5.5%, a difference of 0.070%), and Immigrants from Nepal (5.5%, a difference of 0.12%).
| Demographics | Rating | Rank | Disability Age 5 to 17 |
| Immigrants from Albania | 83.1 /100 | #147 | Excellent 5.5% |
| Samoans | 81.9 /100 | #148 | Excellent 5.5% |
| Central Americans | 81.6 /100 | #149 | Excellent 5.5% |
| Guatemalans | 81.5 /100 | #150 | Excellent 5.5% |
| Estonians | 80.8 /100 | #151 | Excellent 5.5% |
| Ute | 80.6 /100 | #152 | Excellent 5.5% |
| Ecuadorians | 79.7 /100 | #153 | Good 5.5% |
| Australians | 78.8 /100 | #154 | Good 5.5% |
| Immigrants from Ecuador | 78.3 /100 | #155 | Good 5.5% |
| Hawaiians | 78.0 /100 | #156 | Good 5.5% |
| Immigrants from Costa Rica | 77.9 /100 | #157 | Good 5.5% |
| Immigrants from Nepal | 77.1 /100 | #158 | Good 5.5% |
| Immigrants from Zimbabwe | 75.3 /100 | #159 | Good 5.5% |
| South Africans | 73.3 /100 | #160 | Good 5.5% |
| Immigrants from Saudi Arabia | 69.1 /100 | #161 | Good 5.5% |
Australian Disability Age 5 to 17 Correlation Summary
| Measurement | Australian Data | Disability Age 5 to 17 Data |
| Minimum | 0.037% | 0.74% |
| Maximum | 7.6% | 23.0% |
| Range | 7.6% | 22.2% |
| Mean | 2.3% | 8.0% |
| Median | 2.0% | 6.4% |
| Interquartile 25% (IQ1) | 1.0% | 5.0% |
| Interquartile 75% (IQ3) | 3.0% | 10.5% |
| Interquartile Range (IQR) | 2.0% | 5.5% |
| Standard Deviation (Sample) | 1.8% | 5.1% |
| Standard Deviation (Population) | 1.8% | 5.1% |
Correlation Details
| Australian Percentile | Sample Size | Disability Age 5 to 17 |
[ 0.0% - 0.5% ] 0.037% | 176,324,602 | 5.7% |
[ 0.0% - 0.5% ] 0.13% | 27,310,553 | 5.4% |
[ 0.0% - 0.5% ] 0.22% | 9,270,528 | 5.3% |
[ 0.0% - 0.5% ] 0.32% | 3,888,775 | 5.2% |
[ 0.0% - 0.5% ] 0.40% | 2,177,922 | 5.2% |
[ 0.5% - 1.0% ] 0.50% | 1,252,543 | 5.0% |
[ 0.5% - 1.0% ] 0.58% | 811,592 | 4.7% |
[ 0.5% - 1.0% ] 0.68% | 543,701 | 5.0% |
[ 0.5% - 1.0% ] 0.77% | 410,131 | 6.8% |
[ 0.5% - 1.0% ] 0.87% | 275,752 | 6.5% |
[ 0.5% - 1.0% ] 0.96% | 116,164 | 5.5% |
[ 1.0% - 1.5% ] 1.06% | 24,701 | 9.8% |
[ 1.0% - 1.5% ] 1.14% | 48,440 | 6.0% |
[ 1.0% - 1.5% ] 1.20% | 26,479 | 0.74% |
[ 1.0% - 1.5% ] 1.32% | 79,690 | 6.6% |
[ 1.0% - 1.5% ] 1.42% | 24,026 | 7.4% |
[ 1.5% - 2.0% ] 1.51% | 36,859 | 8.1% |
[ 1.5% - 2.0% ] 1.62% | 52,860 | 2.9% |
[ 1.5% - 2.0% ] 1.70% | 21,003 | 5.2% |
[ 1.5% - 2.0% ] 1.81% | 38,038 | 3.4% |
[ 1.5% - 2.0% ] 1.87% | 13,136 | 7.3% |
[ 1.5% - 2.0% ] 1.95% | 35,280 | 7.4% |
[ 2.0% - 2.5% ] 2.07% | 4,985 | 6.2% |
[ 2.0% - 2.5% ] 2.16% | 2,910 | 3.7% |
[ 2.0% - 2.5% ] 2.26% | 4,430 | 4.4% |
[ 2.0% - 2.5% ] 2.35% | 14,128 | 13.8% |
[ 2.0% - 2.5% ] 2.40% | 2,288 | 5.1% |
[ 2.0% - 2.5% ] 2.49% | 10,340 | 4.3% |
[ 2.5% - 3.0% ] 2.61% | 4,867 | 3.3% |
[ 2.5% - 3.0% ] 2.69% | 2,566 | 11.2% |
[ 2.5% - 3.0% ] 2.75% | 1,670 | 11.5% |
[ 2.5% - 3.0% ] 2.91% | 378 | 7.0% |
[ 2.5% - 3.0% ] 2.97% | 1,381 | 14.4% |
[ 3.0% - 3.5% ] 3.06% | 1,538 | 12.7% |
[ 3.0% - 3.5% ] 3.22% | 4,442 | 9.1% |
[ 3.0% - 3.5% ] 3.34% | 8,502 | 8.9% |
[ 3.0% - 3.5% ] 3.42% | 10,047 | 3.1% |
[ 3.5% - 4.0% ] 3.75% | 774 | 16.4% |
[ 4.5% - 5.0% ] 4.52% | 199 | 15.8% |
[ 4.5% - 5.0% ] 4.83% | 3,190 | 1.1% |
[ 6.0% - 6.5% ] 6.02% | 1,396 | 18.0% |
[ 6.5% - 7.0% ] 6.51% | 614 | 21.7% |
[ 6.5% - 7.0% ] 6.73% | 1,307 | 12.5% |
[ 7.5% - 8.0% ] 7.62% | 840 | 23.0% |