Hungarian Disability Age 5 to 17

COMPARE

Hungarian
Race
Ancestry
AfghanAfricanAlaska NativeAlaskan AthabascanAlbanianAleutAlsatianAmericanApacheArabArapahoArgentineanArmenianAssyrian/Chaldean/SyriacAustralianAustrianBahamianBangladeshiBarbadianBasqueBelgianBelizeanBermudanBhutaneseBlackfeetBolivianBrazilianBritishBritish West IndianBulgarianBurmeseCajunCambodianCanadianCape VerdeanCarpatho RusynCelticCentral AmericanCentral American IndianCherokeeCheyenneChickasawChileanChineseChippewaChoctawColombianColvilleComancheCosta RicanCreeCreekCroatianCrowCubanCypriotCzechCzechoslovakianDanishDelawareDominicanDutchDutch West IndianEastern EuropeanEcuadorianEgyptianEnglishEstonianEthiopianEuropeanFijianFilipinoFinnishFrenchFrench American IndianFrench CanadianGermanGerman RussianGhanaianGreekGuamanian/ChamorroGuatemalanGuyaneseHaitianHmongHonduranHopiHoumaHungarianIcelanderIndian (Asian)IndonesianInupiatIranianIraqiIrishIroquoisIsraeliItalianJamaicanJapaneseJordanianKenyanKiowaKoreanLaotianLatvianLebaneseLiberianLithuanianLumbeeLuxembourgerMacedonianMalaysianMalteseMarshalleseMenomineeMexicanMexican American IndianMongolianMoroccanNative HawaiianNavajoNepaleseNew ZealanderNicaraguanNigerianNorthern EuropeanNorwegianOkinawanOsageOttawaPaiutePakistaniPalestinianPanamanianParaguayanPennsylvania GermanPeruvianPimaPolishPortuguesePotawatomiPuebloPuerto RicanPuget Sound SalishRomanianRussianSalvadoranSamoanScandinavianScotch-IrishScottishSeminoleSenegaleseSerbianShoshoneSierra LeoneanSiouxSlavicSlovakSloveneSomaliSouth AfricanSouth AmericanSouth American IndianSoviet UnionSpaniardSpanishSpanish AmericanSpanish American IndianSri LankanSubsaharan AfricanSudaneseSwedishSwissSyrianTaiwaneseThaiTlingit-HaidaTohono O'OdhamTonganTrinidadian and TobagonianTsimshianTurkishU.S. Virgin IslanderUgandanUkrainianUruguayanUteVenezuelanVietnameseWelshWest IndianYakamaYaquiYugoslavianYumanYup'ikZimbabwean
Immigration
NonimmigrantsImmigrantsAfghanistanAfricaAlbaniaArgentinaArmeniaAsiaAustraliaAustriaBahamasBangladeshBarbadosBelarusBelgiumBelizeBoliviaBosnia and HerzegovinaBrazilBulgariaBurma/MyanmarCabo VerdeCambodiaCameroonCanadaCaribbeanCentral AmericaChileChinaColombiaCongoCosta RicaCroatiaCubaCzechoslovakiaDenmarkDominicaDominican RepublicEastern AfricaEastern AsiaEastern EuropeEcuadorEgyptEl SalvadorEnglandEritreaEthiopiaEuropeFijiFranceGermanyGhanaGreeceGrenadaGuatemalaGuyanaHaitiHondurasHong KongHungaryIndiaIndonesiaIranIraqIrelandIsraelItalyJamaicaJapanJordanKazakhstanKenyaKoreaKuwaitLaosLatin AmericaLatviaLebanonLiberiaLithuaniaMalaysiaMexicoMicronesiaMiddle AfricaMoldovaMoroccoNepalNetherlandsNicaraguaNigeriaNorth AmericaNorth MacedoniaNorthern AfricaNorthern EuropeNorwayOceaniaPakistanPanamaPeruPhilippinesPolandPortugalRomaniaRussiaSaudi ArabiaScotlandSenegalSerbiaSierra LeoneSingaporeSomaliaSouth AfricaSouth AmericaSouth Central AsiaSouth Eastern AsiaSouthern EuropeSpainSri LankaSt. Vincent and the GrenadinesSudanSwedenSwitzerlandSyriaTaiwanThailandTrinidad and TobagoTurkeyUgandaUkraineUruguayUzbekistanVenezuelaVietnamWest IndiesWestern AfricaWestern AsiaWestern EuropeYemenZaireZimbabweAzores
Select to Compare
Race
Ancestry
AfghanAfricanAlaska NativeAlaskan AthabascanAlbanianAleutAlsatianAmericanApacheArabArapahoArgentineanArmenianAssyrian/Chaldean/SyriacAustralianAustrianBahamianBangladeshiBarbadianBasqueBelgianBelizeanBermudanBhutaneseBlackfeetBolivianBrazilianBritishBritish West IndianBulgarianBurmeseCajunCambodianCanadianCape VerdeanCarpatho RusynCelticCentral AmericanCentral American IndianCherokeeCheyenneChickasawChileanChineseChippewaChoctawColombianColvilleComancheCosta RicanCreeCreekCroatianCrowCubanCypriotCzechCzechoslovakianDanishDelawareDominicanDutchDutch West IndianEastern EuropeanEcuadorianEgyptianEnglishEstonianEthiopianEuropeanFijianFilipinoFinnishFrenchFrench American IndianFrench CanadianGermanGerman RussianGhanaianGreekGuamanian/ChamorroGuatemalanGuyaneseHaitianHmongHonduranHopiHoumaIcelanderIndian (Asian)IndonesianInupiatIranianIraqiIrishIroquoisIsraeliItalianJamaicanJapaneseJordanianKenyanKiowaKoreanLaotianLatvianLebaneseLiberianLithuanianLumbeeLuxembourgerMacedonianMalaysianMalteseMarshalleseMenomineeMexicanMexican American IndianMongolianMoroccanNative HawaiianNavajoNepaleseNew ZealanderNicaraguanNigerianNorthern EuropeanNorwegianOkinawanOsageOttawaPaiutePakistaniPalestinianPanamanianParaguayanPennsylvania GermanPeruvianPimaPolishPortuguesePotawatomiPuebloPuerto RicanPuget Sound SalishRomanianRussianSalvadoranSamoanScandinavianScotch-IrishScottishSeminoleSenegaleseSerbianShoshoneSierra LeoneanSiouxSlavicSlovakSloveneSomaliSouth AfricanSouth AmericanSouth American IndianSoviet UnionSpaniardSpanishSpanish AmericanSpanish American IndianSri LankanSubsaharan AfricanSudaneseSwedishSwissSyrianTaiwaneseThaiTlingit-HaidaTohono O'OdhamTonganTrinidadian and TobagonianTsimshianTurkishU.S. Virgin IslanderUgandanUkrainianUruguayanUteVenezuelanVietnameseWelshWest IndianYakamaYaquiYugoslavianYumanYup'ikZimbabwean
Immigration
NonimmigrantsImmigrantsAfghanistanAfricaAlbaniaArgentinaArmeniaAsiaAustraliaAustriaBahamasBangladeshBarbadosBelarusBelgiumBelizeBoliviaBosnia and HerzegovinaBrazilBulgariaBurma/MyanmarCabo VerdeCambodiaCameroonCanadaCaribbeanCentral AmericaChileChinaColombiaCongoCosta RicaCroatiaCubaCzechoslovakiaDenmarkDominicaDominican RepublicEastern AfricaEastern AsiaEastern EuropeEcuadorEgyptEl SalvadorEnglandEritreaEthiopiaEuropeFijiFranceGermanyGhanaGreeceGrenadaGuatemalaGuyanaHaitiHondurasHong KongHungaryIndiaIndonesiaIranIraqIrelandIsraelItalyJamaicaJapanJordanKazakhstanKenyaKoreaKuwaitLaosLatin AmericaLatviaLebanonLiberiaLithuaniaMalaysiaMexicoMicronesiaMiddle AfricaMoldovaMoroccoNepalNetherlandsNicaraguaNigeriaNorth AmericaNorth MacedoniaNorthern AfricaNorthern EuropeNorwayOceaniaPakistanPanamaPeruPhilippinesPolandPortugalRomaniaRussiaSaudi ArabiaScotlandSenegalSerbiaSierra LeoneSingaporeSomaliaSouth AfricaSouth AmericaSouth Central AsiaSouth Eastern AsiaSouthern EuropeSpainSri LankaSt. Vincent and the GrenadinesSudanSwedenSwitzerlandSyriaTaiwanThailandTrinidad and TobagoTurkeyUgandaUkraineUruguayUzbekistanVenezuelaVietnamWest IndiesWestern AfricaWestern AsiaWestern EuropeYemenZaireZimbabweAzores
Disability Age 5 to 17
Income
Poverty
Unemployment
Labor Participation
Family Structure
Vehicle Availability
Education Level
Disability

Hungarian Disability Age 5 to 17
Tragic

5.8%
DISABILITY | AGE 5 TO 17
2.6/ 100
METRIC RATING
238th/ 347
METRIC RANK

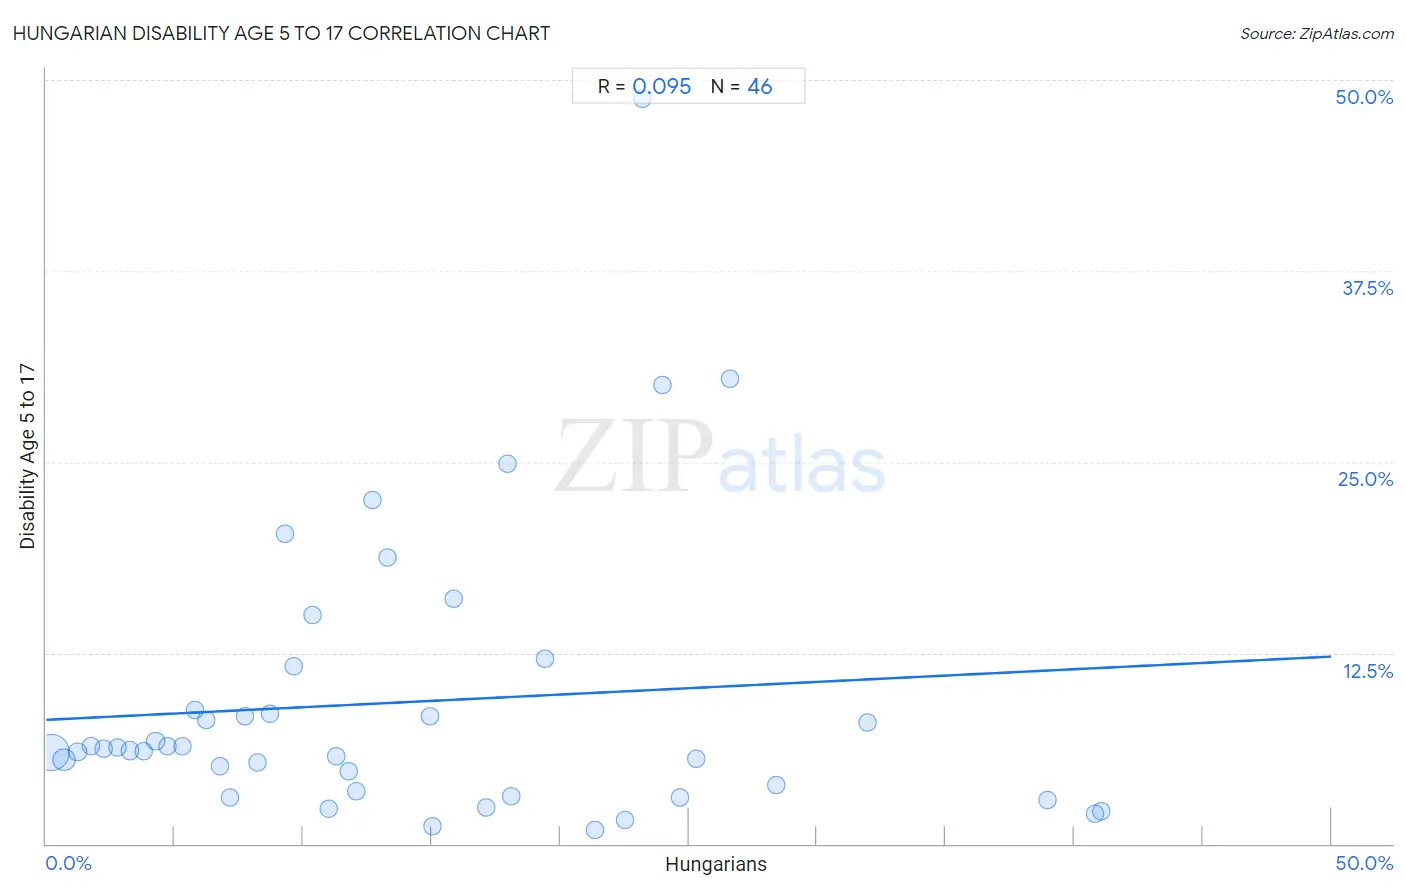
Hungarian Disability Age 5 to 17 Correlation Chart

The statistical analysis conducted on geographies consisting of 479,147,501 people shows a slight positive correlation between the proportion of Hungarians and percentage of population with a disability between the ages 5 and 17 in the United States with a correlation coefficient (R) of 0.095 and weighted average of 5.8%. On average, for every 1% (one percent) increase in Hungarians within a typical geography, there is an increase of 0.083% in percentage of population with a disability between the ages 5 and 17.
Hungarian Disability Age 5 to 17
It is essential to understand that the correlation between the percentage of Hungarians and percentage of population with a disability between the ages 5 and 17 does not imply a direct cause-and-effect relationship. It remains uncertain whether the presence of Hungarians influences an upward or downward trend in the level of percentage of population with a disability between the ages 5 and 17 within an area, or if Hungarians simply ended up residing in those areas with higher or lower levels of percentage of population with a disability between the ages 5 and 17 due to other factors.

Demographics Similar to Hungarians by Disability Age 5 to 17

In terms of disability age 5 to 17, the demographic groups most similar to Hungarians are Sudanese (5.8%, a difference of 0.10%), German Russian (5.9%, a difference of 0.10%), West Indian (5.9%, a difference of 0.12%), Immigrants from Brazil (5.8%, a difference of 0.25%), and Immigrants from Caribbean (5.9%, a difference of 0.26%).
DemographicsRating | RankDisability Age 5 to 17
Europeans
4.5
/100
|
#231
Tragic
5.8%
Immigrants from Laos
3.8
/100
|
#232
Tragic
5.8%
Immigrants from West Indies
3.5
/100
|
#233
Tragic
5.8%
Immigrants from Kenya
3.4
/100
|
#234
Tragic
5.8%
Malaysians
3.4
/100
|
#235
Tragic
5.8%
Immigrants from Brazil
3.2
/100
|
#236
Tragic
5.8%
Sudanese
2.9
/100
|
#237
Tragic
5.8%
Hungarians
2.6
/100
|
#238
Tragic
5.8%
German Russians
2.4
/100
|
#239
Tragic
5.9%
West Indians
2.4
/100
|
#240
Tragic
5.9%
Immigrants from Caribbean
2.1
/100
|
#241
Tragic
5.9%
Spaniards
2.0
/100
|
#242
Tragic
5.9%
Indonesians
2.0
/100
|
#243
Tragic
5.9%
Immigrants from Germany
1.9
/100
|
#244
Tragic
5.9%
Immigrants from Micronesia
1.9
/100
|
#245
Tragic
5.9%

Hungarian Disability Age 5 to 17 Correlation Summary

MeasurementHungarian DataDisability Age 5 to 17 Data
Minimum0.21%0.90%
Maximum41.1%48.8%
Range40.8%47.9%
Mean14.1%9.3%
Median11.5%6.2%
Interquartile 25% (IQ1)5.8%3.5%
Interquartile 75% (IQ3)21.3%8.7%
Interquartile Range (IQR)15.6%5.3%
Standard Deviation (Sample)10.8%9.4%
Standard Deviation (Population)10.7%9.3%

Correlation Details

Hungarian PercentileSample SizeDisability Age 5 to 17
[
0.0%
-
0.5%
]
0.21%
354,482,8606.0%
[
0.5%
-
1.0%
]
0.68%
83,741,4855.5%
[
1.0%
-
1.5%
]
1.20%
20,983,1856.0%
[
1.5%
-
2.0%
]
1.73%
8,296,1046.4%
[
2.0%
-
2.5%
]
2.23%
3,827,7896.2%
[
2.5%
-
3.0%
]
2.75%
2,108,0706.3%
[
3.0%
-
3.5%
]
3.25%
1,761,0206.1%
[
3.5%
-
4.0%
]
3.77%
1,244,8116.1%
[
4.0%
-
4.5%
]
4.26%
859,8746.7%
[
4.5%
-
5.0%
]
4.74%
439,9026.4%
[
5.0%
-
5.5%
]
5.28%
411,9246.4%
[
5.5%
-
6.0%
]
5.78%
146,6428.7%
[
6.0%
-
6.5%
]
6.22%
135,5998.1%
[
6.5%
-
7.0%
]
6.77%
107,8215.1%
[
7.0%
-
7.5%
]
7.16%
71,8383.0%
[
7.5%
-
8.0%
]
7.76%
61,4588.4%
[
8.0%
-
8.5%
]
8.22%
41,3025.3%
[
8.5%
-
9.0%
]
8.69%
23,7468.5%
[
9.0%
-
9.5%
]
9.27%
4,69220.3%
[
9.5%
-
10.0%
]
9.65%
7,74911.6%
[
10.0%
-
10.5%
]
10.36%
4,29615.0%
[
10.5%
-
11.0%
]
10.97%
50,9292.3%
[
11.0%
-
11.5%
]
11.30%
25,9795.8%
[
11.5%
-
12.0%
]
11.76%
18,6334.7%
[
12.0%
-
12.5%
]
12.05%
75,5183.5%
[
12.5%
-
13.0%
]
12.72%
1,94222.5%
[
13.0%
-
13.5%
]
13.26%
37718.8%
[
14.5%
-
15.0%
]
14.94%
3088.3%
[
15.0%
-
15.5%
]
15.05%
6,7731.2%
[
15.5%
-
16.0%
]
15.85%
16416.0%
[
17.0%
-
17.5%
]
17.14%
48,2292.4%
[
17.5%
-
18.0%
]
17.96%
80224.9%
[
18.0%
-
18.5%
]
18.12%
1383.1%
[
19.0%
-
19.5%
]
19.42%
1,79212.1%
[
21.0%
-
21.5%
]
21.35%
28,2870.90%
[
22.5%
-
23.0%
]
22.53%
7,3851.5%
[
23.0%
-
23.5%
]
23.21%
22448.8%
[
24.0%
-
24.5%
]
24.00%
12530.0%
[
24.5%
-
25.0%
]
24.64%
63,0113.1%
[
25.0%
-
25.5%
]
25.30%
5,5015.5%
[
26.5%
-
27.0%
]
26.60%
18830.4%
[
28.0%
-
28.5%
]
28.39%
2363.9%
[
31.5%
-
32.0%
]
31.96%
3,8587.9%
[
38.5%
-
39.0%
]
38.95%
9,5782.8%
[
40.5%
-
41.0%
]
40.81%
34,3952.0%
[
41.0%
-
41.5%
]
41.06%
9622.1%