Laotian Disability Age 5 to 17

COMPARE

Laotian
Race
Ancestry
AfghanAfricanAlaska NativeAlaskan AthabascanAlbanianAleutAlsatianAmericanApacheArabArapahoArgentineanArmenianAssyrian/Chaldean/SyriacAustralianAustrianBahamianBangladeshiBarbadianBasqueBelgianBelizeanBermudanBhutaneseBlackfeetBolivianBrazilianBritishBritish West IndianBulgarianBurmeseCajunCambodianCanadianCape VerdeanCarpatho RusynCelticCentral AmericanCentral American IndianCherokeeCheyenneChickasawChileanChineseChippewaChoctawColombianColvilleComancheCosta RicanCreeCreekCroatianCrowCubanCypriotCzechCzechoslovakianDanishDelawareDominicanDutchDutch West IndianEastern EuropeanEcuadorianEgyptianEnglishEstonianEthiopianEuropeanFijianFilipinoFinnishFrenchFrench American IndianFrench CanadianGermanGerman RussianGhanaianGreekGuamanian/ChamorroGuatemalanGuyaneseHaitianHmongHonduranHopiHoumaHungarianIcelanderIndian (Asian)IndonesianInupiatIranianIraqiIrishIroquoisIsraeliItalianJamaicanJapaneseJordanianKenyanKiowaKoreanLaotianLatvianLebaneseLiberianLithuanianLumbeeLuxembourgerMacedonianMalaysianMalteseMarshalleseMenomineeMexicanMexican American IndianMongolianMoroccanNative HawaiianNavajoNepaleseNew ZealanderNicaraguanNigerianNorthern EuropeanNorwegianOkinawanOsageOttawaPaiutePakistaniPalestinianPanamanianParaguayanPennsylvania GermanPeruvianPimaPolishPortuguesePotawatomiPuebloPuerto RicanPuget Sound SalishRomanianRussianSalvadoranSamoanScandinavianScotch-IrishScottishSeminoleSenegaleseSerbianShoshoneSierra LeoneanSiouxSlavicSlovakSloveneSomaliSouth AfricanSouth AmericanSouth American IndianSoviet UnionSpaniardSpanishSpanish AmericanSpanish American IndianSri LankanSubsaharan AfricanSudaneseSwedishSwissSyrianTaiwaneseThaiTlingit-HaidaTohono O'OdhamTonganTrinidadian and TobagonianTsimshianTurkishU.S. Virgin IslanderUgandanUkrainianUruguayanUteVenezuelanVietnameseWelshWest IndianYakamaYaquiYugoslavianYumanYup'ikZimbabwean
Immigration
NonimmigrantsImmigrantsAfghanistanAfricaAlbaniaArgentinaArmeniaAsiaAustraliaAustriaBahamasBangladeshBarbadosBelarusBelgiumBelizeBoliviaBosnia and HerzegovinaBrazilBulgariaBurma/MyanmarCabo VerdeCambodiaCameroonCanadaCaribbeanCentral AmericaChileChinaColombiaCongoCosta RicaCroatiaCubaCzechoslovakiaDenmarkDominicaDominican RepublicEastern AfricaEastern AsiaEastern EuropeEcuadorEgyptEl SalvadorEnglandEritreaEthiopiaEuropeFijiFranceGermanyGhanaGreeceGrenadaGuatemalaGuyanaHaitiHondurasHong KongHungaryIndiaIndonesiaIranIraqIrelandIsraelItalyJamaicaJapanJordanKazakhstanKenyaKoreaKuwaitLaosLatin AmericaLatviaLebanonLiberiaLithuaniaMalaysiaMexicoMicronesiaMiddle AfricaMoldovaMoroccoNepalNetherlandsNicaraguaNigeriaNorth AmericaNorth MacedoniaNorthern AfricaNorthern EuropeNorwayOceaniaPakistanPanamaPeruPhilippinesPolandPortugalRomaniaRussiaSaudi ArabiaScotlandSenegalSerbiaSierra LeoneSingaporeSomaliaSouth AfricaSouth AmericaSouth Central AsiaSouth Eastern AsiaSouthern EuropeSpainSri LankaSt. Vincent and the GrenadinesSudanSwedenSwitzerlandSyriaTaiwanThailandTrinidad and TobagoTurkeyUgandaUkraineUruguayUzbekistanVenezuelaVietnamWest IndiesWestern AfricaWestern AsiaWestern EuropeYemenZaireZimbabweAzores
Select to Compare
Race
Ancestry
AfghanAfricanAlaska NativeAlaskan AthabascanAlbanianAleutAlsatianAmericanApacheArabArapahoArgentineanArmenianAssyrian/Chaldean/SyriacAustralianAustrianBahamianBangladeshiBarbadianBasqueBelgianBelizeanBermudanBhutaneseBlackfeetBolivianBrazilianBritishBritish West IndianBulgarianBurmeseCajunCambodianCanadianCape VerdeanCarpatho RusynCelticCentral AmericanCentral American IndianCherokeeCheyenneChickasawChileanChineseChippewaChoctawColombianColvilleComancheCosta RicanCreeCreekCroatianCrowCubanCypriotCzechCzechoslovakianDanishDelawareDominicanDutchDutch West IndianEastern EuropeanEcuadorianEgyptianEnglishEstonianEthiopianEuropeanFijianFilipinoFinnishFrenchFrench American IndianFrench CanadianGermanGerman RussianGhanaianGreekGuamanian/ChamorroGuatemalanGuyaneseHaitianHmongHonduranHopiHoumaHungarianIcelanderIndian (Asian)IndonesianInupiatIranianIraqiIrishIroquoisIsraeliItalianJamaicanJapaneseJordanianKenyanKiowaKoreanLatvianLebaneseLiberianLithuanianLumbeeLuxembourgerMacedonianMalaysianMalteseMarshalleseMenomineeMexicanMexican American IndianMongolianMoroccanNative HawaiianNavajoNepaleseNew ZealanderNicaraguanNigerianNorthern EuropeanNorwegianOkinawanOsageOttawaPaiutePakistaniPalestinianPanamanianParaguayanPennsylvania GermanPeruvianPimaPolishPortuguesePotawatomiPuebloPuerto RicanPuget Sound SalishRomanianRussianSalvadoranSamoanScandinavianScotch-IrishScottishSeminoleSenegaleseSerbianShoshoneSierra LeoneanSiouxSlavicSlovakSloveneSomaliSouth AfricanSouth AmericanSouth American IndianSoviet UnionSpaniardSpanishSpanish AmericanSpanish American IndianSri LankanSubsaharan AfricanSudaneseSwedishSwissSyrianTaiwaneseThaiTlingit-HaidaTohono O'OdhamTonganTrinidadian and TobagonianTsimshianTurkishU.S. Virgin IslanderUgandanUkrainianUruguayanUteVenezuelanVietnameseWelshWest IndianYakamaYaquiYugoslavianYumanYup'ikZimbabwean
Immigration
NonimmigrantsImmigrantsAfghanistanAfricaAlbaniaArgentinaArmeniaAsiaAustraliaAustriaBahamasBangladeshBarbadosBelarusBelgiumBelizeBoliviaBosnia and HerzegovinaBrazilBulgariaBurma/MyanmarCabo VerdeCambodiaCameroonCanadaCaribbeanCentral AmericaChileChinaColombiaCongoCosta RicaCroatiaCubaCzechoslovakiaDenmarkDominicaDominican RepublicEastern AfricaEastern AsiaEastern EuropeEcuadorEgyptEl SalvadorEnglandEritreaEthiopiaEuropeFijiFranceGermanyGhanaGreeceGrenadaGuatemalaGuyanaHaitiHondurasHong KongHungaryIndiaIndonesiaIranIraqIrelandIsraelItalyJamaicaJapanJordanKazakhstanKenyaKoreaKuwaitLaosLatin AmericaLatviaLebanonLiberiaLithuaniaMalaysiaMexicoMicronesiaMiddle AfricaMoldovaMoroccoNepalNetherlandsNicaraguaNigeriaNorth AmericaNorth MacedoniaNorthern AfricaNorthern EuropeNorwayOceaniaPakistanPanamaPeruPhilippinesPolandPortugalRomaniaRussiaSaudi ArabiaScotlandSenegalSerbiaSierra LeoneSingaporeSomaliaSouth AfricaSouth AmericaSouth Central AsiaSouth Eastern AsiaSouthern EuropeSpainSri LankaSt. Vincent and the GrenadinesSudanSwedenSwitzerlandSyriaTaiwanThailandTrinidad and TobagoTurkeyUgandaUkraineUruguayUzbekistanVenezuelaVietnamWest IndiesWestern AfricaWestern AsiaWestern EuropeYemenZaireZimbabweAzores
Disability Age 5 to 17
Income
Poverty
Unemployment
Labor Participation
Family Structure
Vehicle Availability
Education Level
Disability

Laotian Disability Age 5 to 17
Exceptional

5.1%
DISABILITY | AGE 5 TO 17
99.9/ 100
METRIC RATING
55th/ 347
METRIC RANK

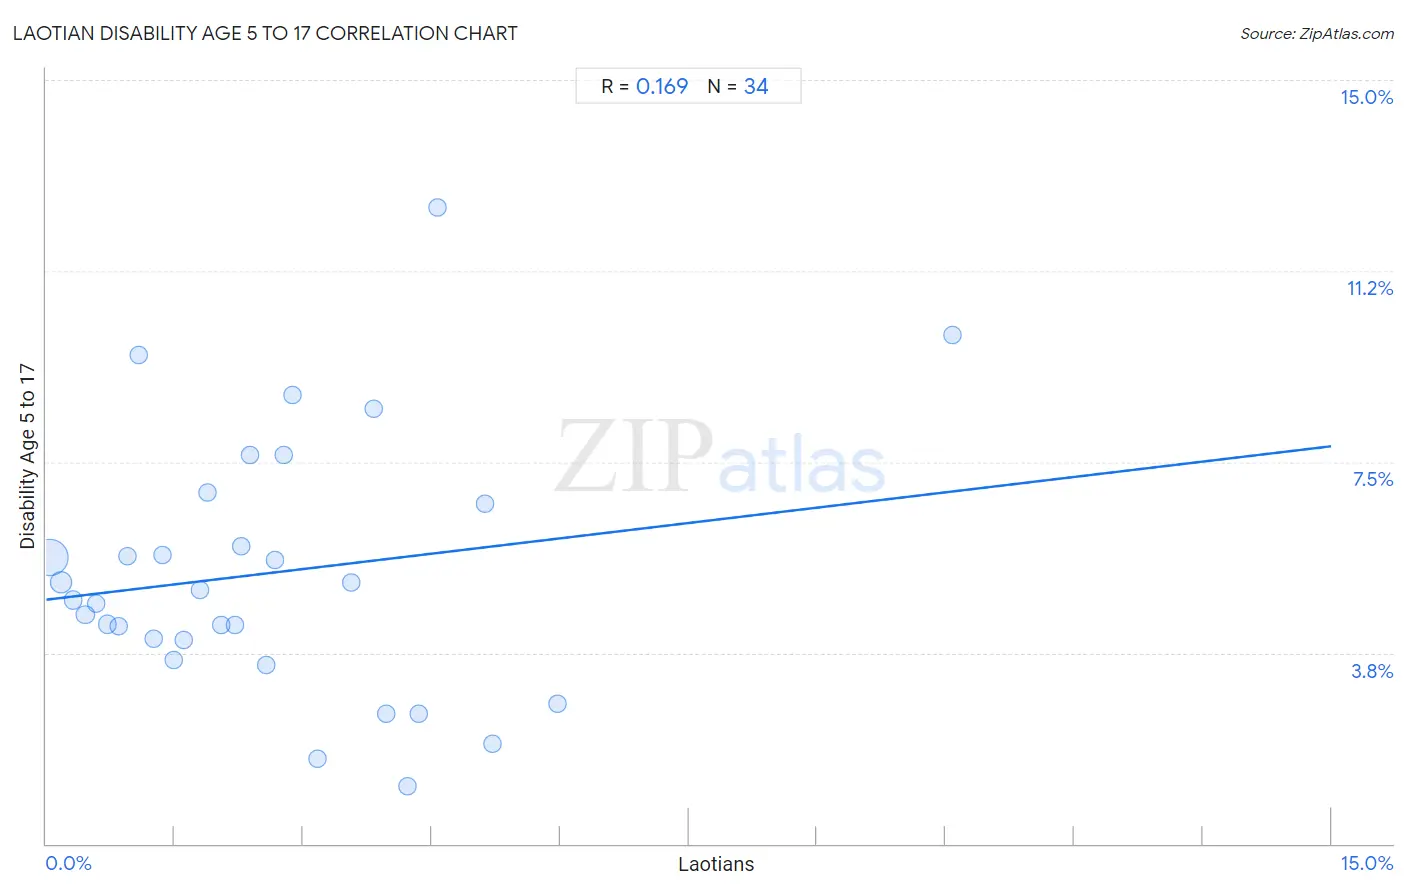
Laotian Disability Age 5 to 17 Correlation Chart

The statistical analysis conducted on geographies consisting of 223,927,841 people shows a poor positive correlation between the proportion of Laotians and percentage of population with a disability between the ages 5 and 17 in the United States with a correlation coefficient (R) of 0.169 and weighted average of 5.1%. On average, for every 1% (one percent) increase in Laotians within a typical geography, there is an increase of 0.20% in percentage of population with a disability between the ages 5 and 17.
Laotian Disability Age 5 to 17
It is essential to understand that the correlation between the percentage of Laotians and percentage of population with a disability between the ages 5 and 17 does not imply a direct cause-and-effect relationship. It remains uncertain whether the presence of Laotians influences an upward or downward trend in the level of percentage of population with a disability between the ages 5 and 17 within an area, or if Laotians simply ended up residing in those areas with higher or lower levels of percentage of population with a disability between the ages 5 and 17 due to other factors.

Demographics Similar to Laotians by Disability Age 5 to 17

In terms of disability age 5 to 17, the demographic groups most similar to Laotians are Immigrants from Turkey (5.1%, a difference of 0.010%), Paraguayan (5.1%, a difference of 0.040%), Immigrants from Lithuania (5.1%, a difference of 0.070%), Immigrants from Fiji (5.1%, a difference of 0.13%), and Immigrants from Poland (5.1%, a difference of 0.16%).
DemographicsRating | RankDisability Age 5 to 17
Koreans
100.0
/100
|
#48
Exceptional
5.1%
Immigrants from Western Asia
100.0
/100
|
#49
Exceptional
5.1%
Argentineans
99.9
/100
|
#50
Exceptional
5.1%
Turks
99.9
/100
|
#51
Exceptional
5.1%
Immigrants from Fiji
99.9
/100
|
#52
Exceptional
5.1%
Immigrants from Lithuania
99.9
/100
|
#53
Exceptional
5.1%
Paraguayans
99.9
/100
|
#54
Exceptional
5.1%
Laotians
99.9
/100
|
#55
Exceptional
5.1%
Immigrants from Turkey
99.9
/100
|
#56
Exceptional
5.1%
Immigrants from Poland
99.9
/100
|
#57
Exceptional
5.1%
Immigrants from Ukraine
99.9
/100
|
#58
Exceptional
5.1%
Immigrants from North Macedonia
99.9
/100
|
#59
Exceptional
5.1%
Immigrants from Eastern Europe
99.9
/100
|
#60
Exceptional
5.1%
Immigrants from Switzerland
99.8
/100
|
#61
Exceptional
5.2%
Immigrants from Ireland
99.8
/100
|
#62
Exceptional
5.2%

Laotian Disability Age 5 to 17 Correlation Summary

MeasurementLaotian DataDisability Age 5 to 17 Data
Minimum0.051%1.1%
Maximum10.6%12.5%
Range10.5%11.4%
Mean2.6%5.3%
Median2.2%4.9%
Interquartile 25% (IQ1)1.1%4.0%
Interquartile 75% (IQ3)3.8%6.7%
Interquartile Range (IQR)2.7%2.7%
Standard Deviation (Sample)2.1%2.5%
Standard Deviation (Population)2.1%2.5%

Correlation Details

Laotian PercentileSample SizeDisability Age 5 to 17
[
0.0%
-
0.5%
]
0.051%
165,275,0415.6%
[
0.0%
-
0.5%
]
0.18%
36,188,5115.1%
[
0.0%
-
0.5%
]
0.31%
10,140,5654.8%
[
0.0%
-
0.5%
]
0.45%
5,422,7694.5%
[
0.5%
-
1.0%
]
0.59%
2,174,6914.7%
[
0.5%
-
1.0%
]
0.71%
1,975,3244.3%
[
0.5%
-
1.0%
]
0.85%
795,5344.3%
[
0.5%
-
1.0%
]
0.94%
617,8015.7%
[
1.0%
-
1.5%
]
1.08%
170,5419.6%
[
1.0%
-
1.5%
]
1.26%
202,3404.0%
[
1.0%
-
1.5%
]
1.35%
159,5645.7%
[
1.0%
-
1.5%
]
1.49%
151,5853.6%
[
1.5%
-
2.0%
]
1.60%
14,6534.0%
[
1.5%
-
2.0%
]
1.80%
230,9235.0%
[
1.5%
-
2.0%
]
1.89%
43,2136.9%
[
2.0%
-
2.5%
]
2.05%
105,6984.3%
[
2.0%
-
2.5%
]
2.20%
57,2924.3%
[
2.0%
-
2.5%
]
2.27%
43,3455.8%
[
2.0%
-
2.5%
]
2.38%
17,6487.6%
[
2.5%
-
3.0%
]
2.57%
4,9083.5%
[
2.5%
-
3.0%
]
2.67%
10,9805.6%
[
2.5%
-
3.0%
]
2.77%
51,0027.6%
[
2.5%
-
3.0%
]
2.88%
2438.8%
[
3.0%
-
3.5%
]
3.17%
9471.7%
[
3.5%
-
4.0%
]
3.56%
12,4785.1%
[
3.5%
-
4.0%
]
3.82%
8908.6%
[
3.5%
-
4.0%
]
3.98%
4,1502.5%
[
4.0%
-
4.5%
]
4.22%
1,1381.1%
[
4.0%
-
4.5%
]
4.35%
26,5562.6%
[
4.5%
-
5.0%
]
4.57%
63412.5%
[
5.0%
-
5.5%
]
5.12%
7226.7%
[
5.0%
-
5.5%
]
5.21%
1,8812.0%
[
5.5%
-
6.0%
]
5.97%
23,0542.8%
[
10.5%
-
11.0%
]
10.57%
1,22010.0%