Mongolian Disability Age 5 to 17
COMPARE
Mongolian
Select to Compare
Disability Age 5 to 17
Mongolian Disability Age 5 to 17
5.3%
DISABILITY | AGE 5 TO 17
99.2/ 100
METRIC RATING
91st/ 347
METRIC RANK
Mongolian Disability Age 5 to 17 Correlation Chart
The statistical analysis conducted on geographies consisting of 139,966,367 people shows a moderate positive correlation between the proportion of Mongolians and percentage of population with a disability between the ages 5 and 17 in the United States with a correlation coefficient (R) of 0.437 and weighted average of 5.3%. On average, for every 1% (one percent) increase in Mongolians within a typical geography, there is an increase of 2.7% in percentage of population with a disability between the ages 5 and 17.
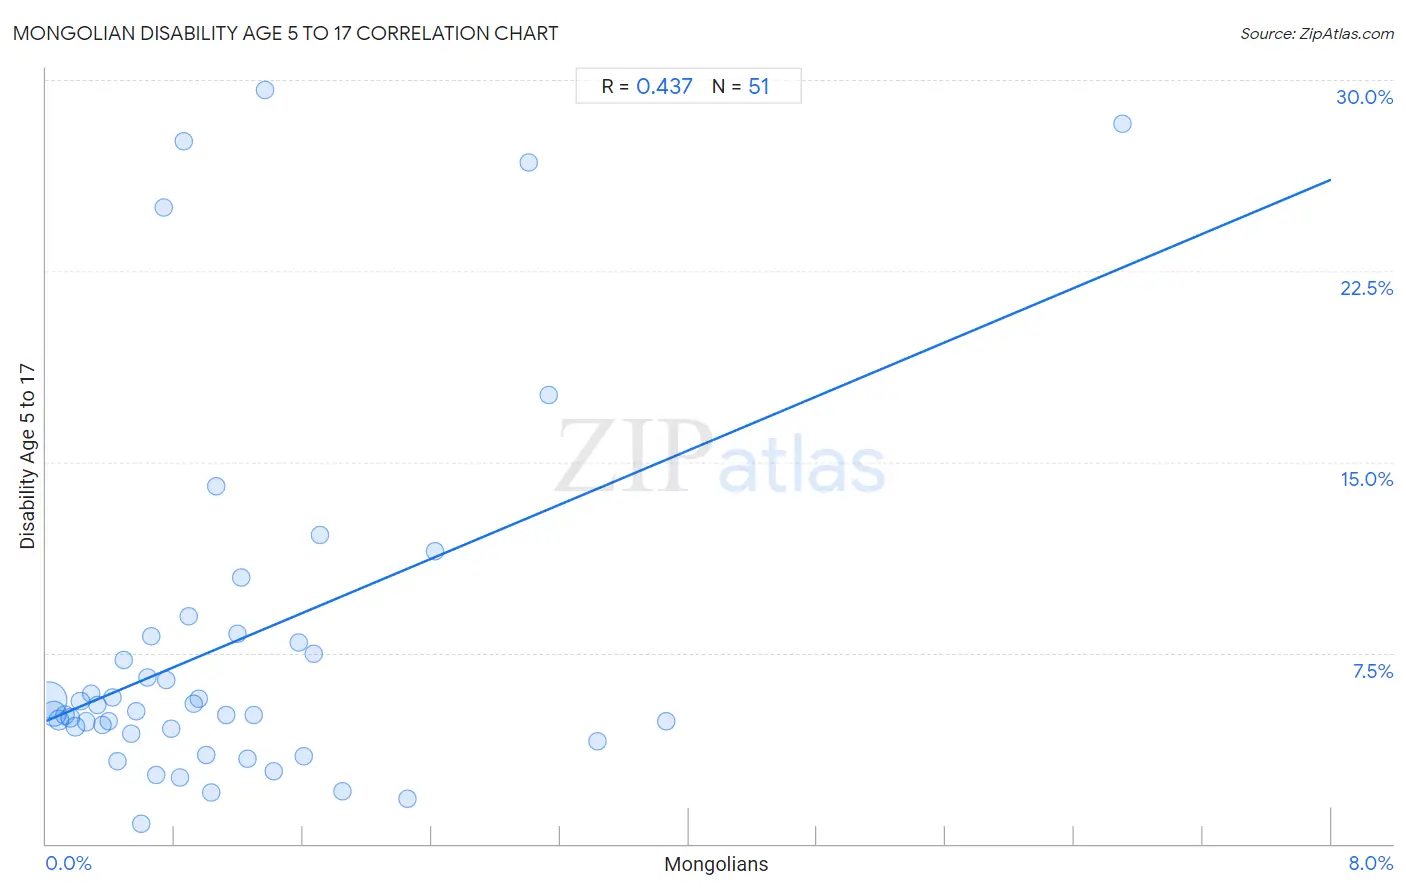
It is essential to understand that the correlation between the percentage of Mongolians and percentage of population with a disability between the ages 5 and 17 does not imply a direct cause-and-effect relationship. It remains uncertain whether the presence of Mongolians influences an upward or downward trend in the level of percentage of population with a disability between the ages 5 and 17 within an area, or if Mongolians simply ended up residing in those areas with higher or lower levels of percentage of population with a disability between the ages 5 and 17 due to other factors.
Demographics Similar to Mongolians by Disability Age 5 to 17
In terms of disability age 5 to 17, the demographic groups most similar to Mongolians are Luxembourger (5.3%, a difference of 0.010%), Immigrants from Peru (5.3%, a difference of 0.090%), Immigrants from Jordan (5.3%, a difference of 0.16%), Immigrants from Grenada (5.3%, a difference of 0.18%), and Immigrants from Kuwait (5.3%, a difference of 0.29%).
| Demographics | Rating | Rank | Disability Age 5 to 17 |
| Immigrants from Nicaragua | 99.5 /100 | #84 | Exceptional 5.2% |
| Bulgarians | 99.4 /100 | #85 | Exceptional 5.2% |
| Immigrants from St. Vincent and the Grenadines | 99.4 /100 | #86 | Exceptional 5.2% |
| Eastern Europeans | 99.4 /100 | #87 | Exceptional 5.2% |
| Immigrants from Croatia | 99.4 /100 | #88 | Exceptional 5.2% |
| Immigrants from Spain | 99.4 /100 | #89 | Exceptional 5.2% |
| Immigrants from Kuwait | 99.4 /100 | #90 | Exceptional 5.3% |
| Mongolians | 99.2 /100 | #91 | Exceptional 5.3% |
| Luxembourgers | 99.2 /100 | #92 | Exceptional 5.3% |
| Immigrants from Peru | 99.1 /100 | #93 | Exceptional 5.3% |
| Immigrants from Jordan | 99.1 /100 | #94 | Exceptional 5.3% |
| Immigrants from Grenada | 99.1 /100 | #95 | Exceptional 5.3% |
| Immigrants from El Salvador | 99.0 /100 | #96 | Exceptional 5.3% |
| Immigrants from Europe | 99.0 /100 | #97 | Exceptional 5.3% |
| Immigrants from Austria | 98.9 /100 | #98 | Exceptional 5.3% |
Mongolian Disability Age 5 to 17 Correlation Summary
| Measurement | Mongolian Data | Disability Age 5 to 17 Data |
| Minimum | 0.014% | 0.80% |
| Maximum | 6.7% | 29.6% |
| Range | 6.7% | 28.8% |
| Mean | 1.2% | 7.9% |
| Median | 0.85% | 5.2% |
| Interquartile 25% (IQ1) | 0.41% | 4.3% |
| Interquartile 75% (IQ3) | 1.4% | 8.1% |
| Interquartile Range (IQR) | 1.0% | 3.8% |
| Standard Deviation (Sample) | 1.2% | 7.2% |
| Standard Deviation (Population) | 1.2% | 7.1% |
Correlation Details
| Mongolian Percentile | Sample Size | Disability Age 5 to 17 |
[ 0.0% - 0.5% ] 0.014% | 81,106,439 | 5.7% |
[ 0.0% - 0.5% ] 0.047% | 32,776,489 | 5.1% |
[ 0.0% - 0.5% ] 0.081% | 10,145,820 | 4.9% |
[ 0.0% - 0.5% ] 0.12% | 5,212,245 | 5.0% |
[ 0.0% - 0.5% ] 0.15% | 3,433,345 | 4.9% |
[ 0.0% - 0.5% ] 0.18% | 2,009,987 | 4.6% |
[ 0.0% - 0.5% ] 0.21% | 1,172,193 | 5.6% |
[ 0.0% - 0.5% ] 0.25% | 793,714 | 4.8% |
[ 0.0% - 0.5% ] 0.28% | 634,206 | 5.9% |
[ 0.0% - 0.5% ] 0.32% | 407,907 | 5.5% |
[ 0.0% - 0.5% ] 0.35% | 386,799 | 4.7% |
[ 0.0% - 0.5% ] 0.39% | 499,541 | 4.8% |
[ 0.0% - 0.5% ] 0.41% | 204,898 | 5.8% |
[ 0.0% - 0.5% ] 0.45% | 179,339 | 3.2% |
[ 0.0% - 0.5% ] 0.48% | 211,386 | 7.2% |
[ 0.5% - 1.0% ] 0.53% | 96,517 | 4.3% |
[ 0.5% - 1.0% ] 0.56% | 16,091 | 5.2% |
[ 0.5% - 1.0% ] 0.59% | 13,931 | 0.80% |
[ 0.5% - 1.0% ] 0.63% | 111,685 | 6.5% |
[ 0.5% - 1.0% ] 0.65% | 27,857 | 8.1% |
[ 0.5% - 1.0% ] 0.68% | 101,359 | 2.7% |
[ 0.5% - 1.0% ] 0.73% | 1,906 | 25.0% |
[ 0.5% - 1.0% ] 0.75% | 29,588 | 6.4% |
[ 0.5% - 1.0% ] 0.78% | 902 | 4.5% |
[ 0.5% - 1.0% ] 0.83% | 28,357 | 2.6% |
[ 0.5% - 1.0% ] 0.85% | 18,745 | 27.6% |
[ 0.5% - 1.0% ] 0.89% | 35,172 | 8.9% |
[ 0.5% - 1.0% ] 0.92% | 35,238 | 5.5% |
[ 0.5% - 1.0% ] 0.95% | 33,544 | 5.7% |
[ 0.5% - 1.0% ] 0.99% | 16,720 | 3.5% |
[ 1.0% - 1.5% ] 1.03% | 20,759 | 2.0% |
[ 1.0% - 1.5% ] 1.06% | 3,579 | 14.0% |
[ 1.0% - 1.5% ] 1.12% | 33,934 | 5.0% |
[ 1.0% - 1.5% ] 1.19% | 674 | 8.3% |
[ 1.0% - 1.5% ] 1.21% | 20,043 | 10.5% |
[ 1.0% - 1.5% ] 1.25% | 19,182 | 3.3% |
[ 1.0% - 1.5% ] 1.29% | 42,651 | 5.0% |
[ 1.0% - 1.5% ] 1.36% | 806 | 29.6% |
[ 1.0% - 1.5% ] 1.42% | 25,117 | 2.9% |
[ 1.5% - 2.0% ] 1.57% | 9,820 | 7.9% |
[ 1.5% - 2.0% ] 1.60% | 5,299 | 3.4% |
[ 1.5% - 2.0% ] 1.66% | 2,766 | 7.5% |
[ 1.5% - 2.0% ] 1.70% | 5,928 | 12.1% |
[ 1.5% - 2.0% ] 1.84% | 1,573 | 2.0% |
[ 2.0% - 2.5% ] 2.25% | 9,512 | 1.8% |
[ 2.0% - 2.5% ] 2.42% | 2,605 | 11.5% |
[ 3.0% - 3.5% ] 3.01% | 1,164 | 26.8% |
[ 3.0% - 3.5% ] 3.13% | 1,693 | 17.6% |
[ 3.0% - 3.5% ] 3.43% | 12,387 | 4.0% |
[ 3.5% - 4.0% ] 3.86% | 3,448 | 4.8% |
[ 6.5% - 7.0% ] 6.70% | 1,507 | 28.3% |