Navajo Disability Age 5 to 17
COMPARE
Navajo
Select to Compare
Disability Age 5 to 17
Navajo Disability Age 5 to 17
5.4%
DISABILITY | AGE 5 TO 17
90.9/ 100
METRIC RATING
137th/ 347
METRIC RANK
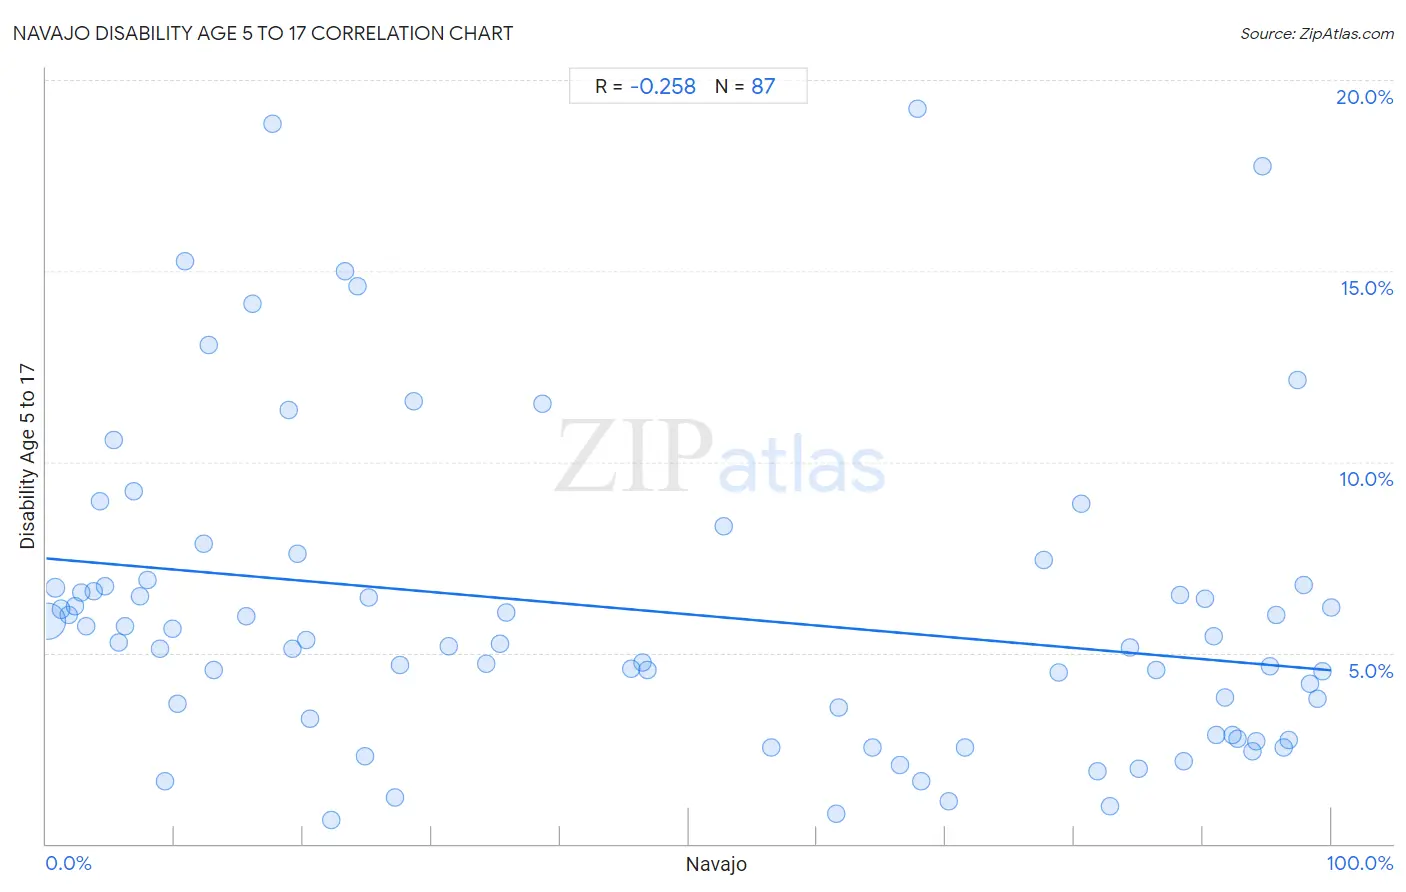
Navajo Disability Age 5 to 17 Correlation Chart
The statistical analysis conducted on geographies consisting of 223,670,452 people shows a weak negative correlation between the proportion of Navajo and percentage of population with a disability between the ages 5 and 17 in the United States with a correlation coefficient (R) of -0.258 and weighted average of 5.4%. On average, for every 1% (one percent) increase in Navajo within a typical geography, there is a decrease of 0.029% in percentage of population with a disability between the ages 5 and 17.
It is essential to understand that the correlation between the percentage of Navajo and percentage of population with a disability between the ages 5 and 17 does not imply a direct cause-and-effect relationship. It remains uncertain whether the presence of Navajo influences an upward or downward trend in the level of percentage of population with a disability between the ages 5 and 17 within an area, or if Navajo simply ended up residing in those areas with higher or lower levels of percentage of population with a disability between the ages 5 and 17 due to other factors.
Demographics Similar to Navajo by Disability Age 5 to 17
In terms of disability age 5 to 17, the demographic groups most similar to Navajo are Immigrants from Oceania (5.4%, a difference of 0.0%), Belizean (5.4%, a difference of 0.010%), Immigrants from Netherlands (5.4%, a difference of 0.060%), Immigrants from Denmark (5.4%, a difference of 0.080%), and Immigrants from Belize (5.4%, a difference of 0.13%).
| Demographics | Rating | Rank | Disability Age 5 to 17 |
| Immigrants from Bulgaria | 94.0 /100 | #130 | Exceptional 5.4% |
| Arabs | 92.9 /100 | #131 | Exceptional 5.4% |
| Immigrants from Colombia | 92.9 /100 | #132 | Exceptional 5.4% |
| Venezuelans | 92.7 /100 | #133 | Exceptional 5.4% |
| Yuman | 92.3 /100 | #134 | Exceptional 5.4% |
| Immigrants from Belize | 91.7 /100 | #135 | Exceptional 5.4% |
| Immigrants from Denmark | 91.4 /100 | #136 | Exceptional 5.4% |
| Navajo | 90.9 /100 | #137 | Exceptional 5.4% |
| Immigrants from Oceania | 90.8 /100 | #138 | Exceptional 5.4% |
| Belizeans | 90.8 /100 | #139 | Exceptional 5.4% |
| Immigrants from Netherlands | 90.5 /100 | #140 | Exceptional 5.4% |
| South American Indians | 89.3 /100 | #141 | Excellent 5.5% |
| Colombians | 88.0 /100 | #142 | Excellent 5.5% |
| Immigrants from Hungary | 87.9 /100 | #143 | Excellent 5.5% |
| Pakistanis | 87.3 /100 | #144 | Excellent 5.5% |
Navajo Disability Age 5 to 17 Correlation Summary
| Measurement | Navajo Data | Disability Age 5 to 17 Data |
| Minimum | 0.078% | 0.63% |
| Maximum | 100.0% | 19.3% |
| Range | 99.9% | 18.6% |
| Mean | 47.1% | 6.1% |
| Median | 35.8% | 5.3% |
| Interquartile 25% (IQ1) | 12.3% | 2.8% |
| Interquartile 75% (IQ3) | 86.3% | 6.8% |
| Interquartile Range (IQR) | 74.1% | 3.9% |
| Standard Deviation (Sample) | 36.1% | 4.1% |
| Standard Deviation (Population) | 35.9% | 4.1% |
Correlation Details
| Navajo Percentile | Sample Size | Disability Age 5 to 17 |
[ 0.0% - 0.5% ] 0.078% | 208,354,740 | 5.8% |
[ 0.5% - 1.0% ] 0.71% | 7,483,299 | 6.7% |
[ 1.0% - 1.5% ] 1.15% | 4,106,706 | 6.1% |
[ 1.5% - 2.0% ] 1.72% | 963,584 | 6.0% |
[ 2.0% - 2.5% ] 2.23% | 627,515 | 6.2% |
[ 2.5% - 3.0% ] 2.69% | 269,318 | 6.6% |
[ 3.0% - 3.5% ] 3.12% | 767,827 | 5.7% |
[ 3.5% - 4.0% ] 3.74% | 121,960 | 6.6% |
[ 4.0% - 4.5% ] 4.21% | 104,487 | 9.0% |
[ 4.5% - 5.0% ] 4.54% | 32,020 | 6.8% |
[ 5.0% - 5.5% ] 5.22% | 90,738 | 10.6% |
[ 5.5% - 6.0% ] 5.68% | 30,135 | 5.3% |
[ 6.0% - 6.5% ] 6.13% | 5,174 | 5.7% |
[ 6.5% - 7.0% ] 6.83% | 4,187 | 9.2% |
[ 7.0% - 7.5% ] 7.31% | 6,608 | 6.5% |
[ 7.5% - 8.0% ] 7.88% | 26,500 | 6.9% |
[ 8.5% - 9.0% ] 8.82% | 133,611 | 5.1% |
[ 9.0% - 9.5% ] 9.28% | 4,858 | 1.6% |
[ 9.5% - 10.0% ] 9.80% | 17,435 | 5.6% |
[ 10.0% - 10.5% ] 10.23% | 48,631 | 3.7% |
[ 10.5% - 11.0% ] 10.79% | 445 | 15.3% |
[ 12.0% - 12.5% ] 12.29% | 12,169 | 7.9% |
[ 12.5% - 13.0% ] 12.66% | 2,440 | 13.1% |
[ 13.0% - 13.5% ] 13.06% | 980 | 4.5% |
[ 15.5% - 16.0% ] 15.61% | 6,214 | 5.9% |
[ 16.0% - 16.5% ] 16.03% | 343 | 14.2% |
[ 17.5% - 18.0% ] 17.60% | 341 | 18.9% |
[ 18.5% - 19.0% ] 18.89% | 4,488 | 11.4% |
[ 19.0% - 19.5% ] 19.16% | 2,793 | 5.1% |
[ 19.5% - 20.0% ] 19.55% | 849 | 7.6% |
[ 20.0% - 20.5% ] 20.22% | 10,362 | 5.3% |
[ 20.5% - 21.0% ] 20.51% | 546 | 3.3% |
[ 22.0% - 22.5% ] 22.14% | 14,980 | 0.63% |
[ 23.0% - 23.5% ] 23.29% | 292 | 15.0% |
[ 24.0% - 24.5% ] 24.25% | 3,345 | 14.6% |
[ 24.5% - 25.0% ] 24.84% | 7,762 | 2.3% |
[ 25.0% - 25.5% ] 25.12% | 3,308 | 6.5% |
[ 27.0% - 27.5% ] 27.16% | 4,834 | 1.2% |
[ 27.5% - 28.0% ] 27.52% | 46,457 | 4.7% |
[ 28.5% - 29.0% ] 28.57% | 4,858 | 11.6% |
[ 31.0% - 31.5% ] 31.29% | 46,398 | 5.2% |
[ 34.0% - 34.5% ] 34.25% | 5,317 | 4.7% |
[ 35.0% - 35.5% ] 35.30% | 4,842 | 5.2% |
[ 35.5% - 36.0% ] 35.82% | 8,943 | 6.1% |
[ 38.5% - 39.0% ] 38.63% | 1,504 | 11.5% |
[ 45.5% - 46.0% ] 45.53% | 3,817 | 4.6% |
[ 46.0% - 46.5% ] 46.35% | 21,672 | 4.7% |
[ 46.5% - 47.0% ] 46.82% | 22,454 | 4.6% |
[ 52.5% - 53.0% ] 52.68% | 16,651 | 8.3% |
[ 56.0% - 56.5% ] 56.43% | 8,855 | 2.5% |
[ 61.0% - 61.5% ] 61.48% | 610 | 0.78% |
[ 61.5% - 62.0% ] 61.69% | 2,665 | 3.6% |
[ 64.0% - 64.5% ] 64.27% | 10,785 | 2.5% |
[ 66.0% - 66.5% ] 66.44% | 1,612 | 2.1% |
[ 67.5% - 68.0% ] 67.80% | 1,938 | 19.3% |
[ 68.0% - 68.5% ] 68.13% | 5,600 | 1.6% |
[ 70.0% - 70.5% ] 70.24% | 1,482 | 1.1% |
[ 71.0% - 71.5% ] 71.50% | 1,607 | 2.5% |
[ 77.5% - 78.0% ] 77.65% | 4,345 | 7.4% |
[ 78.5% - 79.0% ] 78.79% | 11,154 | 4.5% |
[ 80.5% - 81.0% ] 80.57% | 211 | 8.9% |
[ 81.5% - 82.0% ] 81.80% | 445 | 1.9% |
[ 82.5% - 83.0% ] 82.74% | 2,653 | 0.97% |
[ 84.0% - 84.5% ] 84.30% | 8,372 | 5.1% |
[ 85.0% - 85.5% ] 85.03% | 2,945 | 2.0% |
[ 86.0% - 86.5% ] 86.35% | 967 | 4.6% |
[ 88.0% - 88.5% ] 88.28% | 435 | 6.5% |
[ 88.5% - 89.0% ] 88.55% | 3,888 | 2.2% |
[ 90.0% - 90.5% ] 90.16% | 1,453 | 6.4% |
[ 90.5% - 91.0% ] 90.84% | 7,875 | 5.4% |
[ 91.0% - 91.5% ] 91.07% | 8,275 | 2.8% |
[ 91.5% - 92.0% ] 91.71% | 5,184 | 3.8% |
[ 92.0% - 92.5% ] 92.32% | 8,246 | 2.8% |
[ 92.5% - 93.0% ] 92.75% | 15,036 | 2.8% |
[ 93.5% - 94.0% ] 93.88% | 3,480 | 2.4% |
[ 94.0% - 94.5% ] 94.20% | 26,776 | 2.7% |
[ 94.5% - 95.0% ] 94.64% | 5,209 | 17.8% |
[ 95.0% - 95.5% ] 95.27% | 5,434 | 4.7% |
[ 95.5% - 96.0% ] 95.72% | 4,489 | 6.0% |
[ 96.0% - 96.5% ] 96.27% | 5,901 | 2.5% |
[ 96.5% - 97.0% ] 96.69% | 11,912 | 2.7% |
[ 97.0% - 97.5% ] 97.33% | 974 | 12.2% |
[ 97.5% - 98.0% ] 97.87% | 8,580 | 6.8% |
[ 98.0% - 98.5% ] 98.33% | 3,235 | 4.2% |
[ 98.5% - 99.0% ] 98.93% | 4,123 | 3.8% |
[ 99.0% - 99.5% ] 99.30% | 10,389 | 4.5% |
[ 99.5% - 100.0% ] 100.00% | 4,575 | 6.2% |