Immigrants from Albania Disability Age 5 to 17
COMPARE
Immigrants from Albania
Select to Compare
Disability Age 5 to 17
Immigrants from Albania Disability Age 5 to 17
5.5%
DISABILITY | AGE 5 TO 17
83.1/ 100
METRIC RATING
147th/ 347
METRIC RANK
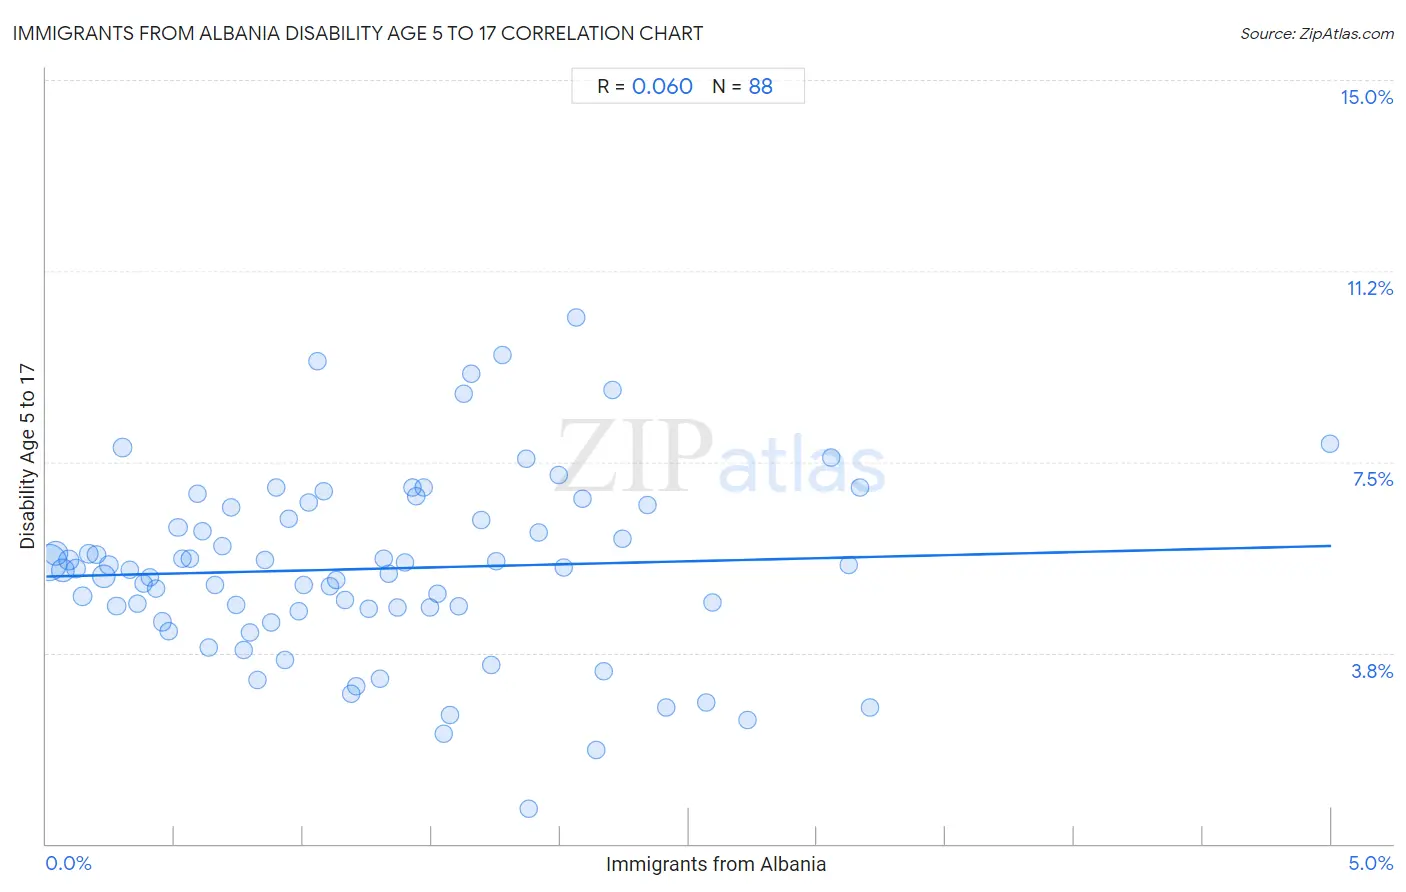
Immigrants from Albania Disability Age 5 to 17 Correlation Chart
The statistical analysis conducted on geographies consisting of 119,036,367 people shows a slight positive correlation between the proportion of Immigrants from Albania and percentage of population with a disability between the ages 5 and 17 in the United States with a correlation coefficient (R) of 0.060 and weighted average of 5.5%. On average, for every 1% (one percent) increase in Immigrants from Albania within a typical geography, there is an increase of 0.12% in percentage of population with a disability between the ages 5 and 17.
It is essential to understand that the correlation between the percentage of Immigrants from Albania and percentage of population with a disability between the ages 5 and 17 does not imply a direct cause-and-effect relationship. It remains uncertain whether the presence of Immigrants from Albania influences an upward or downward trend in the level of percentage of population with a disability between the ages 5 and 17 within an area, or if Immigrants from Albania simply ended up residing in those areas with higher or lower levels of percentage of population with a disability between the ages 5 and 17 due to other factors.
Demographics Similar to Immigrants from Albania by Disability Age 5 to 17
In terms of disability age 5 to 17, the demographic groups most similar to Immigrants from Albania are Albanian (5.5%, a difference of 0.060%), Samoan (5.5%, a difference of 0.10%), Central American (5.5%, a difference of 0.13%), Guatemalan (5.5%, a difference of 0.13%), and Estonian (5.5%, a difference of 0.20%).
| Demographics | Rating | Rank | Disability Age 5 to 17 |
| Immigrants from Netherlands | 90.5 /100 | #140 | Exceptional 5.4% |
| South American Indians | 89.3 /100 | #141 | Excellent 5.5% |
| Colombians | 88.0 /100 | #142 | Excellent 5.5% |
| Immigrants from Hungary | 87.9 /100 | #143 | Excellent 5.5% |
| Pakistanis | 87.3 /100 | #144 | Excellent 5.5% |
| Immigrants from Guatemala | 86.6 /100 | #145 | Excellent 5.5% |
| Albanians | 83.7 /100 | #146 | Excellent 5.5% |
| Immigrants from Albania | 83.1 /100 | #147 | Excellent 5.5% |
| Samoans | 81.9 /100 | #148 | Excellent 5.5% |
| Central Americans | 81.6 /100 | #149 | Excellent 5.5% |
| Guatemalans | 81.5 /100 | #150 | Excellent 5.5% |
| Estonians | 80.8 /100 | #151 | Excellent 5.5% |
| Ute | 80.6 /100 | #152 | Excellent 5.5% |
| Ecuadorians | 79.7 /100 | #153 | Good 5.5% |
| Australians | 78.8 /100 | #154 | Good 5.5% |
Immigrants from Albania Disability Age 5 to 17 Correlation Summary
| Measurement | Immigrants from Albania Data | Disability Age 5 to 17 Data |
| Minimum | 0.011% | 0.68% |
| Maximum | 5.0% | 10.3% |
| Range | 5.0% | 9.6% |
| Mean | 1.3% | 5.4% |
| Median | 1.1% | 5.4% |
| Interquartile 25% (IQ1) | 0.57% | 4.6% |
| Interquartile 75% (IQ3) | 1.8% | 6.5% |
| Interquartile Range (IQR) | 1.2% | 1.9% |
| Standard Deviation (Sample) | 0.90% | 1.8% |
| Standard Deviation (Population) | 0.90% | 1.8% |
Correlation Details
| Immigrants from Albania Percentile | Sample Size | Disability Age 5 to 17 |
[ 0.0% - 0.5% ] 0.011% | 44,367,163 | 5.5% |
[ 0.0% - 0.5% ] 0.038% | 16,933,688 | 5.7% |
[ 0.0% - 0.5% ] 0.065% | 10,234,005 | 5.4% |
[ 0.0% - 0.5% ] 0.089% | 5,661,140 | 5.6% |
[ 0.0% - 0.5% ] 0.12% | 3,957,356 | 5.4% |
[ 0.0% - 0.5% ] 0.14% | 2,751,642 | 4.9% |
[ 0.0% - 0.5% ] 0.17% | 2,838,842 | 5.7% |
[ 0.0% - 0.5% ] 0.19% | 1,851,177 | 5.7% |
[ 0.0% - 0.5% ] 0.23% | 11,531,470 | 5.3% |
[ 0.0% - 0.5% ] 0.25% | 2,497,678 | 5.5% |
[ 0.0% - 0.5% ] 0.27% | 1,048,558 | 4.7% |
[ 0.0% - 0.5% ] 0.30% | 2,782,211 | 7.8% |
[ 0.0% - 0.5% ] 0.33% | 980,486 | 5.4% |
[ 0.0% - 0.5% ] 0.35% | 339,944 | 4.7% |
[ 0.0% - 0.5% ] 0.38% | 946,611 | 5.1% |
[ 0.0% - 0.5% ] 0.40% | 681,610 | 5.2% |
[ 0.0% - 0.5% ] 0.43% | 842,172 | 5.0% |
[ 0.0% - 0.5% ] 0.45% | 452,083 | 4.4% |
[ 0.0% - 0.5% ] 0.48% | 176,218 | 4.2% |
[ 0.5% - 1.0% ] 0.51% | 348,431 | 6.2% |
[ 0.5% - 1.0% ] 0.53% | 379,678 | 5.6% |
[ 0.5% - 1.0% ] 0.56% | 376,970 | 5.6% |
[ 0.5% - 1.0% ] 0.59% | 136,995 | 6.9% |
[ 0.5% - 1.0% ] 0.61% | 168,564 | 6.1% |
[ 0.5% - 1.0% ] 0.63% | 126,024 | 3.9% |
[ 0.5% - 1.0% ] 0.66% | 196,968 | 5.1% |
[ 0.5% - 1.0% ] 0.69% | 599,008 | 5.8% |
[ 0.5% - 1.0% ] 0.72% | 506,935 | 6.6% |
[ 0.5% - 1.0% ] 0.74% | 371,836 | 4.7% |
[ 0.5% - 1.0% ] 0.77% | 130,008 | 3.8% |
[ 0.5% - 1.0% ] 0.79% | 229,641 | 4.1% |
[ 0.5% - 1.0% ] 0.82% | 156,645 | 3.2% |
[ 0.5% - 1.0% ] 0.85% | 184,090 | 5.6% |
[ 0.5% - 1.0% ] 0.88% | 299,326 | 4.4% |
[ 0.5% - 1.0% ] 0.90% | 129,055 | 7.0% |
[ 0.5% - 1.0% ] 0.93% | 164,560 | 3.6% |
[ 0.5% - 1.0% ] 0.94% | 44,196 | 6.4% |
[ 0.5% - 1.0% ] 0.98% | 122,245 | 4.6% |
[ 0.5% - 1.0% ] 1.00% | 168,652 | 5.1% |
[ 1.0% - 1.5% ] 1.02% | 110,301 | 6.7% |
[ 1.0% - 1.5% ] 1.06% | 157,605 | 9.5% |
[ 1.0% - 1.5% ] 1.08% | 66,165 | 6.9% |
[ 1.0% - 1.5% ] 1.11% | 175,342 | 5.1% |
[ 1.0% - 1.5% ] 1.13% | 125,720 | 5.2% |
[ 1.0% - 1.5% ] 1.16% | 121,242 | 4.8% |
[ 1.0% - 1.5% ] 1.19% | 92,104 | 2.9% |
[ 1.0% - 1.5% ] 1.21% | 86,266 | 3.1% |
[ 1.0% - 1.5% ] 1.25% | 63,787 | 4.6% |
[ 1.0% - 1.5% ] 1.30% | 26,488 | 3.3% |
[ 1.0% - 1.5% ] 1.31% | 83,752 | 5.6% |
[ 1.0% - 1.5% ] 1.33% | 43,682 | 5.3% |
[ 1.0% - 1.5% ] 1.37% | 55,344 | 4.6% |
[ 1.0% - 1.5% ] 1.39% | 175,179 | 5.5% |
[ 1.0% - 1.5% ] 1.42% | 146,188 | 7.0% |
[ 1.0% - 1.5% ] 1.44% | 204,191 | 6.8% |
[ 1.0% - 1.5% ] 1.47% | 100,388 | 7.0% |
[ 1.0% - 1.5% ] 1.49% | 211,068 | 4.6% |
[ 1.5% - 2.0% ] 1.52% | 69,521 | 4.9% |
[ 1.5% - 2.0% ] 1.54% | 40,203 | 2.2% |
[ 1.5% - 2.0% ] 1.57% | 91,687 | 2.5% |
[ 1.5% - 2.0% ] 1.60% | 35,211 | 4.7% |
[ 1.5% - 2.0% ] 1.62% | 41,356 | 8.8% |
[ 1.5% - 2.0% ] 1.65% | 16,695 | 9.2% |
[ 1.5% - 2.0% ] 1.69% | 40,254 | 6.4% |
[ 1.5% - 2.0% ] 1.73% | 92,572 | 3.5% |
[ 1.5% - 2.0% ] 1.75% | 55,127 | 5.5% |
[ 1.5% - 2.0% ] 1.78% | 61,164 | 9.6% |
[ 1.5% - 2.0% ] 1.87% | 23,256 | 7.6% |
[ 1.5% - 2.0% ] 1.88% | 5,325 | 0.68% |
[ 1.5% - 2.0% ] 1.92% | 108,261 | 6.1% |
[ 1.5% - 2.0% ] 1.99% | 66,150 | 7.3% |
[ 2.0% - 2.5% ] 2.01% | 15,810 | 5.4% |
[ 2.0% - 2.5% ] 2.06% | 21,723 | 10.3% |
[ 2.0% - 2.5% ] 2.09% | 44,921 | 6.8% |
[ 2.0% - 2.5% ] 2.14% | 60,883 | 1.8% |
[ 2.0% - 2.5% ] 2.17% | 105,521 | 3.4% |
[ 2.0% - 2.5% ] 2.20% | 28,248 | 8.9% |
[ 2.0% - 2.5% ] 2.24% | 23,540 | 6.0% |
[ 2.0% - 2.5% ] 2.34% | 20,678 | 6.7% |
[ 2.0% - 2.5% ] 2.41% | 9,826 | 2.7% |
[ 2.5% - 3.0% ] 2.57% | 3,700 | 2.8% |
[ 2.5% - 3.0% ] 2.59% | 84,827 | 4.7% |
[ 2.5% - 3.0% ] 2.73% | 9,387 | 2.4% |
[ 3.0% - 3.5% ] 3.06% | 29,215 | 7.6% |
[ 3.0% - 3.5% ] 3.12% | 38,062 | 5.5% |
[ 3.0% - 3.5% ] 3.17% | 695 | 7.0% |
[ 3.0% - 3.5% ] 3.21% | 7,987 | 2.7% |
[ 4.5% - 5.0% ] 4.99% | 25,869 | 7.9% |