Menominee Disability Age 5 to 17

COMPARE

Menominee
Race
Ancestry
AfghanAfricanAlaska NativeAlaskan AthabascanAlbanianAleutAlsatianAmericanApacheArabArapahoArgentineanArmenianAssyrian/Chaldean/SyriacAustralianAustrianBahamianBangladeshiBarbadianBasqueBelgianBelizeanBermudanBhutaneseBlackfeetBolivianBrazilianBritishBritish West IndianBulgarianBurmeseCajunCambodianCanadianCape VerdeanCarpatho RusynCelticCentral AmericanCentral American IndianCherokeeCheyenneChickasawChileanChineseChippewaChoctawColombianColvilleComancheCosta RicanCreeCreekCroatianCrowCubanCypriotCzechCzechoslovakianDanishDelawareDominicanDutchDutch West IndianEastern EuropeanEcuadorianEgyptianEnglishEstonianEthiopianEuropeanFijianFilipinoFinnishFrenchFrench American IndianFrench CanadianGermanGerman RussianGhanaianGreekGuamanian/ChamorroGuatemalanGuyaneseHaitianHmongHonduranHopiHoumaHungarianIcelanderIndian (Asian)IndonesianInupiatIranianIraqiIrishIroquoisIsraeliItalianJamaicanJapaneseJordanianKenyanKiowaKoreanLaotianLatvianLebaneseLiberianLithuanianLumbeeLuxembourgerMacedonianMalaysianMalteseMarshalleseMenomineeMexicanMexican American IndianMongolianMoroccanNative HawaiianNavajoNepaleseNew ZealanderNicaraguanNigerianNorthern EuropeanNorwegianOkinawanOsageOttawaPaiutePakistaniPalestinianPanamanianParaguayanPennsylvania GermanPeruvianPimaPolishPortuguesePotawatomiPuebloPuerto RicanPuget Sound SalishRomanianRussianSalvadoranSamoanScandinavianScotch-IrishScottishSeminoleSenegaleseSerbianShoshoneSierra LeoneanSiouxSlavicSlovakSloveneSomaliSouth AfricanSouth AmericanSouth American IndianSoviet UnionSpaniardSpanishSpanish AmericanSpanish American IndianSri LankanSubsaharan AfricanSudaneseSwedishSwissSyrianTaiwaneseThaiTlingit-HaidaTohono O'OdhamTonganTrinidadian and TobagonianTsimshianTurkishU.S. Virgin IslanderUgandanUkrainianUruguayanUteVenezuelanVietnameseWelshWest IndianYakamaYaquiYugoslavianYumanYup'ikZimbabwean
Immigration
NonimmigrantsImmigrantsAfghanistanAfricaAlbaniaArgentinaArmeniaAsiaAustraliaAustriaBahamasBangladeshBarbadosBelarusBelgiumBelizeBoliviaBosnia and HerzegovinaBrazilBulgariaBurma/MyanmarCabo VerdeCambodiaCameroonCanadaCaribbeanCentral AmericaChileChinaColombiaCongoCosta RicaCroatiaCubaCzechoslovakiaDenmarkDominicaDominican RepublicEastern AfricaEastern AsiaEastern EuropeEcuadorEgyptEl SalvadorEnglandEritreaEthiopiaEuropeFijiFranceGermanyGhanaGreeceGrenadaGuatemalaGuyanaHaitiHondurasHong KongHungaryIndiaIndonesiaIranIraqIrelandIsraelItalyJamaicaJapanJordanKazakhstanKenyaKoreaKuwaitLaosLatin AmericaLatviaLebanonLiberiaLithuaniaMalaysiaMexicoMicronesiaMiddle AfricaMoldovaMoroccoNepalNetherlandsNicaraguaNigeriaNorth AmericaNorth MacedoniaNorthern AfricaNorthern EuropeNorwayOceaniaPakistanPanamaPeruPhilippinesPolandPortugalRomaniaRussiaSaudi ArabiaScotlandSenegalSerbiaSierra LeoneSingaporeSomaliaSouth AfricaSouth AmericaSouth Central AsiaSouth Eastern AsiaSouthern EuropeSpainSri LankaSt. Vincent and the GrenadinesSudanSwedenSwitzerlandSyriaTaiwanThailandTrinidad and TobagoTurkeyUgandaUkraineUruguayUzbekistanVenezuelaVietnamWest IndiesWestern AfricaWestern AsiaWestern EuropeYemenZaireZimbabweAzores
Select to Compare
Race
Ancestry
AfghanAfricanAlaska NativeAlaskan AthabascanAlbanianAleutAlsatianAmericanApacheArabArapahoArgentineanArmenianAssyrian/Chaldean/SyriacAustralianAustrianBahamianBangladeshiBarbadianBasqueBelgianBelizeanBermudanBhutaneseBlackfeetBolivianBrazilianBritishBritish West IndianBulgarianBurmeseCajunCambodianCanadianCape VerdeanCarpatho RusynCelticCentral AmericanCentral American IndianCherokeeCheyenneChickasawChileanChineseChippewaChoctawColombianColvilleComancheCosta RicanCreeCreekCroatianCrowCubanCypriotCzechCzechoslovakianDanishDelawareDominicanDutchDutch West IndianEastern EuropeanEcuadorianEgyptianEnglishEstonianEthiopianEuropeanFijianFilipinoFinnishFrenchFrench American IndianFrench CanadianGermanGerman RussianGhanaianGreekGuamanian/ChamorroGuatemalanGuyaneseHaitianHmongHonduranHopiHoumaHungarianIcelanderIndian (Asian)IndonesianInupiatIranianIraqiIrishIroquoisIsraeliItalianJamaicanJapaneseJordanianKenyanKiowaKoreanLaotianLatvianLebaneseLiberianLithuanianLumbeeLuxembourgerMacedonianMalaysianMalteseMarshalleseMexicanMexican American IndianMongolianMoroccanNative HawaiianNavajoNepaleseNew ZealanderNicaraguanNigerianNorthern EuropeanNorwegianOkinawanOsageOttawaPaiutePakistaniPalestinianPanamanianParaguayanPennsylvania GermanPeruvianPimaPolishPortuguesePotawatomiPuebloPuerto RicanPuget Sound SalishRomanianRussianSalvadoranSamoanScandinavianScotch-IrishScottishSeminoleSenegaleseSerbianShoshoneSierra LeoneanSiouxSlavicSlovakSloveneSomaliSouth AfricanSouth AmericanSouth American IndianSoviet UnionSpaniardSpanishSpanish AmericanSpanish American IndianSri LankanSubsaharan AfricanSudaneseSwedishSwissSyrianTaiwaneseThaiTlingit-HaidaTohono O'OdhamTonganTrinidadian and TobagonianTsimshianTurkishU.S. Virgin IslanderUgandanUkrainianUruguayanUteVenezuelanVietnameseWelshWest IndianYakamaYaquiYugoslavianYumanYup'ikZimbabwean
Immigration
NonimmigrantsImmigrantsAfghanistanAfricaAlbaniaArgentinaArmeniaAsiaAustraliaAustriaBahamasBangladeshBarbadosBelarusBelgiumBelizeBoliviaBosnia and HerzegovinaBrazilBulgariaBurma/MyanmarCabo VerdeCambodiaCameroonCanadaCaribbeanCentral AmericaChileChinaColombiaCongoCosta RicaCroatiaCubaCzechoslovakiaDenmarkDominicaDominican RepublicEastern AfricaEastern AsiaEastern EuropeEcuadorEgyptEl SalvadorEnglandEritreaEthiopiaEuropeFijiFranceGermanyGhanaGreeceGrenadaGuatemalaGuyanaHaitiHondurasHong KongHungaryIndiaIndonesiaIranIraqIrelandIsraelItalyJamaicaJapanJordanKazakhstanKenyaKoreaKuwaitLaosLatin AmericaLatviaLebanonLiberiaLithuaniaMalaysiaMexicoMicronesiaMiddle AfricaMoldovaMoroccoNepalNetherlandsNicaraguaNigeriaNorth AmericaNorth MacedoniaNorthern AfricaNorthern EuropeNorwayOceaniaPakistanPanamaPeruPhilippinesPolandPortugalRomaniaRussiaSaudi ArabiaScotlandSenegalSerbiaSierra LeoneSingaporeSomaliaSouth AfricaSouth AmericaSouth Central AsiaSouth Eastern AsiaSouthern EuropeSpainSri LankaSt. Vincent and the GrenadinesSudanSwedenSwitzerlandSyriaTaiwanThailandTrinidad and TobagoTurkeyUgandaUkraineUruguayUzbekistanVenezuelaVietnamWest IndiesWestern AfricaWestern AsiaWestern EuropeYemenZaireZimbabweAzores
Disability Age 5 to 17
Income
Poverty
Unemployment
Labor Participation
Family Structure
Vehicle Availability
Education Level
Disability

Menominee Disability Age 5 to 17
Exceptional

5.3%
DISABILITY | AGE 5 TO 17
98.7/ 100
METRIC RATING
101st/ 347
METRIC RANK

Menominee Disability Age 5 to 17 Correlation Chart

The statistical analysis conducted on geographies consisting of 45,659,634 people shows a weak negative correlation between the proportion of Menominee and percentage of population with a disability between the ages 5 and 17 in the United States with a correlation coefficient (R) of -0.212 and weighted average of 5.3%. On average, for every 1% (one percent) increase in Menominee within a typical geography, there is a decrease of 0.019% in percentage of population with a disability between the ages 5 and 17.
Menominee Disability Age 5 to 17
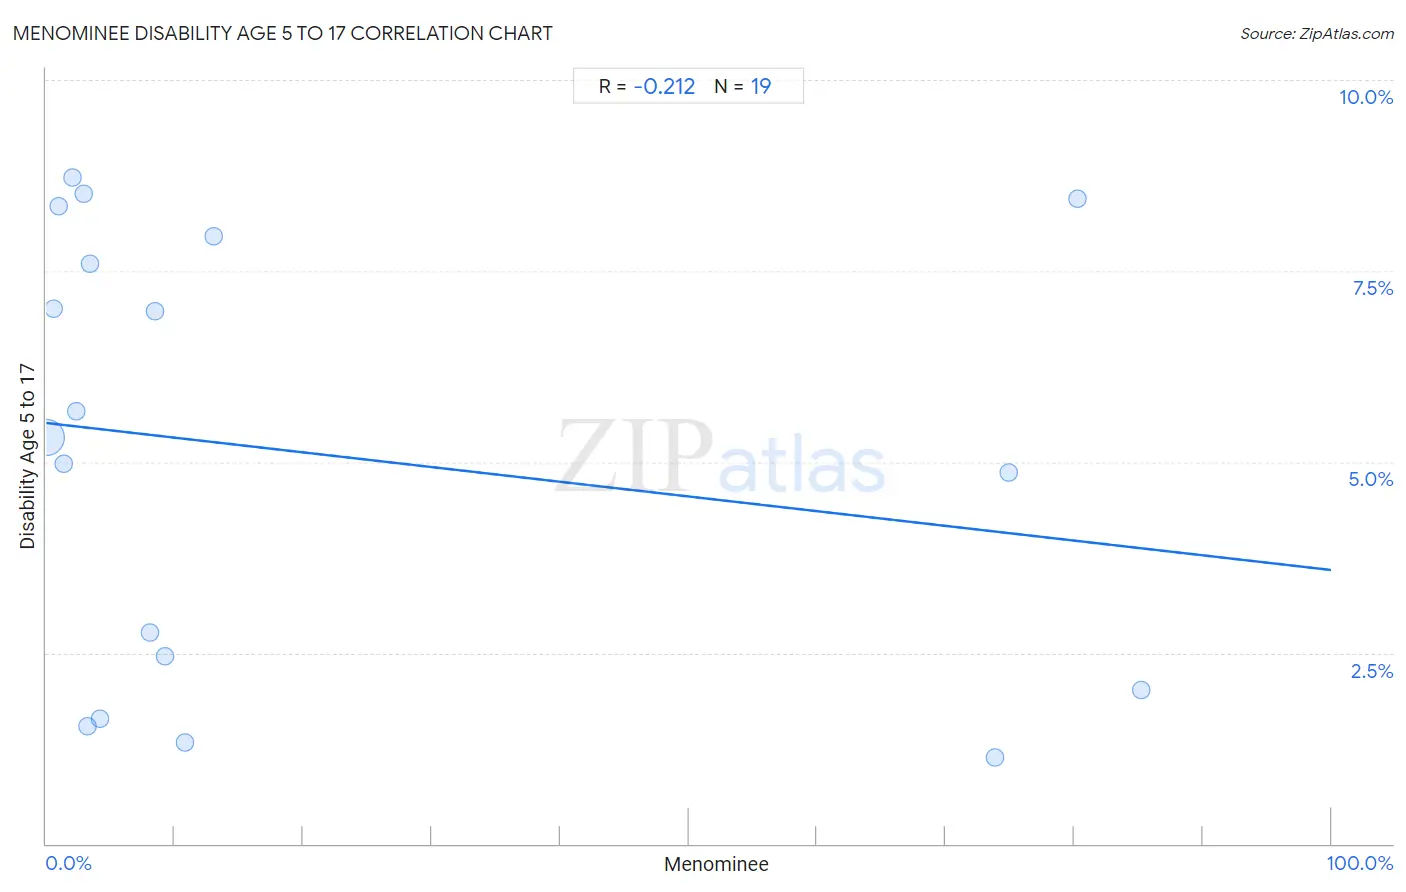
It is essential to understand that the correlation between the percentage of Menominee and percentage of population with a disability between the ages 5 and 17 does not imply a direct cause-and-effect relationship. It remains uncertain whether the presence of Menominee influences an upward or downward trend in the level of percentage of population with a disability between the ages 5 and 17 within an area, or if Menominee simply ended up residing in those areas with higher or lower levels of percentage of population with a disability between the ages 5 and 17 due to other factors.

Demographics Similar to Menominee by Disability Age 5 to 17

In terms of disability age 5 to 17, the demographic groups most similar to Menominee are Nepalese (5.3%, a difference of 0.020%), Nicaraguan (5.3%, a difference of 0.080%), Salvadoran (5.3%, a difference of 0.11%), Cambodian (5.3%, a difference of 0.18%), and Peruvian (5.3%, a difference of 0.18%).
DemographicsRating | RankDisability Age 5 to 17
Immigrants from Jordan
99.1
/100
|
#94
Exceptional
5.3%
Immigrants from Grenada
99.1
/100
|
#95
Exceptional
5.3%
Immigrants from El Salvador
99.0
/100
|
#96
Exceptional
5.3%
Immigrants from Europe
99.0
/100
|
#97
Exceptional
5.3%
Immigrants from Austria
98.9
/100
|
#98
Exceptional
5.3%
Cambodians
98.8
/100
|
#99
Exceptional
5.3%
Nepalese
98.7
/100
|
#100
Exceptional
5.3%
Menominee
98.7
/100
|
#101
Exceptional
5.3%
Nicaraguans
98.6
/100
|
#102
Exceptional
5.3%
Salvadorans
98.6
/100
|
#103
Exceptional
5.3%
Peruvians
98.5
/100
|
#104
Exceptional
5.3%
Immigrants from Italy
98.4
/100
|
#105
Exceptional
5.3%
Immigrants from Yemen
98.2
/100
|
#106
Exceptional
5.3%
Russians
98.2
/100
|
#107
Exceptional
5.3%
Immigrants from South Africa
98.1
/100
|
#108
Exceptional
5.3%

Menominee Disability Age 5 to 17 Correlation Summary

MeasurementMenominee DataDisability Age 5 to 17 Data
Minimum0.022%1.1%
Maximum85.2%8.7%
Range85.2%7.6%
Mean20.3%5.1%
Median4.2%5.3%
Interquartile 25% (IQ1)2.0%2.0%
Interquartile 75% (IQ3)13.0%8.0%
Interquartile Range (IQR)11.0%5.9%
Standard Deviation (Sample)31.2%2.8%
Standard Deviation (Population)30.4%2.8%

Correlation Details

Menominee PercentileSample SizeDisability Age 5 to 17
[
0.0%
-
0.5%
]
0.022%
45,166,1215.3%
[
0.5%
-
1.0%
]
0.57%
266,6037.0%
[
0.5%
-
1.0%
]
1.00%
149,1858.4%
[
1.0%
-
1.5%
]
1.38%
26,2255.0%
[
2.0%
-
2.5%
]
2.02%
4,5448.7%
[
2.0%
-
2.5%
]
2.35%
1,3625.7%
[
2.5%
-
3.0%
]
2.89%
4,0458.5%
[
3.0%
-
3.5%
]
3.19%
3,0691.5%
[
3.0%
-
3.5%
]
3.42%
1,7557.6%
[
4.0%
-
4.5%
]
4.22%
5211.6%
[
8.0%
-
8.5%
]
8.04%
1,6052.8%
[
8.0%
-
8.5%
]
8.48%
16,6577.0%
[
9.0%
-
9.5%
]
9.28%
2,1012.5%
[
10.5%
-
11.0%
]
10.77%
2971.3%
[
13.0%
-
13.5%
]
13.05%
9,2128.0%
[
73.5%
-
74.0%
]
73.86%
3,0531.1%
[
74.5%
-
75.0%
]
74.87%
1,1704.9%
[
80.0%
-
80.5%
]
80.29%
6858.5%
[
85.0%
-
85.5%
]
85.18%
1,4242.0%