Immigrants from Germany Disability Age 5 to 17
COMPARE
Immigrants from Germany
Select to Compare
Disability Age 5 to 17
Immigrants from Germany Disability Age 5 to 17
5.9%
DISABILITY | AGE 5 TO 17
1.9/ 100
METRIC RATING
244th/ 347
METRIC RANK
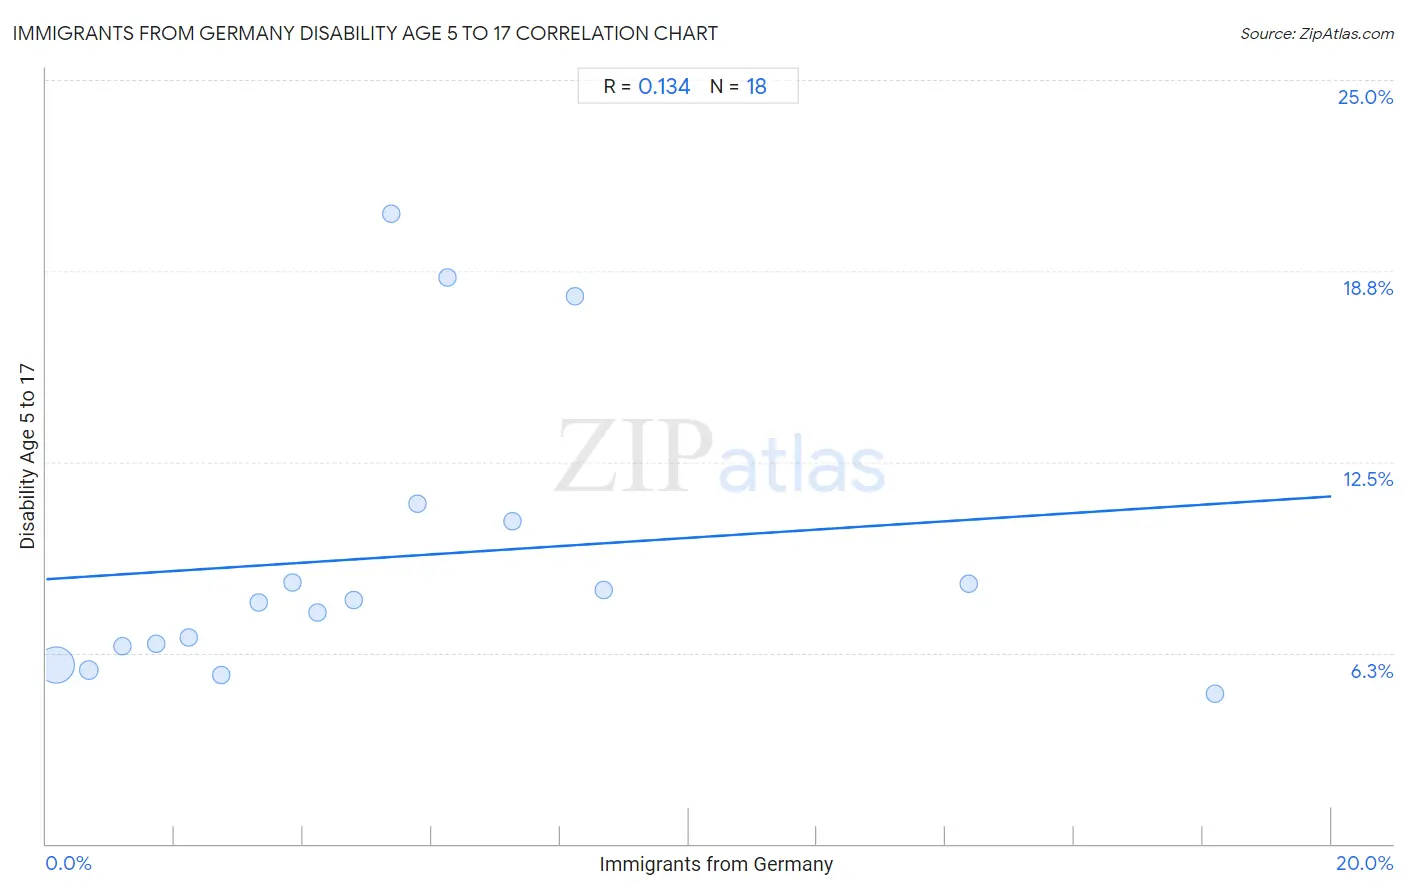
Immigrants from Germany Disability Age 5 to 17 Correlation Chart
The statistical analysis conducted on geographies consisting of 458,518,539 people shows a poor positive correlation between the proportion of Immigrants from Germany and percentage of population with a disability between the ages 5 and 17 in the United States with a correlation coefficient (R) of 0.134 and weighted average of 5.9%. On average, for every 1% (one percent) increase in Immigrants from Germany within a typical geography, there is an increase of 0.14% in percentage of population with a disability between the ages 5 and 17.
It is essential to understand that the correlation between the percentage of Immigrants from Germany and percentage of population with a disability between the ages 5 and 17 does not imply a direct cause-and-effect relationship. It remains uncertain whether the presence of Immigrants from Germany influences an upward or downward trend in the level of percentage of population with a disability between the ages 5 and 17 within an area, or if Immigrants from Germany simply ended up residing in those areas with higher or lower levels of percentage of population with a disability between the ages 5 and 17 due to other factors.
Demographics Similar to Immigrants from Germany by Disability Age 5 to 17
In terms of disability age 5 to 17, the demographic groups most similar to Immigrants from Germany are Immigrants from Micronesia (5.9%, a difference of 0.0%), Tlingit-Haida (5.9%, a difference of 0.0%), Immigrants from Honduras (5.9%, a difference of 0.030%), Indonesian (5.9%, a difference of 0.060%), and Spaniard (5.9%, a difference of 0.070%).
| Demographics | Rating | Rank | Disability Age 5 to 17 |
| Sudanese | 2.9 /100 | #237 | Tragic 5.8% |
| Hungarians | 2.6 /100 | #238 | Tragic 5.8% |
| German Russians | 2.4 /100 | #239 | Tragic 5.9% |
| West Indians | 2.4 /100 | #240 | Tragic 5.9% |
| Immigrants from Caribbean | 2.1 /100 | #241 | Tragic 5.9% |
| Spaniards | 2.0 /100 | #242 | Tragic 5.9% |
| Indonesians | 2.0 /100 | #243 | Tragic 5.9% |
| Immigrants from Germany | 1.9 /100 | #244 | Tragic 5.9% |
| Immigrants from Micronesia | 1.9 /100 | #245 | Tragic 5.9% |
| Tlingit-Haida | 1.9 /100 | #246 | Tragic 5.9% |
| Immigrants from Honduras | 1.8 /100 | #247 | Tragic 5.9% |
| British | 1.7 /100 | #248 | Tragic 5.9% |
| Immigrants from Ghana | 1.7 /100 | #249 | Tragic 5.9% |
| Poles | 1.5 /100 | #250 | Tragic 5.9% |
| Immigrants from Cambodia | 1.5 /100 | #251 | Tragic 5.9% |
Immigrants from Germany Disability Age 5 to 17 Correlation Summary
| Measurement | Immigrants from Germany Data | Disability Age 5 to 17 Data |
| Minimum | 0.16% | 4.9% |
| Maximum | 18.2% | 20.6% |
| Range | 18.0% | 15.7% |
| Mean | 5.5% | 9.4% |
| Median | 4.5% | 7.9% |
| Interquartile 25% (IQ1) | 2.2% | 6.5% |
| Interquartile 75% (IQ3) | 7.3% | 10.5% |
| Interquartile Range (IQR) | 5.0% | 4.1% |
| Standard Deviation (Sample) | 4.7% | 4.7% |
| Standard Deviation (Population) | 4.6% | 4.6% |
Correlation Details
| Immigrants from Germany Percentile | Sample Size | Disability Age 5 to 17 |
[ 0.0% - 0.5% ] 0.16% | 428,261,039 | 5.8% |
[ 0.5% - 1.0% ] 0.66% | 25,825,251 | 5.7% |
[ 1.0% - 1.5% ] 1.18% | 3,154,649 | 6.5% |
[ 1.5% - 2.0% ] 1.72% | 754,798 | 6.6% |
[ 2.0% - 2.5% ] 2.22% | 263,443 | 6.8% |
[ 2.5% - 3.0% ] 2.72% | 129,419 | 5.5% |
[ 3.0% - 3.5% ] 3.31% | 62,125 | 7.9% |
[ 3.5% - 4.0% ] 3.83% | 22,910 | 8.6% |
[ 4.0% - 4.5% ] 4.22% | 19,728 | 7.6% |
[ 4.5% - 5.0% ] 4.79% | 7,771 | 8.0% |
[ 5.0% - 5.5% ] 5.37% | 6,315 | 20.6% |
[ 5.5% - 6.0% ] 5.78% | 277 | 11.1% |
[ 6.0% - 6.5% ] 6.25% | 2,111 | 18.5% |
[ 7.0% - 7.5% ] 7.26% | 4,779 | 10.5% |
[ 8.0% - 8.5% ] 8.22% | 888 | 17.9% |
[ 8.5% - 9.0% ] 8.68% | 2,004 | 8.3% |
[ 14.0% - 14.5% ] 14.36% | 202 | 8.5% |
[ 18.0% - 18.5% ] 18.19% | 830 | 4.9% |