Immigrants from Greece Disability Age 5 to 17
COMPARE
Immigrants from Greece
Select to Compare
Disability Age 5 to 17
Immigrants from Greece Disability Age 5 to 17
5.2%
DISABILITY | AGE 5 TO 17
99.8/ 100
METRIC RATING
65th/ 347
METRIC RANK
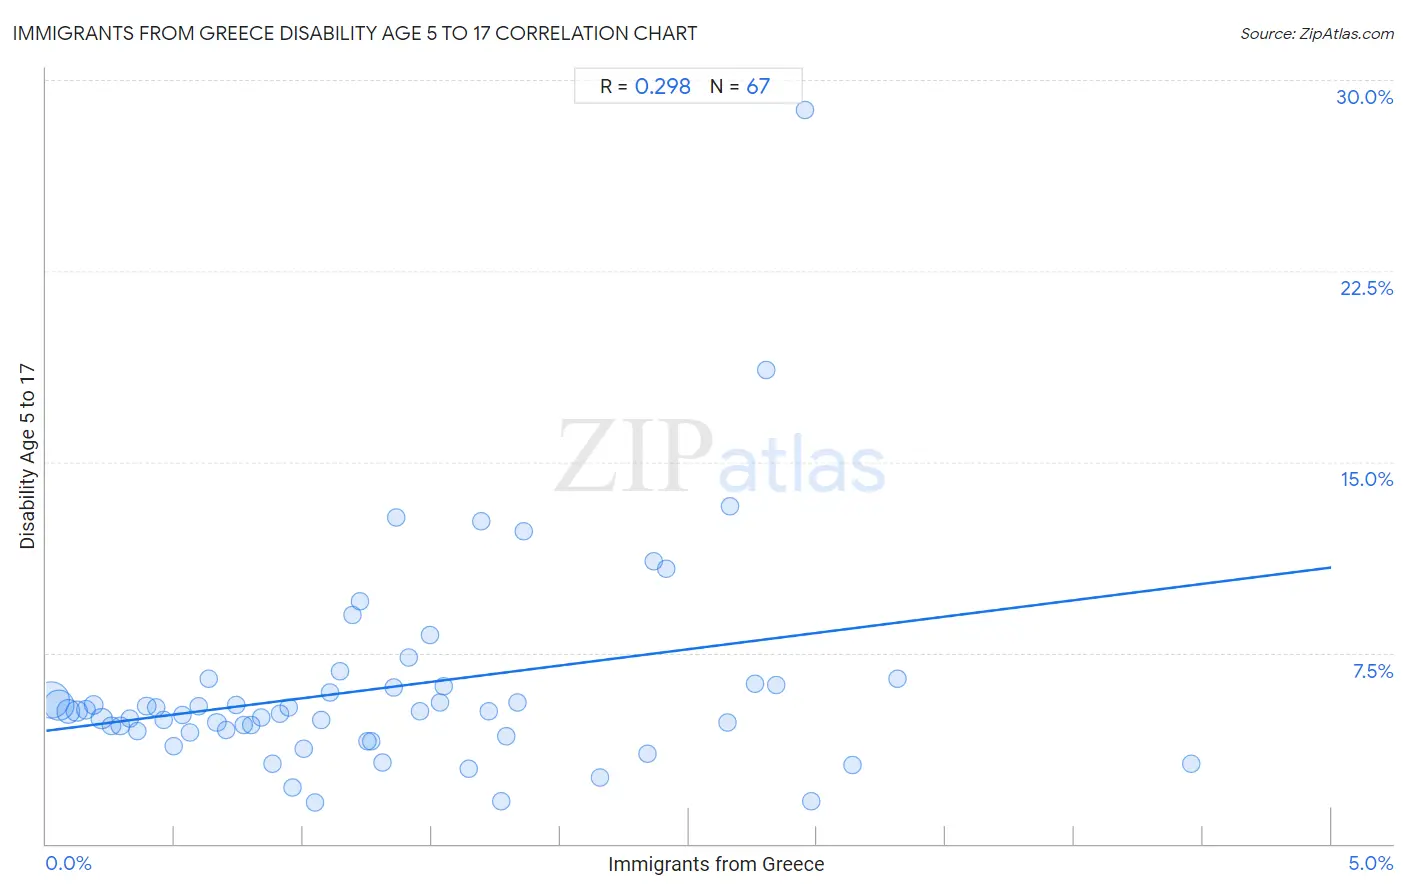
Immigrants from Greece Disability Age 5 to 17 Correlation Chart
The statistical analysis conducted on geographies consisting of 215,473,396 people shows a weak positive correlation between the proportion of Immigrants from Greece and percentage of population with a disability between the ages 5 and 17 in the United States with a correlation coefficient (R) of 0.298 and weighted average of 5.2%. On average, for every 1% (one percent) increase in Immigrants from Greece within a typical geography, there is an increase of 1.3% in percentage of population with a disability between the ages 5 and 17.
It is essential to understand that the correlation between the percentage of Immigrants from Greece and percentage of population with a disability between the ages 5 and 17 does not imply a direct cause-and-effect relationship. It remains uncertain whether the presence of Immigrants from Greece influences an upward or downward trend in the level of percentage of population with a disability between the ages 5 and 17 within an area, or if Immigrants from Greece simply ended up residing in those areas with higher or lower levels of percentage of population with a disability between the ages 5 and 17 due to other factors.
Demographics Similar to Immigrants from Greece by Disability Age 5 to 17
In terms of disability age 5 to 17, the demographic groups most similar to Immigrants from Greece are Immigrants from South Eastern Asia (5.2%, a difference of 0.010%), Immigrants from Bangladesh (5.2%, a difference of 0.040%), Palestinian (5.2%, a difference of 0.040%), Macedonian (5.2%, a difference of 0.070%), and Immigrants from Ireland (5.2%, a difference of 0.15%).
| Demographics | Rating | Rank | Disability Age 5 to 17 |
| Immigrants from Ukraine | 99.9 /100 | #58 | Exceptional 5.1% |
| Immigrants from North Macedonia | 99.9 /100 | #59 | Exceptional 5.1% |
| Immigrants from Eastern Europe | 99.9 /100 | #60 | Exceptional 5.1% |
| Immigrants from Switzerland | 99.8 /100 | #61 | Exceptional 5.2% |
| Immigrants from Ireland | 99.8 /100 | #62 | Exceptional 5.2% |
| Immigrants from Bangladesh | 99.8 /100 | #63 | Exceptional 5.2% |
| Immigrants from South Eastern Asia | 99.8 /100 | #64 | Exceptional 5.2% |
| Immigrants from Greece | 99.8 /100 | #65 | Exceptional 5.2% |
| Palestinians | 99.8 /100 | #66 | Exceptional 5.2% |
| Macedonians | 99.8 /100 | #67 | Exceptional 5.2% |
| Immigrants from Syria | 99.7 /100 | #68 | Exceptional 5.2% |
| Guyanese | 99.7 /100 | #69 | Exceptional 5.2% |
| Immigrants from Belgium | 99.7 /100 | #70 | Exceptional 5.2% |
| Jordanians | 99.7 /100 | #71 | Exceptional 5.2% |
| Immigrants from Vietnam | 99.7 /100 | #72 | Exceptional 5.2% |
Immigrants from Greece Disability Age 5 to 17 Correlation Summary
| Measurement | Immigrants from Greece Data | Disability Age 5 to 17 Data |
| Minimum | 0.018% | 1.6% |
| Maximum | 4.5% | 28.8% |
| Range | 4.4% | 27.2% |
| Mean | 1.3% | 6.1% |
| Median | 1.1% | 5.2% |
| Interquartile 25% (IQ1) | 0.56% | 4.4% |
| Interquartile 75% (IQ3) | 1.8% | 6.2% |
| Interquartile Range (IQR) | 1.2% | 1.9% |
| Standard Deviation (Sample) | 0.96% | 4.1% |
| Standard Deviation (Population) | 0.95% | 4.1% |
Correlation Details
| Immigrants from Greece Percentile | Sample Size | Disability Age 5 to 17 |
[ 0.0% - 0.5% ] 0.018% | 81,409,705 | 5.7% |
[ 0.0% - 0.5% ] 0.048% | 52,590,022 | 5.4% |
[ 0.0% - 0.5% ] 0.085% | 25,490,449 | 5.2% |
[ 0.0% - 0.5% ] 0.12% | 11,810,567 | 5.2% |
[ 0.0% - 0.5% ] 0.15% | 7,866,257 | 5.3% |
[ 0.0% - 0.5% ] 0.19% | 6,132,294 | 5.5% |
[ 0.0% - 0.5% ] 0.22% | 12,498,256 | 4.9% |
[ 0.0% - 0.5% ] 0.25% | 3,472,626 | 4.6% |
[ 0.0% - 0.5% ] 0.29% | 2,726,593 | 4.6% |
[ 0.0% - 0.5% ] 0.33% | 1,478,911 | 4.9% |
[ 0.0% - 0.5% ] 0.36% | 1,243,693 | 4.4% |
[ 0.0% - 0.5% ] 0.39% | 1,450,389 | 5.4% |
[ 0.0% - 0.5% ] 0.43% | 843,654 | 5.3% |
[ 0.0% - 0.5% ] 0.46% | 738,564 | 4.9% |
[ 0.0% - 0.5% ] 0.50% | 486,078 | 3.9% |
[ 0.5% - 1.0% ] 0.53% | 566,078 | 5.1% |
[ 0.5% - 1.0% ] 0.56% | 567,402 | 4.4% |
[ 0.5% - 1.0% ] 0.59% | 388,012 | 5.4% |
[ 0.5% - 1.0% ] 0.63% | 227,183 | 6.5% |
[ 0.5% - 1.0% ] 0.66% | 315,113 | 4.8% |
[ 0.5% - 1.0% ] 0.70% | 391,530 | 4.5% |
[ 0.5% - 1.0% ] 0.74% | 424,308 | 5.4% |
[ 0.5% - 1.0% ] 0.77% | 253,277 | 4.7% |
[ 0.5% - 1.0% ] 0.80% | 186,803 | 4.7% |
[ 0.5% - 1.0% ] 0.84% | 93,444 | 5.0% |
[ 0.5% - 1.0% ] 0.88% | 94,476 | 3.1% |
[ 0.5% - 1.0% ] 0.91% | 328,180 | 5.1% |
[ 0.5% - 1.0% ] 0.94% | 127,498 | 5.3% |
[ 0.5% - 1.0% ] 0.96% | 64,725 | 2.2% |
[ 1.0% - 1.5% ] 1.00% | 75,073 | 3.8% |
[ 1.0% - 1.5% ] 1.05% | 39,931 | 1.6% |
[ 1.0% - 1.5% ] 1.07% | 190,184 | 4.9% |
[ 1.0% - 1.5% ] 1.11% | 66,304 | 5.9% |
[ 1.0% - 1.5% ] 1.14% | 44,309 | 6.8% |
[ 1.0% - 1.5% ] 1.19% | 22,778 | 9.0% |
[ 1.0% - 1.5% ] 1.22% | 14,578 | 9.5% |
[ 1.0% - 1.5% ] 1.25% | 147,609 | 4.0% |
[ 1.0% - 1.5% ] 1.26% | 16,386 | 4.0% |
[ 1.0% - 1.5% ] 1.31% | 18,526 | 3.2% |
[ 1.0% - 1.5% ] 1.35% | 24,764 | 6.1% |
[ 1.0% - 1.5% ] 1.36% | 5,131 | 12.8% |
[ 1.0% - 1.5% ] 1.41% | 56,490 | 7.3% |
[ 1.0% - 1.5% ] 1.45% | 12,672 | 5.2% |
[ 1.0% - 1.5% ] 1.49% | 40,198 | 8.2% |
[ 1.5% - 2.0% ] 1.53% | 25,728 | 5.5% |
[ 1.5% - 2.0% ] 1.55% | 32,400 | 6.2% |
[ 1.5% - 2.0% ] 1.65% | 4,801 | 2.9% |
[ 1.5% - 2.0% ] 1.69% | 8,620 | 12.7% |
[ 1.5% - 2.0% ] 1.72% | 57,708 | 5.2% |
[ 1.5% - 2.0% ] 1.77% | 5,653 | 1.7% |
[ 1.5% - 2.0% ] 1.79% | 2,514 | 4.2% |
[ 1.5% - 2.0% ] 1.83% | 3,058 | 5.6% |
[ 1.5% - 2.0% ] 1.86% | 10,439 | 12.3% |
[ 2.0% - 2.5% ] 2.15% | 45,387 | 2.6% |
[ 2.0% - 2.5% ] 2.34% | 37,647 | 3.5% |
[ 2.0% - 2.5% ] 2.36% | 27,076 | 11.1% |
[ 2.0% - 2.5% ] 2.41% | 25,355 | 10.8% |
[ 2.5% - 3.0% ] 2.65% | 34,752 | 4.8% |
[ 2.5% - 3.0% ] 2.66% | 19,719 | 13.2% |
[ 2.5% - 3.0% ] 2.76% | 8,565 | 6.3% |
[ 2.5% - 3.0% ] 2.80% | 1,642 | 18.6% |
[ 2.5% - 3.0% ] 2.84% | 1,515 | 6.2% |
[ 2.5% - 3.0% ] 2.95% | 2,914 | 28.8% |
[ 2.5% - 3.0% ] 2.98% | 1,880 | 1.7% |
[ 3.0% - 3.5% ] 3.14% | 7,365 | 3.1% |
[ 3.0% - 3.5% ] 3.31% | 28,882 | 6.5% |
[ 4.0% - 4.5% ] 4.45% | 38,756 | 3.1% |