Immigrants from Iran Disability Age 5 to 17
COMPARE
Immigrants from Iran
Select to Compare
Disability Age 5 to 17
Immigrants from Iran Disability Age 5 to 17
4.4%
DISABILITY | AGE 5 TO 17
100.0/ 100
METRIC RATING
5th/ 347
METRIC RANK
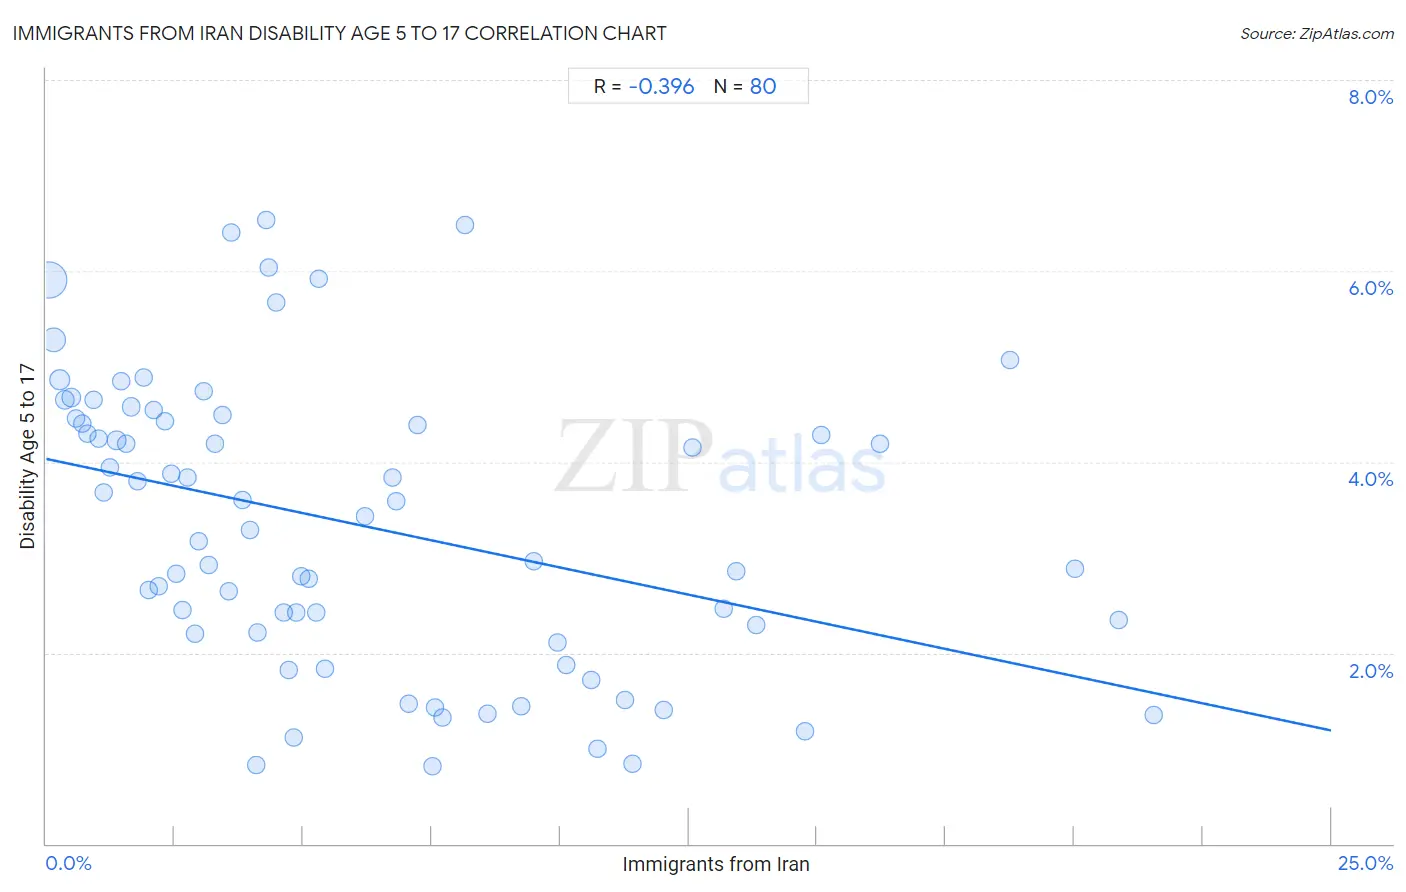
Immigrants from Iran Disability Age 5 to 17 Correlation Chart
The statistical analysis conducted on geographies consisting of 278,151,157 people shows a mild negative correlation between the proportion of Immigrants from Iran and percentage of population with a disability between the ages 5 and 17 in the United States with a correlation coefficient (R) of -0.396 and weighted average of 4.4%. On average, for every 1% (one percent) increase in Immigrants from Iran within a typical geography, there is a decrease of 0.11% in percentage of population with a disability between the ages 5 and 17.
It is essential to understand that the correlation between the percentage of Immigrants from Iran and percentage of population with a disability between the ages 5 and 17 does not imply a direct cause-and-effect relationship. It remains uncertain whether the presence of Immigrants from Iran influences an upward or downward trend in the level of percentage of population with a disability between the ages 5 and 17 within an area, or if Immigrants from Iran simply ended up residing in those areas with higher or lower levels of percentage of population with a disability between the ages 5 and 17 due to other factors.
Demographics Similar to Immigrants from Iran by Disability Age 5 to 17
In terms of disability age 5 to 17, the demographic groups most similar to Immigrants from Iran are Filipino (4.3%, a difference of 0.55%), Immigrants from Hong Kong (4.3%, a difference of 1.5%), Immigrants from Israel (4.5%, a difference of 3.4%), Immigrants from China (4.5%, a difference of 3.7%), and Immigrants from Taiwan (4.2%, a difference of 4.1%).
| Demographics | Rating | Rank | Disability Age 5 to 17 |
| Immigrants from Armenia | 100.0 /100 | #1 | Exceptional 4.1% |
| Immigrants from Taiwan | 100.0 /100 | #2 | Exceptional 4.2% |
| Immigrants from Hong Kong | 100.0 /100 | #3 | Exceptional 4.3% |
| Filipinos | 100.0 /100 | #4 | Exceptional 4.3% |
| Immigrants from Iran | 100.0 /100 | #5 | Exceptional 4.4% |
| Immigrants from Israel | 100.0 /100 | #6 | Exceptional 4.5% |
| Immigrants from China | 100.0 /100 | #7 | Exceptional 4.5% |
| Indians (Asian) | 100.0 /100 | #8 | Exceptional 4.6% |
| Immigrants from Eastern Asia | 100.0 /100 | #9 | Exceptional 4.6% |
| Immigrants from India | 100.0 /100 | #10 | Exceptional 4.6% |
| Armenians | 100.0 /100 | #11 | Exceptional 4.6% |
| Iranians | 100.0 /100 | #12 | Exceptional 4.6% |
| Thais | 100.0 /100 | #13 | Exceptional 4.7% |
| Immigrants from Korea | 100.0 /100 | #14 | Exceptional 4.7% |
| Chinese | 100.0 /100 | #15 | Exceptional 4.7% |
Immigrants from Iran Disability Age 5 to 17 Correlation Summary
| Measurement | Immigrants from Iran Data | Disability Age 5 to 17 Data |
| Minimum | 0.052% | 0.81% |
| Maximum | 21.5% | 6.5% |
| Range | 21.5% | 5.7% |
| Mean | 6.1% | 3.3% |
| Median | 4.4% | 3.4% |
| Interquartile 25% (IQ1) | 2.1% | 2.2% |
| Interquartile 75% (IQ3) | 8.9% | 4.4% |
| Interquartile Range (IQR) | 6.8% | 2.2% |
| Standard Deviation (Sample) | 5.2% | 1.5% |
| Standard Deviation (Population) | 5.2% | 1.5% |
Correlation Details
| Immigrants from Iran Percentile | Sample Size | Disability Age 5 to 17 |
[ 0.0% - 0.5% ] 0.052% | 151,336,171 | 5.9% |
[ 0.0% - 0.5% ] 0.15% | 52,853,885 | 5.3% |
[ 0.0% - 0.5% ] 0.26% | 24,528,711 | 4.9% |
[ 0.0% - 0.5% ] 0.37% | 13,002,918 | 4.6% |
[ 0.0% - 0.5% ] 0.49% | 9,886,510 | 4.7% |
[ 0.5% - 1.0% ] 0.58% | 4,613,361 | 4.5% |
[ 0.5% - 1.0% ] 0.70% | 3,052,558 | 4.4% |
[ 0.5% - 1.0% ] 0.81% | 1,956,613 | 4.3% |
[ 0.5% - 1.0% ] 0.91% | 2,316,186 | 4.6% |
[ 1.0% - 1.5% ] 1.01% | 2,171,544 | 4.2% |
[ 1.0% - 1.5% ] 1.12% | 652,885 | 3.7% |
[ 1.0% - 1.5% ] 1.24% | 1,331,648 | 3.9% |
[ 1.0% - 1.5% ] 1.37% | 4,514,427 | 4.2% |
[ 1.0% - 1.5% ] 1.46% | 506,135 | 4.8% |
[ 1.5% - 2.0% ] 1.56% | 769,046 | 4.2% |
[ 1.5% - 2.0% ] 1.66% | 358,437 | 4.6% |
[ 1.5% - 2.0% ] 1.78% | 311,533 | 3.8% |
[ 1.5% - 2.0% ] 1.89% | 262,166 | 4.9% |
[ 1.5% - 2.0% ] 1.99% | 137,357 | 2.7% |
[ 2.0% - 2.5% ] 2.10% | 167,831 | 4.5% |
[ 2.0% - 2.5% ] 2.20% | 188,131 | 2.7% |
[ 2.0% - 2.5% ] 2.31% | 174,140 | 4.4% |
[ 2.0% - 2.5% ] 2.44% | 80,534 | 3.9% |
[ 2.5% - 3.0% ] 2.53% | 156,134 | 2.8% |
[ 2.5% - 3.0% ] 2.65% | 60,913 | 2.5% |
[ 2.5% - 3.0% ] 2.74% | 228,797 | 3.8% |
[ 2.5% - 3.0% ] 2.90% | 31,845 | 2.2% |
[ 2.5% - 3.0% ] 2.97% | 166,645 | 3.2% |
[ 3.0% - 3.5% ] 3.06% | 91,431 | 4.7% |
[ 3.0% - 3.5% ] 3.17% | 364,934 | 2.9% |
[ 3.0% - 3.5% ] 3.28% | 205,159 | 4.2% |
[ 3.0% - 3.5% ] 3.42% | 105,514 | 4.5% |
[ 3.5% - 4.0% ] 3.54% | 104,589 | 2.6% |
[ 3.5% - 4.0% ] 3.59% | 32,124 | 6.4% |
[ 3.5% - 4.0% ] 3.82% | 28,952 | 3.6% |
[ 3.5% - 4.0% ] 3.95% | 24,177 | 3.3% |
[ 4.0% - 4.5% ] 4.09% | 6,915 | 0.83% |
[ 4.0% - 4.5% ] 4.10% | 25,887 | 2.2% |
[ 4.0% - 4.5% ] 4.28% | 20,411 | 6.5% |
[ 4.0% - 4.5% ] 4.33% | 4,410 | 6.0% |
[ 4.0% - 4.5% ] 4.46% | 133,954 | 5.7% |
[ 4.5% - 5.0% ] 4.62% | 21,080 | 2.4% |
[ 4.5% - 5.0% ] 4.72% | 35,452 | 1.8% |
[ 4.5% - 5.0% ] 4.81% | 1,350 | 1.1% |
[ 4.5% - 5.0% ] 4.88% | 38,003 | 2.4% |
[ 4.5% - 5.0% ] 4.96% | 29,544 | 2.8% |
[ 5.0% - 5.5% ] 5.12% | 26,318 | 2.8% |
[ 5.0% - 5.5% ] 5.26% | 35,819 | 2.4% |
[ 5.0% - 5.5% ] 5.30% | 73,595 | 5.9% |
[ 5.0% - 5.5% ] 5.43% | 54,074 | 1.8% |
[ 6.0% - 6.5% ] 6.19% | 28,792 | 3.4% |
[ 6.5% - 7.0% ] 6.74% | 30,549 | 3.8% |
[ 6.5% - 7.0% ] 6.80% | 30,599 | 3.6% |
[ 7.0% - 7.5% ] 7.05% | 2,936 | 1.5% |
[ 7.0% - 7.5% ] 7.22% | 44,429 | 4.4% |
[ 7.5% - 8.0% ] 7.51% | 7,509 | 0.81% |
[ 7.5% - 8.0% ] 7.58% | 28,765 | 1.4% |
[ 7.5% - 8.0% ] 7.72% | 50,392 | 1.3% |
[ 8.0% - 8.5% ] 8.15% | 44,862 | 6.5% |
[ 8.5% - 9.0% ] 8.58% | 15,377 | 1.4% |
[ 9.0% - 9.5% ] 9.24% | 35,755 | 1.4% |
[ 9.0% - 9.5% ] 9.48% | 7,868 | 3.0% |
[ 9.5% - 10.0% ] 9.95% | 16,190 | 2.1% |
[ 10.0% - 10.5% ] 10.11% | 49,408 | 1.9% |
[ 10.5% - 11.0% ] 10.60% | 11,060 | 1.7% |
[ 10.5% - 11.0% ] 10.73% | 1,445 | 1.0% |
[ 11.0% - 11.5% ] 11.26% | 23,193 | 1.5% |
[ 11.0% - 11.5% ] 11.42% | 18,445 | 0.84% |
[ 12.0% - 12.5% ] 12.01% | 9,699 | 1.4% |
[ 12.5% - 13.0% ] 12.57% | 18,951 | 4.1% |
[ 13.0% - 13.5% ] 13.18% | 59,525 | 2.5% |
[ 13.0% - 13.5% ] 13.42% | 9,105 | 2.9% |
[ 13.5% - 14.0% ] 13.81% | 194,512 | 2.3% |
[ 14.5% - 15.0% ] 14.76% | 51,474 | 1.2% |
[ 15.0% - 15.5% ] 15.07% | 5,593 | 4.3% |
[ 16.0% - 16.5% ] 16.21% | 16,679 | 4.2% |
[ 18.5% - 19.0% ] 18.76% | 22,831 | 5.1% |
[ 20.0% - 20.5% ] 20.01% | 22,163 | 2.9% |
[ 20.5% - 21.0% ] 20.87% | 11,091 | 2.3% |
[ 21.5% - 22.0% ] 21.54% | 1,207 | 1.4% |