Ethiopian Disability Age 5 to 17
COMPARE
Ethiopian
Select to Compare
Disability Age 5 to 17
Ethiopian Disability Age 5 to 17
5.3%
DISABILITY | AGE 5 TO 17
97.9/ 100
METRIC RATING
111th/ 347
METRIC RANK
Ethiopian Disability Age 5 to 17 Correlation Chart
The statistical analysis conducted on geographies consisting of 222,418,387 people shows a significant positive correlation between the proportion of Ethiopians and percentage of population with a disability between the ages 5 and 17 in the United States with a correlation coefficient (R) of 0.607 and weighted average of 5.3%. On average, for every 1% (one percent) increase in Ethiopians within a typical geography, there is an increase of 0.27% in percentage of population with a disability between the ages 5 and 17.
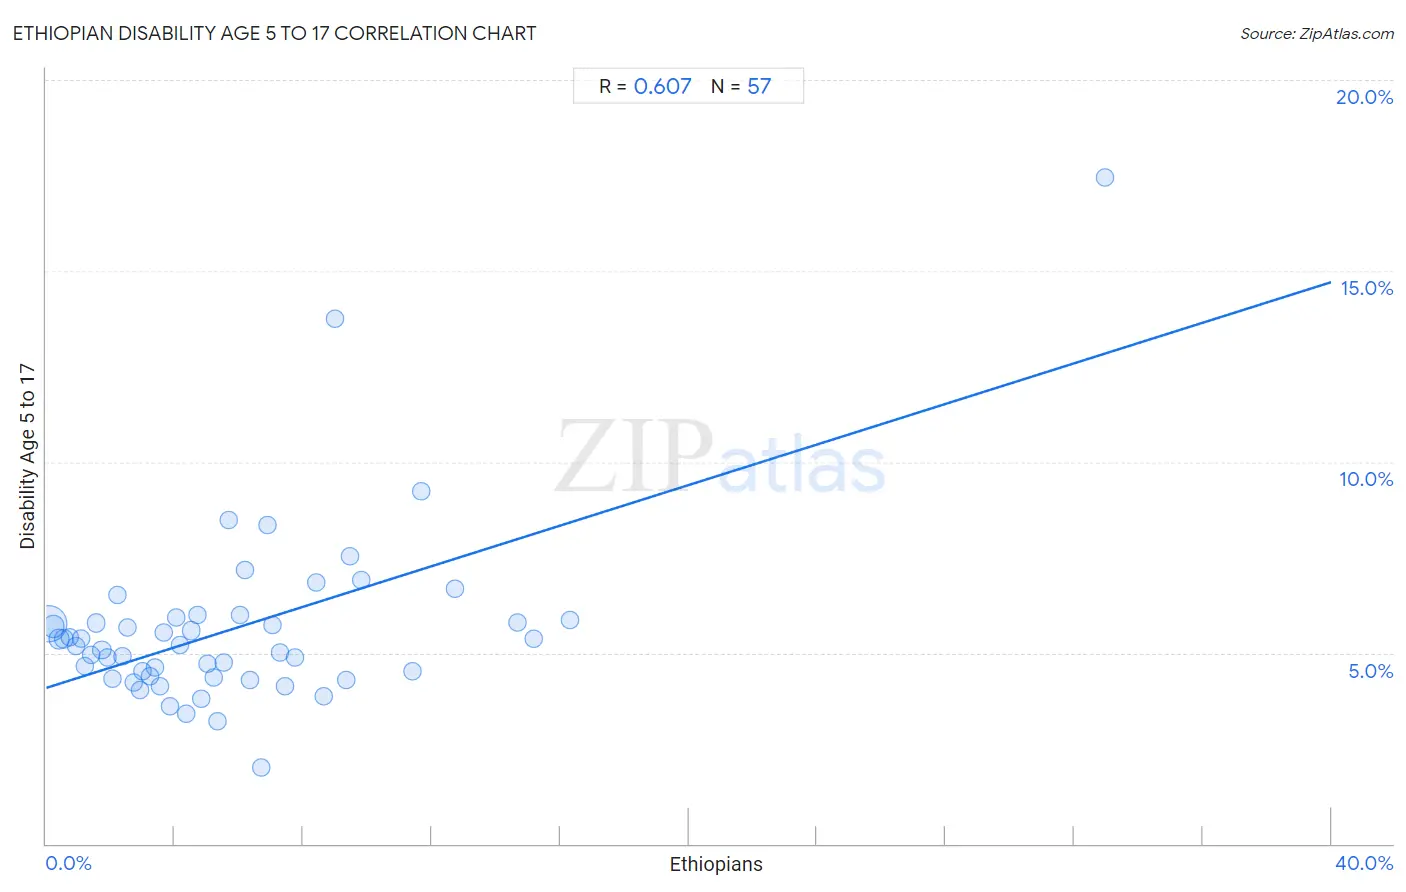
It is essential to understand that the correlation between the percentage of Ethiopians and percentage of population with a disability between the ages 5 and 17 does not imply a direct cause-and-effect relationship. It remains uncertain whether the presence of Ethiopians influences an upward or downward trend in the level of percentage of population with a disability between the ages 5 and 17 within an area, or if Ethiopians simply ended up residing in those areas with higher or lower levels of percentage of population with a disability between the ages 5 and 17 due to other factors.
Demographics Similar to Ethiopians by Disability Age 5 to 17
In terms of disability age 5 to 17, the demographic groups most similar to Ethiopians are Immigrants from Latvia (5.3%, a difference of 0.020%), Immigrants from Eritrea (5.3%, a difference of 0.040%), Aleut (5.3%, a difference of 0.060%), Immigrants from Northern Africa (5.3%, a difference of 0.080%), and Immigrants from Northern Europe (5.3%, a difference of 0.090%).
| Demographics | Rating | Rank | Disability Age 5 to 17 |
| Peruvians | 98.5 /100 | #104 | Exceptional 5.3% |
| Immigrants from Italy | 98.4 /100 | #105 | Exceptional 5.3% |
| Immigrants from Yemen | 98.2 /100 | #106 | Exceptional 5.3% |
| Russians | 98.2 /100 | #107 | Exceptional 5.3% |
| Immigrants from South Africa | 98.1 /100 | #108 | Exceptional 5.3% |
| Immigrants from Northern Africa | 98.1 /100 | #109 | Exceptional 5.3% |
| Immigrants from Eritrea | 98.0 /100 | #110 | Exceptional 5.3% |
| Ethiopians | 97.9 /100 | #111 | Exceptional 5.3% |
| Immigrants from Latvia | 97.9 /100 | #112 | Exceptional 5.3% |
| Aleuts | 97.8 /100 | #113 | Exceptional 5.3% |
| Immigrants from Northern Europe | 97.8 /100 | #114 | Exceptional 5.3% |
| Cubans | 97.8 /100 | #115 | Exceptional 5.3% |
| Cypriots | 97.7 /100 | #116 | Exceptional 5.3% |
| Immigrants from Afghanistan | 97.4 /100 | #117 | Exceptional 5.3% |
| South Americans | 97.1 /100 | #118 | Exceptional 5.4% |
Ethiopian Disability Age 5 to 17 Correlation Summary
| Measurement | Ethiopian Data | Disability Age 5 to 17 Data |
| Minimum | 0.064% | 2.0% |
| Maximum | 33.0% | 17.5% |
| Range | 32.9% | 15.4% |
| Mean | 5.8% | 5.6% |
| Median | 4.7% | 5.2% |
| Interquartile 25% (IQ1) | 2.3% | 4.4% |
| Interquartile 75% (IQ3) | 7.6% | 5.9% |
| Interquartile Range (IQR) | 5.3% | 1.5% |
| Standard Deviation (Sample) | 5.4% | 2.3% |
| Standard Deviation (Population) | 5.3% | 2.3% |
Correlation Details
| Ethiopian Percentile | Sample Size | Disability Age 5 to 17 |
[ 0.0% - 0.5% ] 0.064% | 142,986,317 | 5.7% |
[ 0.0% - 0.5% ] 0.22% | 34,694,154 | 5.7% |
[ 0.0% - 0.5% ] 0.40% | 14,173,517 | 5.4% |
[ 0.5% - 1.0% ] 0.56% | 7,824,539 | 5.4% |
[ 0.5% - 1.0% ] 0.74% | 3,622,408 | 5.4% |
[ 0.5% - 1.0% ] 0.91% | 3,625,033 | 5.2% |
[ 1.0% - 1.5% ] 1.08% | 2,765,367 | 5.4% |
[ 1.0% - 1.5% ] 1.21% | 2,488,052 | 4.7% |
[ 1.0% - 1.5% ] 1.41% | 1,580,852 | 4.9% |
[ 1.5% - 2.0% ] 1.56% | 1,742,032 | 5.8% |
[ 1.5% - 2.0% ] 1.73% | 962,869 | 5.1% |
[ 1.5% - 2.0% ] 1.89% | 785,530 | 4.9% |
[ 2.0% - 2.5% ] 2.07% | 379,980 | 4.3% |
[ 2.0% - 2.5% ] 2.21% | 542,547 | 6.5% |
[ 2.0% - 2.5% ] 2.39% | 173,348 | 4.9% |
[ 2.5% - 3.0% ] 2.55% | 381,336 | 5.7% |
[ 2.5% - 3.0% ] 2.73% | 255,665 | 4.2% |
[ 2.5% - 3.0% ] 2.92% | 208,404 | 4.0% |
[ 3.0% - 3.5% ] 3.00% | 467,724 | 4.5% |
[ 3.0% - 3.5% ] 3.22% | 235,560 | 4.4% |
[ 3.0% - 3.5% ] 3.38% | 286,416 | 4.6% |
[ 3.5% - 4.0% ] 3.54% | 229,912 | 4.1% |
[ 3.5% - 4.0% ] 3.65% | 62,039 | 5.5% |
[ 3.5% - 4.0% ] 3.84% | 100,273 | 3.6% |
[ 4.0% - 4.5% ] 4.03% | 156,701 | 5.9% |
[ 4.0% - 4.5% ] 4.18% | 124,288 | 5.2% |
[ 4.0% - 4.5% ] 4.36% | 78,603 | 3.4% |
[ 4.5% - 5.0% ] 4.52% | 264,356 | 5.6% |
[ 4.5% - 5.0% ] 4.72% | 36,667 | 6.0% |
[ 4.5% - 5.0% ] 4.82% | 84,569 | 3.8% |
[ 5.0% - 5.5% ] 5.03% | 132,495 | 4.7% |
[ 5.0% - 5.5% ] 5.23% | 164,550 | 4.4% |
[ 5.0% - 5.5% ] 5.33% | 55,439 | 3.2% |
[ 5.5% - 6.0% ] 5.53% | 92,792 | 4.8% |
[ 5.5% - 6.0% ] 5.69% | 26,996 | 8.5% |
[ 6.0% - 6.5% ] 6.02% | 26,595 | 6.0% |
[ 6.0% - 6.5% ] 6.18% | 45,072 | 7.2% |
[ 6.0% - 6.5% ] 6.32% | 43,013 | 4.3% |
[ 6.5% - 7.0% ] 6.71% | 14,098 | 2.0% |
[ 6.5% - 7.0% ] 6.89% | 60,937 | 8.4% |
[ 7.0% - 7.5% ] 7.05% | 24,581 | 5.7% |
[ 7.0% - 7.5% ] 7.28% | 101,620 | 5.0% |
[ 7.0% - 7.5% ] 7.43% | 26,573 | 4.1% |
[ 7.5% - 8.0% ] 7.74% | 18,324 | 4.9% |
[ 8.0% - 8.5% ] 8.40% | 30,927 | 6.8% |
[ 8.5% - 9.0% ] 8.65% | 64,730 | 3.9% |
[ 8.5% - 9.0% ] 8.97% | 535 | 13.8% |
[ 9.0% - 9.5% ] 9.36% | 25,823 | 4.3% |
[ 9.0% - 9.5% ] 9.44% | 49,711 | 7.5% |
[ 9.5% - 10.0% ] 9.81% | 38,318 | 6.9% |
[ 11.0% - 11.5% ] 11.38% | 5,359 | 4.5% |
[ 11.5% - 12.0% ] 11.67% | 26,684 | 9.2% |
[ 12.5% - 13.0% ] 12.73% | 1,885 | 6.7% |
[ 14.5% - 15.0% ] 14.66% | 3,514 | 5.8% |
[ 15.0% - 15.5% ] 15.16% | 4,023 | 5.4% |
[ 16.0% - 16.5% ] 16.31% | 14,553 | 5.8% |
[ 32.5% - 33.0% ] 32.97% | 182 | 17.5% |